Free Statistics

of Irreproducible Research!

Author's title

Author*Unverified author*
R Software Modulerwasp_autocorrelation.wasp
Title produced by software(Partial) Autocorrelation Function
Date of computationFri, 15 Nov 2013 09:38:47 -0500
Cite this page as followsStatistical Computations at FreeStatistics.org, Office for Research Development and Education, URL https://freestatistics.org/blog/index.php?v=date/2013/Nov/15/t1384526388txg5pppjfbpnu03.htm/, Retrieved Tue, 30 Apr 2024 12:03:00 +0000
Statistical Computations at FreeStatistics.org, Office for Research Development and Education, URL https://freestatistics.org/blog/index.php?pk=225497, Retrieved Tue, 30 Apr 2024 12:03:00 +0000
QR Codes:

Original text written by user:
IsPrivate?No (this computation is public)
User-defined keywords
Estimated Impact54
Family? (F = Feedback message, R = changed R code, M = changed R Module, P = changed Parameters, D = changed Data)
-       [(Partial) Autocorrelation Function] [] [2013-11-15 14:38:47] [a51ebb1a550b3d5f2cc4b9cf02171f8b] [Current]
Feedback Forum

Post a new message
Dataseries X:
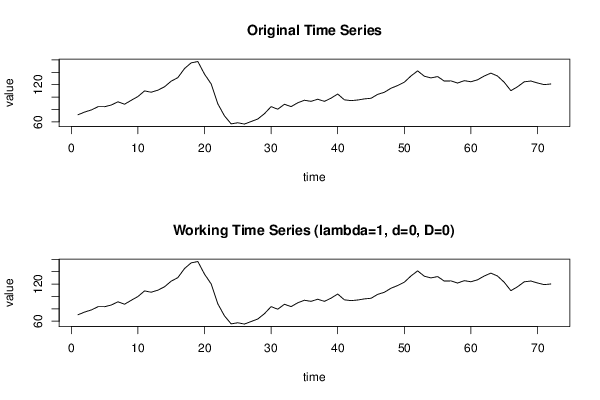
71.4
75.8
79.2
84.4
84.4
87.2
92.4
88.5
94.8
100.9
110
107.9
111.2
116.7
125.8
131.5
146.2
155.4
157.5
137.2
121.3
89.1
69.6
56.7
58.5
56.4
60.5
64.6
73.2
84.6
80.4
88.4
84.6
90.8
94.9
93.1
96.6
93.1
98.3
105
95.6
94.3
95.3
97.1
98.1
104.4
107.8
114.3
118.7
124.1
134.2
142.4
133.8
131
133.2
125.9
126.2
122.7
126.6
124.8
128
134.1
138.8
134
124
110.4
116.7
124.7
126
122.8
120.2
121.2


Summary of computational transaction
Raw Inputview raw input (R code)
Raw Outputview raw output of R engine
Computing time4 seconds
R Server'Herman Ole Andreas Wold' @ wold.wessa.net

\begin{tabular}{lllllllll}
\hline
Summary of computational transaction \tabularnewline
Raw Input & view raw input (R code)  \tabularnewline
Raw Output & view raw output of R engine  \tabularnewline
Computing time & 4 seconds \tabularnewline
R Server & 'Herman Ole Andreas Wold' @ wold.wessa.net \tabularnewline
\hline
\end{tabular}
%Source: https://freestatistics.org/blog/index.php?pk=225497&T=0

[TABLE]
[ROW][C]Summary of computational transaction[/C][/ROW]
[ROW][C]Raw Input[/C][C]view raw input (R code) [/C][/ROW]
[ROW][C]Raw Output[/C][C]view raw output of R engine [/C][/ROW]
[ROW][C]Computing time[/C][C]4 seconds[/C][/ROW]
[ROW][C]R Server[/C][C]'Herman Ole Andreas Wold' @ wold.wessa.net[/C][/ROW]
[/TABLE]
Source: https://freestatistics.org/blog/index.php?pk=225497&T=0

Globally Unique Identifier (entire table): ba.freestatistics.org/blog/index.php?pk=225497&T=0

As an alternative you can also use a QR Code:  

The GUIDs for individual cells are displayed in the table below:

Summary of computational transaction
Raw Inputview raw input (R code)
Raw Outputview raw output of R engine
Computing time4 seconds
R Server'Herman Ole Andreas Wold' @ wold.wessa.net


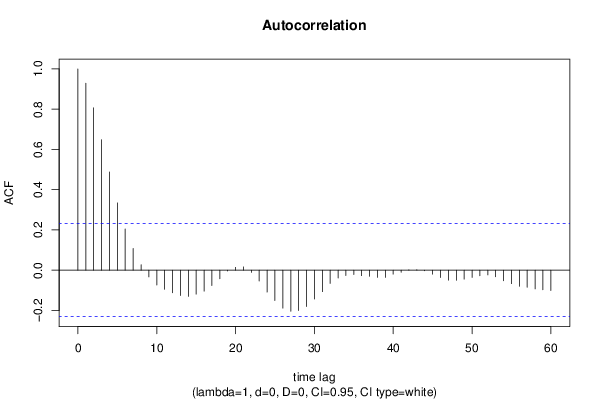
Autocorrelation Function
Time lag kACF(k)T-STATP-value
10.9292317.88480
20.8064886.84330
30.6484415.50220
40.4882194.14274.6e-05
50.3343242.83680.002957
60.2045441.73560.043455
70.1074230.91150.182532
80.0272640.23130.408854
9-0.033416-0.28350.388788
10-0.073476-0.62350.267475
11-0.095044-0.80650.211312
12-0.112654-0.95590.17116
13-0.125931-1.06860.14442
14-0.130325-1.10580.136238
15-0.119104-1.01060.157788
16-0.104075-0.88310.190059
17-0.076032-0.64510.260441
18-0.042729-0.36260.358994
19-0.004319-0.03670.485432
200.0140660.11940.452662
210.0162840.13820.445245
22-0.010947-0.09290.463126
23-0.053899-0.45730.324399
24-0.108958-0.92450.179148
25-0.150916-1.28060.102228
26-0.18856-1.60.05699
27-0.203801-1.72930.044019
28-0.200676-1.70280.04646
29-0.180298-1.52990.065214
30-0.142975-1.21320.114513
31-0.106706-0.90540.18413
32-0.065706-0.55750.289447
33-0.039206-0.33270.370172
34-0.026235-0.22260.412233
35-0.021876-0.18560.426632
36-0.027006-0.22920.4097
37-0.03001-0.25460.399863
38-0.035782-0.30360.381146
39-0.035698-0.30290.381417
40-0.019771-0.16780.433622
41-0.010339-0.08770.465168
420.0008470.00720.497144
430.0018630.01580.493717
44-0.003016-0.02560.489826
45-0.019733-0.16740.433747
46-0.0363-0.3080.379479
47-0.049541-0.42040.337732
48-0.050174-0.42570.335785
49-0.044444-0.37710.353598
50-0.035929-0.30490.380674
51-0.027699-0.2350.407424
52-0.023501-0.19940.421252
53-0.032957-0.27970.390273
54-0.052251-0.44340.329417
55-0.066775-0.56660.286371
56-0.079638-0.67570.250683
57-0.085093-0.7220.236305
58-0.092933-0.78860.216478
59-0.097372-0.82620.205702
60-0.100784-0.85520.197644

\begin{tabular}{lllllllll}
\hline
Autocorrelation Function \tabularnewline
Time lag k & ACF(k) & T-STAT & P-value \tabularnewline
1 & 0.929231 & 7.8848 & 0 \tabularnewline
2 & 0.806488 & 6.8433 & 0 \tabularnewline
3 & 0.648441 & 5.5022 & 0 \tabularnewline
4 & 0.488219 & 4.1427 & 4.6e-05 \tabularnewline
5 & 0.334324 & 2.8368 & 0.002957 \tabularnewline
6 & 0.204544 & 1.7356 & 0.043455 \tabularnewline
7 & 0.107423 & 0.9115 & 0.182532 \tabularnewline
8 & 0.027264 & 0.2313 & 0.408854 \tabularnewline
9 & -0.033416 & -0.2835 & 0.388788 \tabularnewline
10 & -0.073476 & -0.6235 & 0.267475 \tabularnewline
11 & -0.095044 & -0.8065 & 0.211312 \tabularnewline
12 & -0.112654 & -0.9559 & 0.17116 \tabularnewline
13 & -0.125931 & -1.0686 & 0.14442 \tabularnewline
14 & -0.130325 & -1.1058 & 0.136238 \tabularnewline
15 & -0.119104 & -1.0106 & 0.157788 \tabularnewline
16 & -0.104075 & -0.8831 & 0.190059 \tabularnewline
17 & -0.076032 & -0.6451 & 0.260441 \tabularnewline
18 & -0.042729 & -0.3626 & 0.358994 \tabularnewline
19 & -0.004319 & -0.0367 & 0.485432 \tabularnewline
20 & 0.014066 & 0.1194 & 0.452662 \tabularnewline
21 & 0.016284 & 0.1382 & 0.445245 \tabularnewline
22 & -0.010947 & -0.0929 & 0.463126 \tabularnewline
23 & -0.053899 & -0.4573 & 0.324399 \tabularnewline
24 & -0.108958 & -0.9245 & 0.179148 \tabularnewline
25 & -0.150916 & -1.2806 & 0.102228 \tabularnewline
26 & -0.18856 & -1.6 & 0.05699 \tabularnewline
27 & -0.203801 & -1.7293 & 0.044019 \tabularnewline
28 & -0.200676 & -1.7028 & 0.04646 \tabularnewline
29 & -0.180298 & -1.5299 & 0.065214 \tabularnewline
30 & -0.142975 & -1.2132 & 0.114513 \tabularnewline
31 & -0.106706 & -0.9054 & 0.18413 \tabularnewline
32 & -0.065706 & -0.5575 & 0.289447 \tabularnewline
33 & -0.039206 & -0.3327 & 0.370172 \tabularnewline
34 & -0.026235 & -0.2226 & 0.412233 \tabularnewline
35 & -0.021876 & -0.1856 & 0.426632 \tabularnewline
36 & -0.027006 & -0.2292 & 0.4097 \tabularnewline
37 & -0.03001 & -0.2546 & 0.399863 \tabularnewline
38 & -0.035782 & -0.3036 & 0.381146 \tabularnewline
39 & -0.035698 & -0.3029 & 0.381417 \tabularnewline
40 & -0.019771 & -0.1678 & 0.433622 \tabularnewline
41 & -0.010339 & -0.0877 & 0.465168 \tabularnewline
42 & 0.000847 & 0.0072 & 0.497144 \tabularnewline
43 & 0.001863 & 0.0158 & 0.493717 \tabularnewline
44 & -0.003016 & -0.0256 & 0.489826 \tabularnewline
45 & -0.019733 & -0.1674 & 0.433747 \tabularnewline
46 & -0.0363 & -0.308 & 0.379479 \tabularnewline
47 & -0.049541 & -0.4204 & 0.337732 \tabularnewline
48 & -0.050174 & -0.4257 & 0.335785 \tabularnewline
49 & -0.044444 & -0.3771 & 0.353598 \tabularnewline
50 & -0.035929 & -0.3049 & 0.380674 \tabularnewline
51 & -0.027699 & -0.235 & 0.407424 \tabularnewline
52 & -0.023501 & -0.1994 & 0.421252 \tabularnewline
53 & -0.032957 & -0.2797 & 0.390273 \tabularnewline
54 & -0.052251 & -0.4434 & 0.329417 \tabularnewline
55 & -0.066775 & -0.5666 & 0.286371 \tabularnewline
56 & -0.079638 & -0.6757 & 0.250683 \tabularnewline
57 & -0.085093 & -0.722 & 0.236305 \tabularnewline
58 & -0.092933 & -0.7886 & 0.216478 \tabularnewline
59 & -0.097372 & -0.8262 & 0.205702 \tabularnewline
60 & -0.100784 & -0.8552 & 0.197644 \tabularnewline
\hline
\end{tabular}
%Source: https://freestatistics.org/blog/index.php?pk=225497&T=1

[TABLE]
[ROW][C]Autocorrelation Function[/C][/ROW]
[ROW][C]Time lag k[/C][C]ACF(k)[/C][C]T-STAT[/C][C]P-value[/C][/ROW]
[ROW][C]1[/C][C]0.929231[/C][C]7.8848[/C][C]0[/C][/ROW]
[ROW][C]2[/C][C]0.806488[/C][C]6.8433[/C][C]0[/C][/ROW]
[ROW][C]3[/C][C]0.648441[/C][C]5.5022[/C][C]0[/C][/ROW]
[ROW][C]4[/C][C]0.488219[/C][C]4.1427[/C][C]4.6e-05[/C][/ROW]
[ROW][C]5[/C][C]0.334324[/C][C]2.8368[/C][C]0.002957[/C][/ROW]
[ROW][C]6[/C][C]0.204544[/C][C]1.7356[/C][C]0.043455[/C][/ROW]
[ROW][C]7[/C][C]0.107423[/C][C]0.9115[/C][C]0.182532[/C][/ROW]
[ROW][C]8[/C][C]0.027264[/C][C]0.2313[/C][C]0.408854[/C][/ROW]
[ROW][C]9[/C][C]-0.033416[/C][C]-0.2835[/C][C]0.388788[/C][/ROW]
[ROW][C]10[/C][C]-0.073476[/C][C]-0.6235[/C][C]0.267475[/C][/ROW]
[ROW][C]11[/C][C]-0.095044[/C][C]-0.8065[/C][C]0.211312[/C][/ROW]
[ROW][C]12[/C][C]-0.112654[/C][C]-0.9559[/C][C]0.17116[/C][/ROW]
[ROW][C]13[/C][C]-0.125931[/C][C]-1.0686[/C][C]0.14442[/C][/ROW]
[ROW][C]14[/C][C]-0.130325[/C][C]-1.1058[/C][C]0.136238[/C][/ROW]
[ROW][C]15[/C][C]-0.119104[/C][C]-1.0106[/C][C]0.157788[/C][/ROW]
[ROW][C]16[/C][C]-0.104075[/C][C]-0.8831[/C][C]0.190059[/C][/ROW]
[ROW][C]17[/C][C]-0.076032[/C][C]-0.6451[/C][C]0.260441[/C][/ROW]
[ROW][C]18[/C][C]-0.042729[/C][C]-0.3626[/C][C]0.358994[/C][/ROW]
[ROW][C]19[/C][C]-0.004319[/C][C]-0.0367[/C][C]0.485432[/C][/ROW]
[ROW][C]20[/C][C]0.014066[/C][C]0.1194[/C][C]0.452662[/C][/ROW]
[ROW][C]21[/C][C]0.016284[/C][C]0.1382[/C][C]0.445245[/C][/ROW]
[ROW][C]22[/C][C]-0.010947[/C][C]-0.0929[/C][C]0.463126[/C][/ROW]
[ROW][C]23[/C][C]-0.053899[/C][C]-0.4573[/C][C]0.324399[/C][/ROW]
[ROW][C]24[/C][C]-0.108958[/C][C]-0.9245[/C][C]0.179148[/C][/ROW]
[ROW][C]25[/C][C]-0.150916[/C][C]-1.2806[/C][C]0.102228[/C][/ROW]
[ROW][C]26[/C][C]-0.18856[/C][C]-1.6[/C][C]0.05699[/C][/ROW]
[ROW][C]27[/C][C]-0.203801[/C][C]-1.7293[/C][C]0.044019[/C][/ROW]
[ROW][C]28[/C][C]-0.200676[/C][C]-1.7028[/C][C]0.04646[/C][/ROW]
[ROW][C]29[/C][C]-0.180298[/C][C]-1.5299[/C][C]0.065214[/C][/ROW]
[ROW][C]30[/C][C]-0.142975[/C][C]-1.2132[/C][C]0.114513[/C][/ROW]
[ROW][C]31[/C][C]-0.106706[/C][C]-0.9054[/C][C]0.18413[/C][/ROW]
[ROW][C]32[/C][C]-0.065706[/C][C]-0.5575[/C][C]0.289447[/C][/ROW]
[ROW][C]33[/C][C]-0.039206[/C][C]-0.3327[/C][C]0.370172[/C][/ROW]
[ROW][C]34[/C][C]-0.026235[/C][C]-0.2226[/C][C]0.412233[/C][/ROW]
[ROW][C]35[/C][C]-0.021876[/C][C]-0.1856[/C][C]0.426632[/C][/ROW]
[ROW][C]36[/C][C]-0.027006[/C][C]-0.2292[/C][C]0.4097[/C][/ROW]
[ROW][C]37[/C][C]-0.03001[/C][C]-0.2546[/C][C]0.399863[/C][/ROW]
[ROW][C]38[/C][C]-0.035782[/C][C]-0.3036[/C][C]0.381146[/C][/ROW]
[ROW][C]39[/C][C]-0.035698[/C][C]-0.3029[/C][C]0.381417[/C][/ROW]
[ROW][C]40[/C][C]-0.019771[/C][C]-0.1678[/C][C]0.433622[/C][/ROW]
[ROW][C]41[/C][C]-0.010339[/C][C]-0.0877[/C][C]0.465168[/C][/ROW]
[ROW][C]42[/C][C]0.000847[/C][C]0.0072[/C][C]0.497144[/C][/ROW]
[ROW][C]43[/C][C]0.001863[/C][C]0.0158[/C][C]0.493717[/C][/ROW]
[ROW][C]44[/C][C]-0.003016[/C][C]-0.0256[/C][C]0.489826[/C][/ROW]
[ROW][C]45[/C][C]-0.019733[/C][C]-0.1674[/C][C]0.433747[/C][/ROW]
[ROW][C]46[/C][C]-0.0363[/C][C]-0.308[/C][C]0.379479[/C][/ROW]
[ROW][C]47[/C][C]-0.049541[/C][C]-0.4204[/C][C]0.337732[/C][/ROW]
[ROW][C]48[/C][C]-0.050174[/C][C]-0.4257[/C][C]0.335785[/C][/ROW]
[ROW][C]49[/C][C]-0.044444[/C][C]-0.3771[/C][C]0.353598[/C][/ROW]
[ROW][C]50[/C][C]-0.035929[/C][C]-0.3049[/C][C]0.380674[/C][/ROW]
[ROW][C]51[/C][C]-0.027699[/C][C]-0.235[/C][C]0.407424[/C][/ROW]
[ROW][C]52[/C][C]-0.023501[/C][C]-0.1994[/C][C]0.421252[/C][/ROW]
[ROW][C]53[/C][C]-0.032957[/C][C]-0.2797[/C][C]0.390273[/C][/ROW]
[ROW][C]54[/C][C]-0.052251[/C][C]-0.4434[/C][C]0.329417[/C][/ROW]
[ROW][C]55[/C][C]-0.066775[/C][C]-0.5666[/C][C]0.286371[/C][/ROW]
[ROW][C]56[/C][C]-0.079638[/C][C]-0.6757[/C][C]0.250683[/C][/ROW]
[ROW][C]57[/C][C]-0.085093[/C][C]-0.722[/C][C]0.236305[/C][/ROW]
[ROW][C]58[/C][C]-0.092933[/C][C]-0.7886[/C][C]0.216478[/C][/ROW]
[ROW][C]59[/C][C]-0.097372[/C][C]-0.8262[/C][C]0.205702[/C][/ROW]
[ROW][C]60[/C][C]-0.100784[/C][C]-0.8552[/C][C]0.197644[/C][/ROW]
[/TABLE]
Source: https://freestatistics.org/blog/index.php?pk=225497&T=1

Globally Unique Identifier (entire table): ba.freestatistics.org/blog/index.php?pk=225497&T=1

As an alternative you can also use a QR Code:  

The GUIDs for individual cells are displayed in the table below:

Autocorrelation Function
Time lag kACF(k)T-STATP-value
10.9292317.88480
20.8064886.84330
30.6484415.50220
40.4882194.14274.6e-05
50.3343242.83680.002957
60.2045441.73560.043455
70.1074230.91150.182532
80.0272640.23130.408854
9-0.033416-0.28350.388788
10-0.073476-0.62350.267475
11-0.095044-0.80650.211312
12-0.112654-0.95590.17116
13-0.125931-1.06860.14442
14-0.130325-1.10580.136238
15-0.119104-1.01060.157788
16-0.104075-0.88310.190059
17-0.076032-0.64510.260441
18-0.042729-0.36260.358994
19-0.004319-0.03670.485432
200.0140660.11940.452662
210.0162840.13820.445245
22-0.010947-0.09290.463126
23-0.053899-0.45730.324399
24-0.108958-0.92450.179148
25-0.150916-1.28060.102228
26-0.18856-1.60.05699
27-0.203801-1.72930.044019
28-0.200676-1.70280.04646
29-0.180298-1.52990.065214
30-0.142975-1.21320.114513
31-0.106706-0.90540.18413
32-0.065706-0.55750.289447
33-0.039206-0.33270.370172
34-0.026235-0.22260.412233
35-0.021876-0.18560.426632
36-0.027006-0.22920.4097
37-0.03001-0.25460.399863
38-0.035782-0.30360.381146
39-0.035698-0.30290.381417
40-0.019771-0.16780.433622
41-0.010339-0.08770.465168
420.0008470.00720.497144
430.0018630.01580.493717
44-0.003016-0.02560.489826
45-0.019733-0.16740.433747
46-0.0363-0.3080.379479
47-0.049541-0.42040.337732
48-0.050174-0.42570.335785
49-0.044444-0.37710.353598
50-0.035929-0.30490.380674
51-0.027699-0.2350.407424
52-0.023501-0.19940.421252
53-0.032957-0.27970.390273
54-0.052251-0.44340.329417
55-0.066775-0.56660.286371
56-0.079638-0.67570.250683
57-0.085093-0.7220.236305
58-0.092933-0.78860.216478
59-0.097372-0.82620.205702
60-0.100784-0.85520.197644


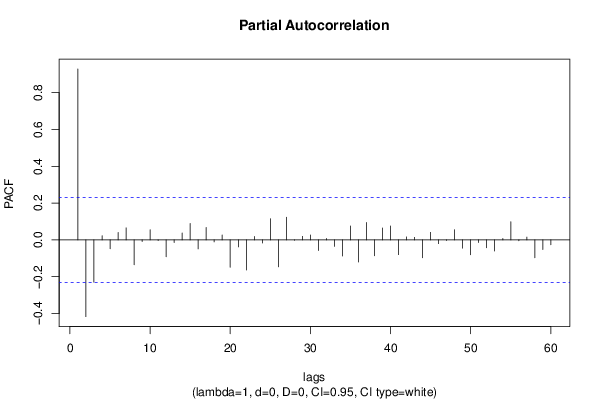
Partial Autocorrelation Function
Time lag kPACF(k)T-STATP-value
10.9292317.88480
2-0.417363-3.54140.000351
3-0.229931-1.9510.027473
40.0228430.19380.423427
5-0.048025-0.40750.342422
60.039810.33780.368249
70.0651740.5530.290981
8-0.135259-1.14770.127444
9-0.009262-0.07860.468787
100.0553570.46970.319986
11-0.003362-0.02850.48866
12-0.091892-0.77970.219054
13-0.013962-0.11850.453013
140.0373760.31710.376026
150.0893790.75840.225342
16-0.049075-0.41640.339171
170.0676310.57390.283924
18-0.01089-0.09240.463315
190.0268680.2280.410153
20-0.148579-1.26070.105737
21-0.038034-0.32270.373917
22-0.16422-1.39340.083885
230.0182670.1550.438628
24-0.016899-0.14340.443189
250.1147290.97350.166781
26-0.14664-1.24430.108716
270.1229931.04360.150075
28-0.002354-0.020.49206
290.0190190.16140.436122
300.0266620.22620.410831
31-0.057945-0.49170.31222
320.0079190.06720.473306
33-0.035472-0.3010.382144
34-0.087855-0.74550.229205
350.0758310.64340.260989
36-0.119965-1.01790.156058
370.0942010.79930.213367
38-0.086356-0.73280.233043
390.0645190.54750.292878
400.0755960.64150.261632
41-0.080396-0.68220.248656
420.0161910.13740.445554
430.0138570.11760.453364
44-0.097669-0.82880.204992
450.0407260.34560.365337
46-0.020419-0.17330.431465
47-0.003884-0.0330.486898
480.0548820.46570.321423
49-0.044726-0.37950.352711
50-0.080872-0.68620.247389
51-0.014539-0.12340.451081
52-0.042982-0.36470.358195
53-0.060924-0.5170.303384
540.007980.06770.4731
550.09830.83410.203491
56-0.0046-0.0390.484487
570.0149130.12650.449828
58-0.096754-0.8210.207183
59-0.052071-0.44180.329967
60-0.026272-0.22290.412114

\begin{tabular}{lllllllll}
\hline
Partial Autocorrelation Function \tabularnewline
Time lag k & PACF(k) & T-STAT & P-value \tabularnewline
1 & 0.929231 & 7.8848 & 0 \tabularnewline
2 & -0.417363 & -3.5414 & 0.000351 \tabularnewline
3 & -0.229931 & -1.951 & 0.027473 \tabularnewline
4 & 0.022843 & 0.1938 & 0.423427 \tabularnewline
5 & -0.048025 & -0.4075 & 0.342422 \tabularnewline
6 & 0.03981 & 0.3378 & 0.368249 \tabularnewline
7 & 0.065174 & 0.553 & 0.290981 \tabularnewline
8 & -0.135259 & -1.1477 & 0.127444 \tabularnewline
9 & -0.009262 & -0.0786 & 0.468787 \tabularnewline
10 & 0.055357 & 0.4697 & 0.319986 \tabularnewline
11 & -0.003362 & -0.0285 & 0.48866 \tabularnewline
12 & -0.091892 & -0.7797 & 0.219054 \tabularnewline
13 & -0.013962 & -0.1185 & 0.453013 \tabularnewline
14 & 0.037376 & 0.3171 & 0.376026 \tabularnewline
15 & 0.089379 & 0.7584 & 0.225342 \tabularnewline
16 & -0.049075 & -0.4164 & 0.339171 \tabularnewline
17 & 0.067631 & 0.5739 & 0.283924 \tabularnewline
18 & -0.01089 & -0.0924 & 0.463315 \tabularnewline
19 & 0.026868 & 0.228 & 0.410153 \tabularnewline
20 & -0.148579 & -1.2607 & 0.105737 \tabularnewline
21 & -0.038034 & -0.3227 & 0.373917 \tabularnewline
22 & -0.16422 & -1.3934 & 0.083885 \tabularnewline
23 & 0.018267 & 0.155 & 0.438628 \tabularnewline
24 & -0.016899 & -0.1434 & 0.443189 \tabularnewline
25 & 0.114729 & 0.9735 & 0.166781 \tabularnewline
26 & -0.14664 & -1.2443 & 0.108716 \tabularnewline
27 & 0.122993 & 1.0436 & 0.150075 \tabularnewline
28 & -0.002354 & -0.02 & 0.49206 \tabularnewline
29 & 0.019019 & 0.1614 & 0.436122 \tabularnewline
30 & 0.026662 & 0.2262 & 0.410831 \tabularnewline
31 & -0.057945 & -0.4917 & 0.31222 \tabularnewline
32 & 0.007919 & 0.0672 & 0.473306 \tabularnewline
33 & -0.035472 & -0.301 & 0.382144 \tabularnewline
34 & -0.087855 & -0.7455 & 0.229205 \tabularnewline
35 & 0.075831 & 0.6434 & 0.260989 \tabularnewline
36 & -0.119965 & -1.0179 & 0.156058 \tabularnewline
37 & 0.094201 & 0.7993 & 0.213367 \tabularnewline
38 & -0.086356 & -0.7328 & 0.233043 \tabularnewline
39 & 0.064519 & 0.5475 & 0.292878 \tabularnewline
40 & 0.075596 & 0.6415 & 0.261632 \tabularnewline
41 & -0.080396 & -0.6822 & 0.248656 \tabularnewline
42 & 0.016191 & 0.1374 & 0.445554 \tabularnewline
43 & 0.013857 & 0.1176 & 0.453364 \tabularnewline
44 & -0.097669 & -0.8288 & 0.204992 \tabularnewline
45 & 0.040726 & 0.3456 & 0.365337 \tabularnewline
46 & -0.020419 & -0.1733 & 0.431465 \tabularnewline
47 & -0.003884 & -0.033 & 0.486898 \tabularnewline
48 & 0.054882 & 0.4657 & 0.321423 \tabularnewline
49 & -0.044726 & -0.3795 & 0.352711 \tabularnewline
50 & -0.080872 & -0.6862 & 0.247389 \tabularnewline
51 & -0.014539 & -0.1234 & 0.451081 \tabularnewline
52 & -0.042982 & -0.3647 & 0.358195 \tabularnewline
53 & -0.060924 & -0.517 & 0.303384 \tabularnewline
54 & 0.00798 & 0.0677 & 0.4731 \tabularnewline
55 & 0.0983 & 0.8341 & 0.203491 \tabularnewline
56 & -0.0046 & -0.039 & 0.484487 \tabularnewline
57 & 0.014913 & 0.1265 & 0.449828 \tabularnewline
58 & -0.096754 & -0.821 & 0.207183 \tabularnewline
59 & -0.052071 & -0.4418 & 0.329967 \tabularnewline
60 & -0.026272 & -0.2229 & 0.412114 \tabularnewline
\hline
\end{tabular}
%Source: https://freestatistics.org/blog/index.php?pk=225497&T=2

[TABLE]
[ROW][C]Partial Autocorrelation Function[/C][/ROW]
[ROW][C]Time lag k[/C][C]PACF(k)[/C][C]T-STAT[/C][C]P-value[/C][/ROW]
[ROW][C]1[/C][C]0.929231[/C][C]7.8848[/C][C]0[/C][/ROW]
[ROW][C]2[/C][C]-0.417363[/C][C]-3.5414[/C][C]0.000351[/C][/ROW]
[ROW][C]3[/C][C]-0.229931[/C][C]-1.951[/C][C]0.027473[/C][/ROW]
[ROW][C]4[/C][C]0.022843[/C][C]0.1938[/C][C]0.423427[/C][/ROW]
[ROW][C]5[/C][C]-0.048025[/C][C]-0.4075[/C][C]0.342422[/C][/ROW]
[ROW][C]6[/C][C]0.03981[/C][C]0.3378[/C][C]0.368249[/C][/ROW]
[ROW][C]7[/C][C]0.065174[/C][C]0.553[/C][C]0.290981[/C][/ROW]
[ROW][C]8[/C][C]-0.135259[/C][C]-1.1477[/C][C]0.127444[/C][/ROW]
[ROW][C]9[/C][C]-0.009262[/C][C]-0.0786[/C][C]0.468787[/C][/ROW]
[ROW][C]10[/C][C]0.055357[/C][C]0.4697[/C][C]0.319986[/C][/ROW]
[ROW][C]11[/C][C]-0.003362[/C][C]-0.0285[/C][C]0.48866[/C][/ROW]
[ROW][C]12[/C][C]-0.091892[/C][C]-0.7797[/C][C]0.219054[/C][/ROW]
[ROW][C]13[/C][C]-0.013962[/C][C]-0.1185[/C][C]0.453013[/C][/ROW]
[ROW][C]14[/C][C]0.037376[/C][C]0.3171[/C][C]0.376026[/C][/ROW]
[ROW][C]15[/C][C]0.089379[/C][C]0.7584[/C][C]0.225342[/C][/ROW]
[ROW][C]16[/C][C]-0.049075[/C][C]-0.4164[/C][C]0.339171[/C][/ROW]
[ROW][C]17[/C][C]0.067631[/C][C]0.5739[/C][C]0.283924[/C][/ROW]
[ROW][C]18[/C][C]-0.01089[/C][C]-0.0924[/C][C]0.463315[/C][/ROW]
[ROW][C]19[/C][C]0.026868[/C][C]0.228[/C][C]0.410153[/C][/ROW]
[ROW][C]20[/C][C]-0.148579[/C][C]-1.2607[/C][C]0.105737[/C][/ROW]
[ROW][C]21[/C][C]-0.038034[/C][C]-0.3227[/C][C]0.373917[/C][/ROW]
[ROW][C]22[/C][C]-0.16422[/C][C]-1.3934[/C][C]0.083885[/C][/ROW]
[ROW][C]23[/C][C]0.018267[/C][C]0.155[/C][C]0.438628[/C][/ROW]
[ROW][C]24[/C][C]-0.016899[/C][C]-0.1434[/C][C]0.443189[/C][/ROW]
[ROW][C]25[/C][C]0.114729[/C][C]0.9735[/C][C]0.166781[/C][/ROW]
[ROW][C]26[/C][C]-0.14664[/C][C]-1.2443[/C][C]0.108716[/C][/ROW]
[ROW][C]27[/C][C]0.122993[/C][C]1.0436[/C][C]0.150075[/C][/ROW]
[ROW][C]28[/C][C]-0.002354[/C][C]-0.02[/C][C]0.49206[/C][/ROW]
[ROW][C]29[/C][C]0.019019[/C][C]0.1614[/C][C]0.436122[/C][/ROW]
[ROW][C]30[/C][C]0.026662[/C][C]0.2262[/C][C]0.410831[/C][/ROW]
[ROW][C]31[/C][C]-0.057945[/C][C]-0.4917[/C][C]0.31222[/C][/ROW]
[ROW][C]32[/C][C]0.007919[/C][C]0.0672[/C][C]0.473306[/C][/ROW]
[ROW][C]33[/C][C]-0.035472[/C][C]-0.301[/C][C]0.382144[/C][/ROW]
[ROW][C]34[/C][C]-0.087855[/C][C]-0.7455[/C][C]0.229205[/C][/ROW]
[ROW][C]35[/C][C]0.075831[/C][C]0.6434[/C][C]0.260989[/C][/ROW]
[ROW][C]36[/C][C]-0.119965[/C][C]-1.0179[/C][C]0.156058[/C][/ROW]
[ROW][C]37[/C][C]0.094201[/C][C]0.7993[/C][C]0.213367[/C][/ROW]
[ROW][C]38[/C][C]-0.086356[/C][C]-0.7328[/C][C]0.233043[/C][/ROW]
[ROW][C]39[/C][C]0.064519[/C][C]0.5475[/C][C]0.292878[/C][/ROW]
[ROW][C]40[/C][C]0.075596[/C][C]0.6415[/C][C]0.261632[/C][/ROW]
[ROW][C]41[/C][C]-0.080396[/C][C]-0.6822[/C][C]0.248656[/C][/ROW]
[ROW][C]42[/C][C]0.016191[/C][C]0.1374[/C][C]0.445554[/C][/ROW]
[ROW][C]43[/C][C]0.013857[/C][C]0.1176[/C][C]0.453364[/C][/ROW]
[ROW][C]44[/C][C]-0.097669[/C][C]-0.8288[/C][C]0.204992[/C][/ROW]
[ROW][C]45[/C][C]0.040726[/C][C]0.3456[/C][C]0.365337[/C][/ROW]
[ROW][C]46[/C][C]-0.020419[/C][C]-0.1733[/C][C]0.431465[/C][/ROW]
[ROW][C]47[/C][C]-0.003884[/C][C]-0.033[/C][C]0.486898[/C][/ROW]
[ROW][C]48[/C][C]0.054882[/C][C]0.4657[/C][C]0.321423[/C][/ROW]
[ROW][C]49[/C][C]-0.044726[/C][C]-0.3795[/C][C]0.352711[/C][/ROW]
[ROW][C]50[/C][C]-0.080872[/C][C]-0.6862[/C][C]0.247389[/C][/ROW]
[ROW][C]51[/C][C]-0.014539[/C][C]-0.1234[/C][C]0.451081[/C][/ROW]
[ROW][C]52[/C][C]-0.042982[/C][C]-0.3647[/C][C]0.358195[/C][/ROW]
[ROW][C]53[/C][C]-0.060924[/C][C]-0.517[/C][C]0.303384[/C][/ROW]
[ROW][C]54[/C][C]0.00798[/C][C]0.0677[/C][C]0.4731[/C][/ROW]
[ROW][C]55[/C][C]0.0983[/C][C]0.8341[/C][C]0.203491[/C][/ROW]
[ROW][C]56[/C][C]-0.0046[/C][C]-0.039[/C][C]0.484487[/C][/ROW]
[ROW][C]57[/C][C]0.014913[/C][C]0.1265[/C][C]0.449828[/C][/ROW]
[ROW][C]58[/C][C]-0.096754[/C][C]-0.821[/C][C]0.207183[/C][/ROW]
[ROW][C]59[/C][C]-0.052071[/C][C]-0.4418[/C][C]0.329967[/C][/ROW]
[ROW][C]60[/C][C]-0.026272[/C][C]-0.2229[/C][C]0.412114[/C][/ROW]
[/TABLE]
Source: https://freestatistics.org/blog/index.php?pk=225497&T=2

Globally Unique Identifier (entire table): ba.freestatistics.org/blog/index.php?pk=225497&T=2

As an alternative you can also use a QR Code:  

The GUIDs for individual cells are displayed in the table below:

Partial Autocorrelation Function
Time lag kPACF(k)T-STATP-value
10.9292317.88480
2-0.417363-3.54140.000351
3-0.229931-1.9510.027473
40.0228430.19380.423427
5-0.048025-0.40750.342422
60.039810.33780.368249
70.0651740.5530.290981
8-0.135259-1.14770.127444
9-0.009262-0.07860.468787
100.0553570.46970.319986
11-0.003362-0.02850.48866
12-0.091892-0.77970.219054
13-0.013962-0.11850.453013
140.0373760.31710.376026
150.0893790.75840.225342
16-0.049075-0.41640.339171
170.0676310.57390.283924
18-0.01089-0.09240.463315
190.0268680.2280.410153
20-0.148579-1.26070.105737
21-0.038034-0.32270.373917
22-0.16422-1.39340.083885
230.0182670.1550.438628
24-0.016899-0.14340.443189
250.1147290.97350.166781
26-0.14664-1.24430.108716
270.1229931.04360.150075
28-0.002354-0.020.49206
290.0190190.16140.436122
300.0266620.22620.410831
31-0.057945-0.49170.31222
320.0079190.06720.473306
33-0.035472-0.3010.382144
34-0.087855-0.74550.229205
350.0758310.64340.260989
36-0.119965-1.01790.156058
370.0942010.79930.213367
38-0.086356-0.73280.233043
390.0645190.54750.292878
400.0755960.64150.261632
41-0.080396-0.68220.248656
420.0161910.13740.445554
430.0138570.11760.453364
44-0.097669-0.82880.204992
450.0407260.34560.365337
46-0.020419-0.17330.431465
47-0.003884-0.0330.486898
480.0548820.46570.321423
49-0.044726-0.37950.352711
50-0.080872-0.68620.247389
51-0.014539-0.12340.451081
52-0.042982-0.36470.358195
53-0.060924-0.5170.303384
540.007980.06770.4731
550.09830.83410.203491
56-0.0046-0.0390.484487
570.0149130.12650.449828
58-0.096754-0.8210.207183
59-0.052071-0.44180.329967
60-0.026272-0.22290.412114


Parameters (Session):
par1 = 60 ; par2 = 1 ; par3 = 0 ; par4 = 0 ; par5 = 12 ; par6 = White Noise ; par7 = 0.95 ;
Parameters (R input):
par1 = 60 ; par2 = 1 ; par3 = 0 ; par4 = 0 ; par5 = 12 ; par6 = White Noise ; par7 = 0.95 ; par8 = ;
R code (references can be found in the software module):
par8 <- ''
par7 <- '0.95'
par6 <- 'White Noise'
par5 <- '12'
par4 <- '0'
par3 <- '0'
par2 <- '1'
par1 <- '48'
if (par1 == 'Default') {
par1 = 10*log10(length(x))
} else {
par1 <- as.numeric(par1)
}
par2 <- as.numeric(par2)
par3 <- as.numeric(par3)
par4 <- as.numeric(par4)
par5 <- as.numeric(par5)
if (par6 == 'White Noise') par6 <- 'white' else par6 <- 'ma'
par7 <- as.numeric(par7)
if (par8 != '') par8 <- as.numeric(par8)
ox <- x
if (par8 == '') {
if (par2 == 0) {
x <- log(x)
} else {
x <- (x ^ par2 - 1) / par2
}
} else {
x <- log(x,base=par8)
}
if (par3 > 0) x <- diff(x,lag=1,difference=par3)
if (par4 > 0) x <- diff(x,lag=par5,difference=par4)
bitmap(file='picts.png')
op <- par(mfrow=c(2,1))
plot(ox,type='l',main='Original Time Series',xlab='time',ylab='value')
if (par8=='') {
mytitle <- paste('Working Time Series (lambda=',par2,', d=',par3,', D=',par4,')',sep='')
mysub <- paste('(lambda=',par2,', d=',par3,', D=',par4,', CI=', par7, ', CI type=',par6,')',sep='')
} else {
mytitle <- paste('Working Time Series (base=',par8,', d=',par3,', D=',par4,')',sep='')
mysub <- paste('(base=',par8,', d=',par3,', D=',par4,', CI=', par7, ', CI type=',par6,')',sep='')
}
plot(x,type='l', main=mytitle,xlab='time',ylab='value')
par(op)
dev.off()
bitmap(file='pic1.png')
racf <- acf(x, par1, main='Autocorrelation', xlab='time lag', ylab='ACF', ci.type=par6, ci=par7, sub=mysub)
dev.off()
bitmap(file='pic2.png')
rpacf <- pacf(x,par1,main='Partial Autocorrelation',xlab='lags',ylab='PACF',sub=mysub)
dev.off()
(myacf <- c(racf$acf))
(mypacf <- c(rpacf$acf))
lengthx <- length(x)
sqrtn <- sqrt(lengthx)
load(file='createtable')
a<-table.start()
a<-table.row.start(a)
a<-table.element(a,'Autocorrelation Function',4,TRUE)
a<-table.row.end(a)
a<-table.row.start(a)
a<-table.element(a,'Time lag k',header=TRUE)
a<-table.element(a,hyperlink('basics.htm','ACF(k)','click here for more information about the Autocorrelation Function'),header=TRUE)
a<-table.element(a,'T-STAT',header=TRUE)
a<-table.element(a,'P-value',header=TRUE)
a<-table.row.end(a)
for (i in 2:(par1+1)) {
a<-table.row.start(a)
a<-table.element(a,i-1,header=TRUE)
a<-table.element(a,round(myacf[i],6))
mytstat <- myacf[i]*sqrtn
a<-table.element(a,round(mytstat,4))
a<-table.element(a,round(1-pt(abs(mytstat),lengthx),6))
a<-table.row.end(a)
}
a<-table.end(a)
table.save(a,file='mytable.tab')
a<-table.start()
a<-table.row.start(a)
a<-table.element(a,'Partial Autocorrelation Function',4,TRUE)
a<-table.row.end(a)
a<-table.row.start(a)
a<-table.element(a,'Time lag k',header=TRUE)
a<-table.element(a,hyperlink('basics.htm','PACF(k)','click here for more information about the Partial Autocorrelation Function'),header=TRUE)
a<-table.element(a,'T-STAT',header=TRUE)
a<-table.element(a,'P-value',header=TRUE)
a<-table.row.end(a)
for (i in 1:par1) {
a<-table.row.start(a)
a<-table.element(a,i,header=TRUE)
a<-table.element(a,round(mypacf[i],6))
mytstat <- mypacf[i]*sqrtn
a<-table.element(a,round(mytstat,4))
a<-table.element(a,round(1-pt(abs(mytstat),lengthx),6))
a<-table.row.end(a)
}
a<-table.end(a)
table.save(a,file='mytable1.tab')