Free Statistics

of Irreproducible Research!

Author's title

Author*Unverified author*
R Software Modulerwasp_autocorrelation.wasp
Title produced by software(Partial) Autocorrelation Function
Date of computationFri, 15 Nov 2013 08:38:19 -0500
Cite this page as followsStatistical Computations at FreeStatistics.org, Office for Research Development and Education, URL https://freestatistics.org/blog/index.php?v=date/2013/Nov/15/t13845227480534lne581fr1w5.htm/, Retrieved Tue, 30 Apr 2024 09:20:31 +0000
Statistical Computations at FreeStatistics.org, Office for Research Development and Education, URL https://freestatistics.org/blog/index.php?pk=225473, Retrieved Tue, 30 Apr 2024 09:20:31 +0000
QR Codes:

Original text written by user:
IsPrivate?No (this computation is public)
User-defined keywords
Estimated Impact86
Family? (F = Feedback message, R = changed R code, M = changed R Module, P = changed Parameters, D = changed Data)
-       [(Partial) Autocorrelation Function] [Reserve positie I...] [2013-11-15 13:38:19] [a3fde7297e5409122ee2dd3b0c427a94] [Current]
Feedback Forum

Post a new message
Dataseries X:
679
687
638
628
604
713
712
693
697
555
486
470
465
426
384
379
381
380
351
346
339
336
333
324
324
321
304
343
407
389
361
353
361
387
692
704
742
721
843
847
945
946
946
945
1082
1075
820
832
851
1090
1203
1239
1535
1527
1480
1452
1383
1381
1429
1376
1602
1597
2003
1958
1997
1986
2129
2115
2297
2250
2309
2648
2627
2711
2732
2825
2932
2910
2969
2999
2965
2846
2847
2751


Summary of computational transaction
Raw Inputview raw input (R code)
Raw Outputview raw output of R engine
Computing time2 seconds
R Server'Gertrude Mary Cox' @ cox.wessa.net

\begin{tabular}{lllllllll}
\hline
Summary of computational transaction \tabularnewline
Raw Input & view raw input (R code)  \tabularnewline
Raw Output & view raw output of R engine  \tabularnewline
Computing time & 2 seconds \tabularnewline
R Server & 'Gertrude Mary Cox' @ cox.wessa.net \tabularnewline
\hline
\end{tabular}
%Source: https://freestatistics.org/blog/index.php?pk=225473&T=0

[TABLE]
[ROW][C]Summary of computational transaction[/C][/ROW]
[ROW][C]Raw Input[/C][C]view raw input (R code) [/C][/ROW]
[ROW][C]Raw Output[/C][C]view raw output of R engine [/C][/ROW]
[ROW][C]Computing time[/C][C]2 seconds[/C][/ROW]
[ROW][C]R Server[/C][C]'Gertrude Mary Cox' @ cox.wessa.net[/C][/ROW]
[/TABLE]
Source: https://freestatistics.org/blog/index.php?pk=225473&T=0

Globally Unique Identifier (entire table): ba.freestatistics.org/blog/index.php?pk=225473&T=0

As an alternative you can also use a QR Code:  

The GUIDs for individual cells are displayed in the table below:

Summary of computational transaction
Raw Inputview raw input (R code)
Raw Outputview raw output of R engine
Computing time2 seconds
R Server'Gertrude Mary Cox' @ cox.wessa.net


Autocorrelation Function
Time lag kACF(k)T-STATP-value
10.9727458.91540
20.9427058.640
30.9089078.33030
40.8717357.98960
50.832067.6260
60.7928597.26670
70.7544256.91440
80.7154926.55760
90.6768536.20350
100.6367475.83590
110.5939325.44350
120.5500025.04091e-06
130.5062994.64036e-06
140.467914.28852.4e-05
150.4296553.93788.5e-05
160.3899263.57370.000293
170.3533073.23810.000862
180.3159782.8960.002408
190.2796012.56260.006086
200.2421312.21920.014586
210.206181.88970.031125
220.1692791.55150.062275
230.1402511.28540.101088
240.1109851.01720.155992
250.084940.77850.219234
260.0598940.54890.292253
270.0335170.30720.379728
280.0064730.05930.476417
29-0.023997-0.21990.413229
30-0.054756-0.50180.308544
31-0.086859-0.79610.214115
32-0.118509-1.08620.140258
33-0.143273-1.31310.09636
34-0.167675-1.53680.064055
35-0.187487-1.71840.044708
36-0.202337-1.85440.033592
37-0.216681-1.98590.025152
38-0.23316-2.13690.017755
39-0.254664-2.3340.010991
40-0.276352-2.53280.006587
41-0.293564-2.69060.004302
42-0.310246-2.84350.002801
43-0.326789-2.99510.001802
44-0.342693-3.14080.001163
45-0.356015-3.26290.000798
46-0.369215-3.38390.000544
47-0.381489-3.49640.000378
48-0.39385-3.60970.00026

\begin{tabular}{lllllllll}
\hline
Autocorrelation Function \tabularnewline
Time lag k & ACF(k) & T-STAT & P-value \tabularnewline
1 & 0.972745 & 8.9154 & 0 \tabularnewline
2 & 0.942705 & 8.64 & 0 \tabularnewline
3 & 0.908907 & 8.3303 & 0 \tabularnewline
4 & 0.871735 & 7.9896 & 0 \tabularnewline
5 & 0.83206 & 7.626 & 0 \tabularnewline
6 & 0.792859 & 7.2667 & 0 \tabularnewline
7 & 0.754425 & 6.9144 & 0 \tabularnewline
8 & 0.715492 & 6.5576 & 0 \tabularnewline
9 & 0.676853 & 6.2035 & 0 \tabularnewline
10 & 0.636747 & 5.8359 & 0 \tabularnewline
11 & 0.593932 & 5.4435 & 0 \tabularnewline
12 & 0.550002 & 5.0409 & 1e-06 \tabularnewline
13 & 0.506299 & 4.6403 & 6e-06 \tabularnewline
14 & 0.46791 & 4.2885 & 2.4e-05 \tabularnewline
15 & 0.429655 & 3.9378 & 8.5e-05 \tabularnewline
16 & 0.389926 & 3.5737 & 0.000293 \tabularnewline
17 & 0.353307 & 3.2381 & 0.000862 \tabularnewline
18 & 0.315978 & 2.896 & 0.002408 \tabularnewline
19 & 0.279601 & 2.5626 & 0.006086 \tabularnewline
20 & 0.242131 & 2.2192 & 0.014586 \tabularnewline
21 & 0.20618 & 1.8897 & 0.031125 \tabularnewline
22 & 0.169279 & 1.5515 & 0.062275 \tabularnewline
23 & 0.140251 & 1.2854 & 0.101088 \tabularnewline
24 & 0.110985 & 1.0172 & 0.155992 \tabularnewline
25 & 0.08494 & 0.7785 & 0.219234 \tabularnewline
26 & 0.059894 & 0.5489 & 0.292253 \tabularnewline
27 & 0.033517 & 0.3072 & 0.379728 \tabularnewline
28 & 0.006473 & 0.0593 & 0.476417 \tabularnewline
29 & -0.023997 & -0.2199 & 0.413229 \tabularnewline
30 & -0.054756 & -0.5018 & 0.308544 \tabularnewline
31 & -0.086859 & -0.7961 & 0.214115 \tabularnewline
32 & -0.118509 & -1.0862 & 0.140258 \tabularnewline
33 & -0.143273 & -1.3131 & 0.09636 \tabularnewline
34 & -0.167675 & -1.5368 & 0.064055 \tabularnewline
35 & -0.187487 & -1.7184 & 0.044708 \tabularnewline
36 & -0.202337 & -1.8544 & 0.033592 \tabularnewline
37 & -0.216681 & -1.9859 & 0.025152 \tabularnewline
38 & -0.23316 & -2.1369 & 0.017755 \tabularnewline
39 & -0.254664 & -2.334 & 0.010991 \tabularnewline
40 & -0.276352 & -2.5328 & 0.006587 \tabularnewline
41 & -0.293564 & -2.6906 & 0.004302 \tabularnewline
42 & -0.310246 & -2.8435 & 0.002801 \tabularnewline
43 & -0.326789 & -2.9951 & 0.001802 \tabularnewline
44 & -0.342693 & -3.1408 & 0.001163 \tabularnewline
45 & -0.356015 & -3.2629 & 0.000798 \tabularnewline
46 & -0.369215 & -3.3839 & 0.000544 \tabularnewline
47 & -0.381489 & -3.4964 & 0.000378 \tabularnewline
48 & -0.39385 & -3.6097 & 0.00026 \tabularnewline
\hline
\end{tabular}
%Source: https://freestatistics.org/blog/index.php?pk=225473&T=1

[TABLE]
[ROW][C]Autocorrelation Function[/C][/ROW]
[ROW][C]Time lag k[/C][C]ACF(k)[/C][C]T-STAT[/C][C]P-value[/C][/ROW]
[ROW][C]1[/C][C]0.972745[/C][C]8.9154[/C][C]0[/C][/ROW]
[ROW][C]2[/C][C]0.942705[/C][C]8.64[/C][C]0[/C][/ROW]
[ROW][C]3[/C][C]0.908907[/C][C]8.3303[/C][C]0[/C][/ROW]
[ROW][C]4[/C][C]0.871735[/C][C]7.9896[/C][C]0[/C][/ROW]
[ROW][C]5[/C][C]0.83206[/C][C]7.626[/C][C]0[/C][/ROW]
[ROW][C]6[/C][C]0.792859[/C][C]7.2667[/C][C]0[/C][/ROW]
[ROW][C]7[/C][C]0.754425[/C][C]6.9144[/C][C]0[/C][/ROW]
[ROW][C]8[/C][C]0.715492[/C][C]6.5576[/C][C]0[/C][/ROW]
[ROW][C]9[/C][C]0.676853[/C][C]6.2035[/C][C]0[/C][/ROW]
[ROW][C]10[/C][C]0.636747[/C][C]5.8359[/C][C]0[/C][/ROW]
[ROW][C]11[/C][C]0.593932[/C][C]5.4435[/C][C]0[/C][/ROW]
[ROW][C]12[/C][C]0.550002[/C][C]5.0409[/C][C]1e-06[/C][/ROW]
[ROW][C]13[/C][C]0.506299[/C][C]4.6403[/C][C]6e-06[/C][/ROW]
[ROW][C]14[/C][C]0.46791[/C][C]4.2885[/C][C]2.4e-05[/C][/ROW]
[ROW][C]15[/C][C]0.429655[/C][C]3.9378[/C][C]8.5e-05[/C][/ROW]
[ROW][C]16[/C][C]0.389926[/C][C]3.5737[/C][C]0.000293[/C][/ROW]
[ROW][C]17[/C][C]0.353307[/C][C]3.2381[/C][C]0.000862[/C][/ROW]
[ROW][C]18[/C][C]0.315978[/C][C]2.896[/C][C]0.002408[/C][/ROW]
[ROW][C]19[/C][C]0.279601[/C][C]2.5626[/C][C]0.006086[/C][/ROW]
[ROW][C]20[/C][C]0.242131[/C][C]2.2192[/C][C]0.014586[/C][/ROW]
[ROW][C]21[/C][C]0.20618[/C][C]1.8897[/C][C]0.031125[/C][/ROW]
[ROW][C]22[/C][C]0.169279[/C][C]1.5515[/C][C]0.062275[/C][/ROW]
[ROW][C]23[/C][C]0.140251[/C][C]1.2854[/C][C]0.101088[/C][/ROW]
[ROW][C]24[/C][C]0.110985[/C][C]1.0172[/C][C]0.155992[/C][/ROW]
[ROW][C]25[/C][C]0.08494[/C][C]0.7785[/C][C]0.219234[/C][/ROW]
[ROW][C]26[/C][C]0.059894[/C][C]0.5489[/C][C]0.292253[/C][/ROW]
[ROW][C]27[/C][C]0.033517[/C][C]0.3072[/C][C]0.379728[/C][/ROW]
[ROW][C]28[/C][C]0.006473[/C][C]0.0593[/C][C]0.476417[/C][/ROW]
[ROW][C]29[/C][C]-0.023997[/C][C]-0.2199[/C][C]0.413229[/C][/ROW]
[ROW][C]30[/C][C]-0.054756[/C][C]-0.5018[/C][C]0.308544[/C][/ROW]
[ROW][C]31[/C][C]-0.086859[/C][C]-0.7961[/C][C]0.214115[/C][/ROW]
[ROW][C]32[/C][C]-0.118509[/C][C]-1.0862[/C][C]0.140258[/C][/ROW]
[ROW][C]33[/C][C]-0.143273[/C][C]-1.3131[/C][C]0.09636[/C][/ROW]
[ROW][C]34[/C][C]-0.167675[/C][C]-1.5368[/C][C]0.064055[/C][/ROW]
[ROW][C]35[/C][C]-0.187487[/C][C]-1.7184[/C][C]0.044708[/C][/ROW]
[ROW][C]36[/C][C]-0.202337[/C][C]-1.8544[/C][C]0.033592[/C][/ROW]
[ROW][C]37[/C][C]-0.216681[/C][C]-1.9859[/C][C]0.025152[/C][/ROW]
[ROW][C]38[/C][C]-0.23316[/C][C]-2.1369[/C][C]0.017755[/C][/ROW]
[ROW][C]39[/C][C]-0.254664[/C][C]-2.334[/C][C]0.010991[/C][/ROW]
[ROW][C]40[/C][C]-0.276352[/C][C]-2.5328[/C][C]0.006587[/C][/ROW]
[ROW][C]41[/C][C]-0.293564[/C][C]-2.6906[/C][C]0.004302[/C][/ROW]
[ROW][C]42[/C][C]-0.310246[/C][C]-2.8435[/C][C]0.002801[/C][/ROW]
[ROW][C]43[/C][C]-0.326789[/C][C]-2.9951[/C][C]0.001802[/C][/ROW]
[ROW][C]44[/C][C]-0.342693[/C][C]-3.1408[/C][C]0.001163[/C][/ROW]
[ROW][C]45[/C][C]-0.356015[/C][C]-3.2629[/C][C]0.000798[/C][/ROW]
[ROW][C]46[/C][C]-0.369215[/C][C]-3.3839[/C][C]0.000544[/C][/ROW]
[ROW][C]47[/C][C]-0.381489[/C][C]-3.4964[/C][C]0.000378[/C][/ROW]
[ROW][C]48[/C][C]-0.39385[/C][C]-3.6097[/C][C]0.00026[/C][/ROW]
[/TABLE]
Source: https://freestatistics.org/blog/index.php?pk=225473&T=1

Globally Unique Identifier (entire table): ba.freestatistics.org/blog/index.php?pk=225473&T=1

As an alternative you can also use a QR Code:  

The GUIDs for individual cells are displayed in the table below:

Autocorrelation Function
Time lag kACF(k)T-STATP-value
10.9727458.91540
20.9427058.640
30.9089078.33030
40.8717357.98960
50.832067.6260
60.7928597.26670
70.7544256.91440
80.7154926.55760
90.6768536.20350
100.6367475.83590
110.5939325.44350
120.5500025.04091e-06
130.5062994.64036e-06
140.467914.28852.4e-05
150.4296553.93788.5e-05
160.3899263.57370.000293
170.3533073.23810.000862
180.3159782.8960.002408
190.2796012.56260.006086
200.2421312.21920.014586
210.206181.88970.031125
220.1692791.55150.062275
230.1402511.28540.101088
240.1109851.01720.155992
250.084940.77850.219234
260.0598940.54890.292253
270.0335170.30720.379728
280.0064730.05930.476417
29-0.023997-0.21990.413229
30-0.054756-0.50180.308544
31-0.086859-0.79610.214115
32-0.118509-1.08620.140258
33-0.143273-1.31310.09636
34-0.167675-1.53680.064055
35-0.187487-1.71840.044708
36-0.202337-1.85440.033592
37-0.216681-1.98590.025152
38-0.23316-2.13690.017755
39-0.254664-2.3340.010991
40-0.276352-2.53280.006587
41-0.293564-2.69060.004302
42-0.310246-2.84350.002801
43-0.326789-2.99510.001802
44-0.342693-3.14080.001163
45-0.356015-3.26290.000798
46-0.369215-3.38390.000544
47-0.381489-3.49640.000378
48-0.39385-3.60970.00026


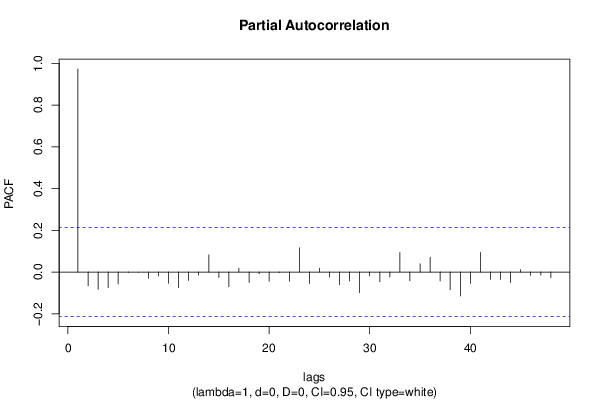
Partial Autocorrelation Function
Time lag kPACF(k)T-STATP-value
10.9727458.91540
2-0.065633-0.60150.27455
3-0.083067-0.76130.224299
4-0.074685-0.68450.247772
5-0.057684-0.52870.299209
6-0.00198-0.01810.492783
7-7e-06-1e-040.499976
8-0.029822-0.27330.392639
9-0.018674-0.17120.432257
10-0.053616-0.49140.312213
11-0.075122-0.68850.246517
12-0.040948-0.37530.354194
13-0.014432-0.13230.447544
140.0819710.75130.227293
15-0.025981-0.23810.406184
16-0.070436-0.64560.260164
170.0181630.16650.434095
18-0.050023-0.45850.323901
19-0.007664-0.07020.472083
20-0.044706-0.40970.34152
21-0.00208-0.01910.492418
22-0.044683-0.40950.341597
230.1158551.06180.145679
24-0.055102-0.5050.307433
250.0183190.16790.433535
26-0.023836-0.21850.413802
27-0.061099-0.560.28849
28-0.043174-0.39570.346665
29-0.098688-0.90450.184161
30-0.018197-0.16680.433972
31-0.046728-0.42830.334775
32-0.023908-0.21910.413543
330.0930490.85280.198097
34-0.041972-0.38470.350724
350.039040.35780.360692
360.0709610.65040.258614
37-0.043123-0.39520.346839
38-0.084377-0.77330.220748
39-0.11524-1.05620.146954
40-0.054384-0.49840.309738
410.0934090.85610.197187
42-0.035738-0.32750.372035
43-0.035724-0.32740.372084
44-0.049953-0.45780.324129
450.0113430.1040.458725
46-0.01668-0.15290.439433
47-0.014323-0.13130.447938
48-0.027432-0.25140.401051

\begin{tabular}{lllllllll}
\hline
Partial Autocorrelation Function \tabularnewline
Time lag k & PACF(k) & T-STAT & P-value \tabularnewline
1 & 0.972745 & 8.9154 & 0 \tabularnewline
2 & -0.065633 & -0.6015 & 0.27455 \tabularnewline
3 & -0.083067 & -0.7613 & 0.224299 \tabularnewline
4 & -0.074685 & -0.6845 & 0.247772 \tabularnewline
5 & -0.057684 & -0.5287 & 0.299209 \tabularnewline
6 & -0.00198 & -0.0181 & 0.492783 \tabularnewline
7 & -7e-06 & -1e-04 & 0.499976 \tabularnewline
8 & -0.029822 & -0.2733 & 0.392639 \tabularnewline
9 & -0.018674 & -0.1712 & 0.432257 \tabularnewline
10 & -0.053616 & -0.4914 & 0.312213 \tabularnewline
11 & -0.075122 & -0.6885 & 0.246517 \tabularnewline
12 & -0.040948 & -0.3753 & 0.354194 \tabularnewline
13 & -0.014432 & -0.1323 & 0.447544 \tabularnewline
14 & 0.081971 & 0.7513 & 0.227293 \tabularnewline
15 & -0.025981 & -0.2381 & 0.406184 \tabularnewline
16 & -0.070436 & -0.6456 & 0.260164 \tabularnewline
17 & 0.018163 & 0.1665 & 0.434095 \tabularnewline
18 & -0.050023 & -0.4585 & 0.323901 \tabularnewline
19 & -0.007664 & -0.0702 & 0.472083 \tabularnewline
20 & -0.044706 & -0.4097 & 0.34152 \tabularnewline
21 & -0.00208 & -0.0191 & 0.492418 \tabularnewline
22 & -0.044683 & -0.4095 & 0.341597 \tabularnewline
23 & 0.115855 & 1.0618 & 0.145679 \tabularnewline
24 & -0.055102 & -0.505 & 0.307433 \tabularnewline
25 & 0.018319 & 0.1679 & 0.433535 \tabularnewline
26 & -0.023836 & -0.2185 & 0.413802 \tabularnewline
27 & -0.061099 & -0.56 & 0.28849 \tabularnewline
28 & -0.043174 & -0.3957 & 0.346665 \tabularnewline
29 & -0.098688 & -0.9045 & 0.184161 \tabularnewline
30 & -0.018197 & -0.1668 & 0.433972 \tabularnewline
31 & -0.046728 & -0.4283 & 0.334775 \tabularnewline
32 & -0.023908 & -0.2191 & 0.413543 \tabularnewline
33 & 0.093049 & 0.8528 & 0.198097 \tabularnewline
34 & -0.041972 & -0.3847 & 0.350724 \tabularnewline
35 & 0.03904 & 0.3578 & 0.360692 \tabularnewline
36 & 0.070961 & 0.6504 & 0.258614 \tabularnewline
37 & -0.043123 & -0.3952 & 0.346839 \tabularnewline
38 & -0.084377 & -0.7733 & 0.220748 \tabularnewline
39 & -0.11524 & -1.0562 & 0.146954 \tabularnewline
40 & -0.054384 & -0.4984 & 0.309738 \tabularnewline
41 & 0.093409 & 0.8561 & 0.197187 \tabularnewline
42 & -0.035738 & -0.3275 & 0.372035 \tabularnewline
43 & -0.035724 & -0.3274 & 0.372084 \tabularnewline
44 & -0.049953 & -0.4578 & 0.324129 \tabularnewline
45 & 0.011343 & 0.104 & 0.458725 \tabularnewline
46 & -0.01668 & -0.1529 & 0.439433 \tabularnewline
47 & -0.014323 & -0.1313 & 0.447938 \tabularnewline
48 & -0.027432 & -0.2514 & 0.401051 \tabularnewline
\hline
\end{tabular}
%Source: https://freestatistics.org/blog/index.php?pk=225473&T=2

[TABLE]
[ROW][C]Partial Autocorrelation Function[/C][/ROW]
[ROW][C]Time lag k[/C][C]PACF(k)[/C][C]T-STAT[/C][C]P-value[/C][/ROW]
[ROW][C]1[/C][C]0.972745[/C][C]8.9154[/C][C]0[/C][/ROW]
[ROW][C]2[/C][C]-0.065633[/C][C]-0.6015[/C][C]0.27455[/C][/ROW]
[ROW][C]3[/C][C]-0.083067[/C][C]-0.7613[/C][C]0.224299[/C][/ROW]
[ROW][C]4[/C][C]-0.074685[/C][C]-0.6845[/C][C]0.247772[/C][/ROW]
[ROW][C]5[/C][C]-0.057684[/C][C]-0.5287[/C][C]0.299209[/C][/ROW]
[ROW][C]6[/C][C]-0.00198[/C][C]-0.0181[/C][C]0.492783[/C][/ROW]
[ROW][C]7[/C][C]-7e-06[/C][C]-1e-04[/C][C]0.499976[/C][/ROW]
[ROW][C]8[/C][C]-0.029822[/C][C]-0.2733[/C][C]0.392639[/C][/ROW]
[ROW][C]9[/C][C]-0.018674[/C][C]-0.1712[/C][C]0.432257[/C][/ROW]
[ROW][C]10[/C][C]-0.053616[/C][C]-0.4914[/C][C]0.312213[/C][/ROW]
[ROW][C]11[/C][C]-0.075122[/C][C]-0.6885[/C][C]0.246517[/C][/ROW]
[ROW][C]12[/C][C]-0.040948[/C][C]-0.3753[/C][C]0.354194[/C][/ROW]
[ROW][C]13[/C][C]-0.014432[/C][C]-0.1323[/C][C]0.447544[/C][/ROW]
[ROW][C]14[/C][C]0.081971[/C][C]0.7513[/C][C]0.227293[/C][/ROW]
[ROW][C]15[/C][C]-0.025981[/C][C]-0.2381[/C][C]0.406184[/C][/ROW]
[ROW][C]16[/C][C]-0.070436[/C][C]-0.6456[/C][C]0.260164[/C][/ROW]
[ROW][C]17[/C][C]0.018163[/C][C]0.1665[/C][C]0.434095[/C][/ROW]
[ROW][C]18[/C][C]-0.050023[/C][C]-0.4585[/C][C]0.323901[/C][/ROW]
[ROW][C]19[/C][C]-0.007664[/C][C]-0.0702[/C][C]0.472083[/C][/ROW]
[ROW][C]20[/C][C]-0.044706[/C][C]-0.4097[/C][C]0.34152[/C][/ROW]
[ROW][C]21[/C][C]-0.00208[/C][C]-0.0191[/C][C]0.492418[/C][/ROW]
[ROW][C]22[/C][C]-0.044683[/C][C]-0.4095[/C][C]0.341597[/C][/ROW]
[ROW][C]23[/C][C]0.115855[/C][C]1.0618[/C][C]0.145679[/C][/ROW]
[ROW][C]24[/C][C]-0.055102[/C][C]-0.505[/C][C]0.307433[/C][/ROW]
[ROW][C]25[/C][C]0.018319[/C][C]0.1679[/C][C]0.433535[/C][/ROW]
[ROW][C]26[/C][C]-0.023836[/C][C]-0.2185[/C][C]0.413802[/C][/ROW]
[ROW][C]27[/C][C]-0.061099[/C][C]-0.56[/C][C]0.28849[/C][/ROW]
[ROW][C]28[/C][C]-0.043174[/C][C]-0.3957[/C][C]0.346665[/C][/ROW]
[ROW][C]29[/C][C]-0.098688[/C][C]-0.9045[/C][C]0.184161[/C][/ROW]
[ROW][C]30[/C][C]-0.018197[/C][C]-0.1668[/C][C]0.433972[/C][/ROW]
[ROW][C]31[/C][C]-0.046728[/C][C]-0.4283[/C][C]0.334775[/C][/ROW]
[ROW][C]32[/C][C]-0.023908[/C][C]-0.2191[/C][C]0.413543[/C][/ROW]
[ROW][C]33[/C][C]0.093049[/C][C]0.8528[/C][C]0.198097[/C][/ROW]
[ROW][C]34[/C][C]-0.041972[/C][C]-0.3847[/C][C]0.350724[/C][/ROW]
[ROW][C]35[/C][C]0.03904[/C][C]0.3578[/C][C]0.360692[/C][/ROW]
[ROW][C]36[/C][C]0.070961[/C][C]0.6504[/C][C]0.258614[/C][/ROW]
[ROW][C]37[/C][C]-0.043123[/C][C]-0.3952[/C][C]0.346839[/C][/ROW]
[ROW][C]38[/C][C]-0.084377[/C][C]-0.7733[/C][C]0.220748[/C][/ROW]
[ROW][C]39[/C][C]-0.11524[/C][C]-1.0562[/C][C]0.146954[/C][/ROW]
[ROW][C]40[/C][C]-0.054384[/C][C]-0.4984[/C][C]0.309738[/C][/ROW]
[ROW][C]41[/C][C]0.093409[/C][C]0.8561[/C][C]0.197187[/C][/ROW]
[ROW][C]42[/C][C]-0.035738[/C][C]-0.3275[/C][C]0.372035[/C][/ROW]
[ROW][C]43[/C][C]-0.035724[/C][C]-0.3274[/C][C]0.372084[/C][/ROW]
[ROW][C]44[/C][C]-0.049953[/C][C]-0.4578[/C][C]0.324129[/C][/ROW]
[ROW][C]45[/C][C]0.011343[/C][C]0.104[/C][C]0.458725[/C][/ROW]
[ROW][C]46[/C][C]-0.01668[/C][C]-0.1529[/C][C]0.439433[/C][/ROW]
[ROW][C]47[/C][C]-0.014323[/C][C]-0.1313[/C][C]0.447938[/C][/ROW]
[ROW][C]48[/C][C]-0.027432[/C][C]-0.2514[/C][C]0.401051[/C][/ROW]
[/TABLE]
Source: https://freestatistics.org/blog/index.php?pk=225473&T=2

Globally Unique Identifier (entire table): ba.freestatistics.org/blog/index.php?pk=225473&T=2

As an alternative you can also use a QR Code:  

The GUIDs for individual cells are displayed in the table below:

Partial Autocorrelation Function
Time lag kPACF(k)T-STATP-value
10.9727458.91540
2-0.065633-0.60150.27455
3-0.083067-0.76130.224299
4-0.074685-0.68450.247772
5-0.057684-0.52870.299209
6-0.00198-0.01810.492783
7-7e-06-1e-040.499976
8-0.029822-0.27330.392639
9-0.018674-0.17120.432257
10-0.053616-0.49140.312213
11-0.075122-0.68850.246517
12-0.040948-0.37530.354194
13-0.014432-0.13230.447544
140.0819710.75130.227293
15-0.025981-0.23810.406184
16-0.070436-0.64560.260164
170.0181630.16650.434095
18-0.050023-0.45850.323901
19-0.007664-0.07020.472083
20-0.044706-0.40970.34152
21-0.00208-0.01910.492418
22-0.044683-0.40950.341597
230.1158551.06180.145679
24-0.055102-0.5050.307433
250.0183190.16790.433535
26-0.023836-0.21850.413802
27-0.061099-0.560.28849
28-0.043174-0.39570.346665
29-0.098688-0.90450.184161
30-0.018197-0.16680.433972
31-0.046728-0.42830.334775
32-0.023908-0.21910.413543
330.0930490.85280.198097
34-0.041972-0.38470.350724
350.039040.35780.360692
360.0709610.65040.258614
37-0.043123-0.39520.346839
38-0.084377-0.77330.220748
39-0.11524-1.05620.146954
40-0.054384-0.49840.309738
410.0934090.85610.197187
42-0.035738-0.32750.372035
43-0.035724-0.32740.372084
44-0.049953-0.45780.324129
450.0113430.1040.458725
46-0.01668-0.15290.439433
47-0.014323-0.13130.447938
48-0.027432-0.25140.401051


Parameters (Session):
par1 = 48 ; par2 = 1 ; par3 = 0 ; par4 = 0 ; par5 = 12 ; par6 = White Noise ; par7 = 0.95 ;
Parameters (R input):
par1 = 48 ; par2 = 1 ; par3 = 0 ; par4 = 0 ; par5 = 12 ; par6 = White Noise ; par7 = 0.95 ; par8 = ;
R code (references can be found in the software module):
par8 <- ''
par7 <- '0.95'
par6 <- 'White Noise'
par5 <- '12'
par4 <- '0'
par3 <- '0'
par2 <- '1'
par1 <- '48'
if (par1 == 'Default') {
par1 = 10*log10(length(x))
} else {
par1 <- as.numeric(par1)
}
par2 <- as.numeric(par2)
par3 <- as.numeric(par3)
par4 <- as.numeric(par4)
par5 <- as.numeric(par5)
if (par6 == 'White Noise') par6 <- 'white' else par6 <- 'ma'
par7 <- as.numeric(par7)
if (par8 != '') par8 <- as.numeric(par8)
ox <- x
if (par8 == '') {
if (par2 == 0) {
x <- log(x)
} else {
x <- (x ^ par2 - 1) / par2
}
} else {
x <- log(x,base=par8)
}
if (par3 > 0) x <- diff(x,lag=1,difference=par3)
if (par4 > 0) x <- diff(x,lag=par5,difference=par4)
bitmap(file='picts.png')
op <- par(mfrow=c(2,1))
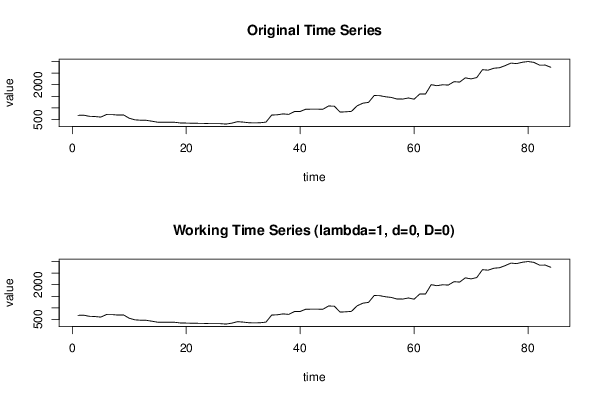
plot(ox,type='l',main='Original Time Series',xlab='time',ylab='value')
if (par8=='') {
mytitle <- paste('Working Time Series (lambda=',par2,', d=',par3,', D=',par4,')',sep='')
mysub <- paste('(lambda=',par2,', d=',par3,', D=',par4,', CI=', par7, ', CI type=',par6,')',sep='')
} else {
mytitle <- paste('Working Time Series (base=',par8,', d=',par3,', D=',par4,')',sep='')
mysub <- paste('(base=',par8,', d=',par3,', D=',par4,', CI=', par7, ', CI type=',par6,')',sep='')
}
plot(x,type='l', main=mytitle,xlab='time',ylab='value')
par(op)
dev.off()
bitmap(file='pic1.png')
racf <- acf(x, par1, main='Autocorrelation', xlab='time lag', ylab='ACF', ci.type=par6, ci=par7, sub=mysub)
dev.off()
bitmap(file='pic2.png')
rpacf <- pacf(x,par1,main='Partial Autocorrelation',xlab='lags',ylab='PACF',sub=mysub)
dev.off()
(myacf <- c(racf$acf))
(mypacf <- c(rpacf$acf))
lengthx <- length(x)
sqrtn <- sqrt(lengthx)
load(file='createtable')
a<-table.start()
a<-table.row.start(a)
a<-table.element(a,'Autocorrelation Function',4,TRUE)
a<-table.row.end(a)
a<-table.row.start(a)
a<-table.element(a,'Time lag k',header=TRUE)
a<-table.element(a,hyperlink('basics.htm','ACF(k)','click here for more information about the Autocorrelation Function'),header=TRUE)
a<-table.element(a,'T-STAT',header=TRUE)
a<-table.element(a,'P-value',header=TRUE)
a<-table.row.end(a)
for (i in 2:(par1+1)) {
a<-table.row.start(a)
a<-table.element(a,i-1,header=TRUE)
a<-table.element(a,round(myacf[i],6))
mytstat <- myacf[i]*sqrtn
a<-table.element(a,round(mytstat,4))
a<-table.element(a,round(1-pt(abs(mytstat),lengthx),6))
a<-table.row.end(a)
}
a<-table.end(a)
table.save(a,file='mytable.tab')
a<-table.start()
a<-table.row.start(a)
a<-table.element(a,'Partial Autocorrelation Function',4,TRUE)
a<-table.row.end(a)
a<-table.row.start(a)
a<-table.element(a,'Time lag k',header=TRUE)
a<-table.element(a,hyperlink('basics.htm','PACF(k)','click here for more information about the Partial Autocorrelation Function'),header=TRUE)
a<-table.element(a,'T-STAT',header=TRUE)
a<-table.element(a,'P-value',header=TRUE)
a<-table.row.end(a)
for (i in 1:par1) {
a<-table.row.start(a)
a<-table.element(a,i,header=TRUE)
a<-table.element(a,round(mypacf[i],6))
mytstat <- mypacf[i]*sqrtn
a<-table.element(a,round(mytstat,4))
a<-table.element(a,round(1-pt(abs(mytstat),lengthx),6))
a<-table.row.end(a)
}
a<-table.end(a)
table.save(a,file='mytable1.tab')