Free Statistics

of Irreproducible Research!

Author's title

Author*The author of this computation has been verified*
R Software Modulerwasp_autocorrelation.wasp
Title produced by software(Partial) Autocorrelation Function
Date of computationFri, 15 Nov 2013 07:03:54 -0500
Cite this page as followsStatistical Computations at FreeStatistics.org, Office for Research Development and Education, URL https://freestatistics.org/blog/index.php?v=date/2013/Nov/15/t1384517046rdvqbdi9w2oidbf.htm/, Retrieved Tue, 30 Apr 2024 15:59:48 +0000
Statistical Computations at FreeStatistics.org, Office for Research Development and Education, URL https://freestatistics.org/blog/index.php?pk=225448, Retrieved Tue, 30 Apr 2024 15:59:48 +0000
QR Codes:

Original text written by user:
IsPrivate?No (this computation is public)
User-defined keywords
Estimated Impact96
Family? (F = Feedback message, R = changed R code, M = changed R Module, P = changed Parameters, D = changed Data)
-       [(Partial) Autocorrelation Function] [Autocorrelatie] [2013-11-15 12:03:54] [a6c86ecfac1c17167d9b343b3a96f19f] [Current]
Feedback Forum

Post a new message
Dataseries X:
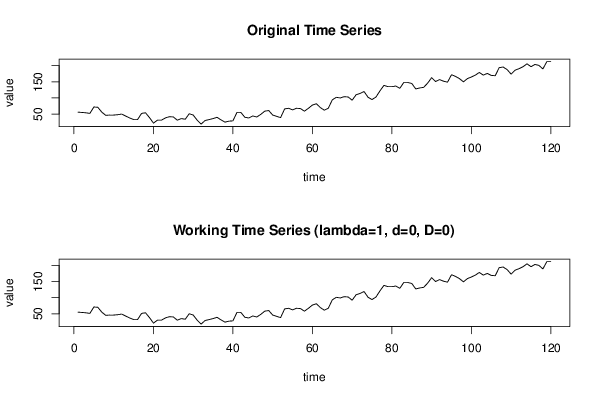
56
55
54
52
72
71
56
46
47
47
48
50
44
38
33
33
52
54
39
22
31
31
38
42
41
31
36
34
51
47
31
19
30
33
36
40
32
25
28
29
55
55
40
38
44
41
49
59
61
47
43
39
66
68
63
68
67
59
68
78
82
70
62
68
94
102
100
104
103
93
110
114
120
102
95
103
122
139
135
135
137
130
148
148
145
128
131
133
146
163
151
157
152
149
172
167
160
150
160
165
171
179
171
176
170
169
194
196
188
174
186
191
197
206
197
204
201
190
213
213


Summary of computational transaction
Raw Inputview raw input (R code)
Raw Outputview raw output of R engine
Computing time3 seconds
R Server'Gwilym Jenkins' @ jenkins.wessa.net

\begin{tabular}{lllllllll}
\hline
Summary of computational transaction \tabularnewline
Raw Input & view raw input (R code)  \tabularnewline
Raw Output & view raw output of R engine  \tabularnewline
Computing time & 3 seconds \tabularnewline
R Server & 'Gwilym Jenkins' @ jenkins.wessa.net \tabularnewline
\hline
\end{tabular}
%Source: https://freestatistics.org/blog/index.php?pk=225448&T=0

[TABLE]
[ROW][C]Summary of computational transaction[/C][/ROW]
[ROW][C]Raw Input[/C][C]view raw input (R code) [/C][/ROW]
[ROW][C]Raw Output[/C][C]view raw output of R engine [/C][/ROW]
[ROW][C]Computing time[/C][C]3 seconds[/C][/ROW]
[ROW][C]R Server[/C][C]'Gwilym Jenkins' @ jenkins.wessa.net[/C][/ROW]
[/TABLE]
Source: https://freestatistics.org/blog/index.php?pk=225448&T=0

Globally Unique Identifier (entire table): ba.freestatistics.org/blog/index.php?pk=225448&T=0

As an alternative you can also use a QR Code:  

The GUIDs for individual cells are displayed in the table below:

Summary of computational transaction
Raw Inputview raw input (R code)
Raw Outputview raw output of R engine
Computing time3 seconds
R Server'Gwilym Jenkins' @ jenkins.wessa.net


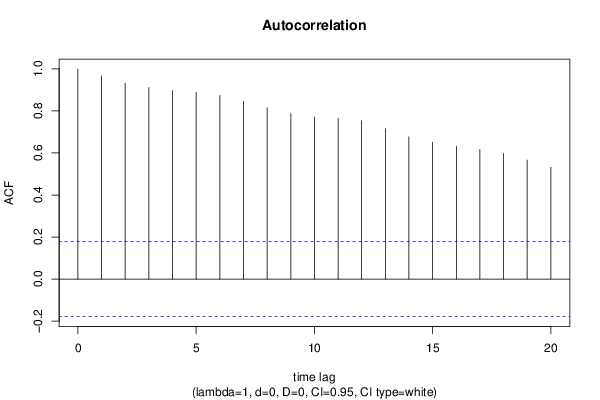
Autocorrelation Function
Time lag kACF(k)T-STATP-value
10.96642410.58660
20.93169910.20620
30.9118699.9890
40.8973479.82990
50.8876639.72390
60.8738159.57220
70.8465479.27350
80.8151418.92940
90.7876568.62830
100.7709058.44480
110.7656578.38740
120.7542338.26220
130.7158317.84150
140.6767527.41340
150.6512467.1340
160.6321696.92510
170.6162696.75090
180.5977846.54840
190.5669376.21050
200.5316145.82350

\begin{tabular}{lllllllll}
\hline
Autocorrelation Function \tabularnewline
Time lag k & ACF(k) & T-STAT & P-value \tabularnewline
1 & 0.966424 & 10.5866 & 0 \tabularnewline
2 & 0.931699 & 10.2062 & 0 \tabularnewline
3 & 0.911869 & 9.989 & 0 \tabularnewline
4 & 0.897347 & 9.8299 & 0 \tabularnewline
5 & 0.887663 & 9.7239 & 0 \tabularnewline
6 & 0.873815 & 9.5722 & 0 \tabularnewline
7 & 0.846547 & 9.2735 & 0 \tabularnewline
8 & 0.815141 & 8.9294 & 0 \tabularnewline
9 & 0.787656 & 8.6283 & 0 \tabularnewline
10 & 0.770905 & 8.4448 & 0 \tabularnewline
11 & 0.765657 & 8.3874 & 0 \tabularnewline
12 & 0.754233 & 8.2622 & 0 \tabularnewline
13 & 0.715831 & 7.8415 & 0 \tabularnewline
14 & 0.676752 & 7.4134 & 0 \tabularnewline
15 & 0.651246 & 7.134 & 0 \tabularnewline
16 & 0.632169 & 6.9251 & 0 \tabularnewline
17 & 0.616269 & 6.7509 & 0 \tabularnewline
18 & 0.597784 & 6.5484 & 0 \tabularnewline
19 & 0.566937 & 6.2105 & 0 \tabularnewline
20 & 0.531614 & 5.8235 & 0 \tabularnewline
\hline
\end{tabular}
%Source: https://freestatistics.org/blog/index.php?pk=225448&T=1

[TABLE]
[ROW][C]Autocorrelation Function[/C][/ROW]
[ROW][C]Time lag k[/C][C]ACF(k)[/C][C]T-STAT[/C][C]P-value[/C][/ROW]
[ROW][C]1[/C][C]0.966424[/C][C]10.5866[/C][C]0[/C][/ROW]
[ROW][C]2[/C][C]0.931699[/C][C]10.2062[/C][C]0[/C][/ROW]
[ROW][C]3[/C][C]0.911869[/C][C]9.989[/C][C]0[/C][/ROW]
[ROW][C]4[/C][C]0.897347[/C][C]9.8299[/C][C]0[/C][/ROW]
[ROW][C]5[/C][C]0.887663[/C][C]9.7239[/C][C]0[/C][/ROW]
[ROW][C]6[/C][C]0.873815[/C][C]9.5722[/C][C]0[/C][/ROW]
[ROW][C]7[/C][C]0.846547[/C][C]9.2735[/C][C]0[/C][/ROW]
[ROW][C]8[/C][C]0.815141[/C][C]8.9294[/C][C]0[/C][/ROW]
[ROW][C]9[/C][C]0.787656[/C][C]8.6283[/C][C]0[/C][/ROW]
[ROW][C]10[/C][C]0.770905[/C][C]8.4448[/C][C]0[/C][/ROW]
[ROW][C]11[/C][C]0.765657[/C][C]8.3874[/C][C]0[/C][/ROW]
[ROW][C]12[/C][C]0.754233[/C][C]8.2622[/C][C]0[/C][/ROW]
[ROW][C]13[/C][C]0.715831[/C][C]7.8415[/C][C]0[/C][/ROW]
[ROW][C]14[/C][C]0.676752[/C][C]7.4134[/C][C]0[/C][/ROW]
[ROW][C]15[/C][C]0.651246[/C][C]7.134[/C][C]0[/C][/ROW]
[ROW][C]16[/C][C]0.632169[/C][C]6.9251[/C][C]0[/C][/ROW]
[ROW][C]17[/C][C]0.616269[/C][C]6.7509[/C][C]0[/C][/ROW]
[ROW][C]18[/C][C]0.597784[/C][C]6.5484[/C][C]0[/C][/ROW]
[ROW][C]19[/C][C]0.566937[/C][C]6.2105[/C][C]0[/C][/ROW]
[ROW][C]20[/C][C]0.531614[/C][C]5.8235[/C][C]0[/C][/ROW]
[/TABLE]
Source: https://freestatistics.org/blog/index.php?pk=225448&T=1

Globally Unique Identifier (entire table): ba.freestatistics.org/blog/index.php?pk=225448&T=1

As an alternative you can also use a QR Code:  

The GUIDs for individual cells are displayed in the table below:

Autocorrelation Function
Time lag kACF(k)T-STATP-value
10.96642410.58660
20.93169910.20620
30.9118699.9890
40.8973479.82990
50.8876639.72390
60.8738159.57220
70.8465479.27350
80.8151418.92940
90.7876568.62830
100.7709058.44480
110.7656578.38740
120.7542338.26220
130.7158317.84150
140.6767527.41340
150.6512467.1340
160.6321696.92510
170.6162696.75090
180.5977846.54840
190.5669376.21050
200.5316145.82350


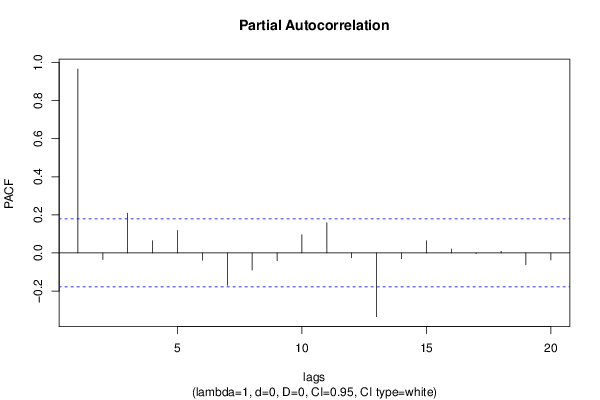
Partial Autocorrelation Function
Time lag kPACF(k)T-STATP-value
10.96642410.58660
2-0.034488-0.37780.353125
30.2081962.28070.012166
40.0635580.69620.243811
50.117481.28690.100298
6-0.038007-0.41630.33895
7-0.169558-1.85740.032851
8-0.089874-0.98450.163421
9-0.040388-0.44240.329489
100.0959531.05110.147661
110.1584931.73620.042547
12-0.025036-0.27430.392179
13-0.334767-3.66720.000183
14-0.030874-0.33820.367901
150.064360.7050.241081
160.0200460.21960.413282
17-0.002837-0.03110.487629
180.0081920.08970.464321
19-0.062086-0.68010.24887
20-0.037076-0.40610.342679

\begin{tabular}{lllllllll}
\hline
Partial Autocorrelation Function \tabularnewline
Time lag k & PACF(k) & T-STAT & P-value \tabularnewline
1 & 0.966424 & 10.5866 & 0 \tabularnewline
2 & -0.034488 & -0.3778 & 0.353125 \tabularnewline
3 & 0.208196 & 2.2807 & 0.012166 \tabularnewline
4 & 0.063558 & 0.6962 & 0.243811 \tabularnewline
5 & 0.11748 & 1.2869 & 0.100298 \tabularnewline
6 & -0.038007 & -0.4163 & 0.33895 \tabularnewline
7 & -0.169558 & -1.8574 & 0.032851 \tabularnewline
8 & -0.089874 & -0.9845 & 0.163421 \tabularnewline
9 & -0.040388 & -0.4424 & 0.329489 \tabularnewline
10 & 0.095953 & 1.0511 & 0.147661 \tabularnewline
11 & 0.158493 & 1.7362 & 0.042547 \tabularnewline
12 & -0.025036 & -0.2743 & 0.392179 \tabularnewline
13 & -0.334767 & -3.6672 & 0.000183 \tabularnewline
14 & -0.030874 & -0.3382 & 0.367901 \tabularnewline
15 & 0.06436 & 0.705 & 0.241081 \tabularnewline
16 & 0.020046 & 0.2196 & 0.413282 \tabularnewline
17 & -0.002837 & -0.0311 & 0.487629 \tabularnewline
18 & 0.008192 & 0.0897 & 0.464321 \tabularnewline
19 & -0.062086 & -0.6801 & 0.24887 \tabularnewline
20 & -0.037076 & -0.4061 & 0.342679 \tabularnewline
\hline
\end{tabular}
%Source: https://freestatistics.org/blog/index.php?pk=225448&T=2

[TABLE]
[ROW][C]Partial Autocorrelation Function[/C][/ROW]
[ROW][C]Time lag k[/C][C]PACF(k)[/C][C]T-STAT[/C][C]P-value[/C][/ROW]
[ROW][C]1[/C][C]0.966424[/C][C]10.5866[/C][C]0[/C][/ROW]
[ROW][C]2[/C][C]-0.034488[/C][C]-0.3778[/C][C]0.353125[/C][/ROW]
[ROW][C]3[/C][C]0.208196[/C][C]2.2807[/C][C]0.012166[/C][/ROW]
[ROW][C]4[/C][C]0.063558[/C][C]0.6962[/C][C]0.243811[/C][/ROW]
[ROW][C]5[/C][C]0.11748[/C][C]1.2869[/C][C]0.100298[/C][/ROW]
[ROW][C]6[/C][C]-0.038007[/C][C]-0.4163[/C][C]0.33895[/C][/ROW]
[ROW][C]7[/C][C]-0.169558[/C][C]-1.8574[/C][C]0.032851[/C][/ROW]
[ROW][C]8[/C][C]-0.089874[/C][C]-0.9845[/C][C]0.163421[/C][/ROW]
[ROW][C]9[/C][C]-0.040388[/C][C]-0.4424[/C][C]0.329489[/C][/ROW]
[ROW][C]10[/C][C]0.095953[/C][C]1.0511[/C][C]0.147661[/C][/ROW]
[ROW][C]11[/C][C]0.158493[/C][C]1.7362[/C][C]0.042547[/C][/ROW]
[ROW][C]12[/C][C]-0.025036[/C][C]-0.2743[/C][C]0.392179[/C][/ROW]
[ROW][C]13[/C][C]-0.334767[/C][C]-3.6672[/C][C]0.000183[/C][/ROW]
[ROW][C]14[/C][C]-0.030874[/C][C]-0.3382[/C][C]0.367901[/C][/ROW]
[ROW][C]15[/C][C]0.06436[/C][C]0.705[/C][C]0.241081[/C][/ROW]
[ROW][C]16[/C][C]0.020046[/C][C]0.2196[/C][C]0.413282[/C][/ROW]
[ROW][C]17[/C][C]-0.002837[/C][C]-0.0311[/C][C]0.487629[/C][/ROW]
[ROW][C]18[/C][C]0.008192[/C][C]0.0897[/C][C]0.464321[/C][/ROW]
[ROW][C]19[/C][C]-0.062086[/C][C]-0.6801[/C][C]0.24887[/C][/ROW]
[ROW][C]20[/C][C]-0.037076[/C][C]-0.4061[/C][C]0.342679[/C][/ROW]
[/TABLE]
Source: https://freestatistics.org/blog/index.php?pk=225448&T=2

Globally Unique Identifier (entire table): ba.freestatistics.org/blog/index.php?pk=225448&T=2

As an alternative you can also use a QR Code:  

The GUIDs for individual cells are displayed in the table below:

Partial Autocorrelation Function
Time lag kPACF(k)T-STATP-value
10.96642410.58660
2-0.034488-0.37780.353125
30.2081962.28070.012166
40.0635580.69620.243811
50.117481.28690.100298
6-0.038007-0.41630.33895
7-0.169558-1.85740.032851
8-0.089874-0.98450.163421
9-0.040388-0.44240.329489
100.0959531.05110.147661
110.1584931.73620.042547
12-0.025036-0.27430.392179
13-0.334767-3.66720.000183
14-0.030874-0.33820.367901
150.064360.7050.241081
160.0200460.21960.413282
17-0.002837-0.03110.487629
180.0081920.08970.464321
19-0.062086-0.68010.24887
20-0.037076-0.40610.342679


Parameters (Session):
par1 = Default ; par2 = 1 ; par3 = 0 ; par4 = 0 ; par5 = 12 ; par6 = White Noise ; par7 = 0.95 ;
Parameters (R input):
par1 = Default ; par2 = 1 ; par3 = 0 ; par4 = 0 ; par5 = 12 ; par6 = White Noise ; par7 = 0.95 ; par8 = ;
R code (references can be found in the software module):
if (par1 == 'Default') {
par1 = 10*log10(length(x))
} else {
par1 <- as.numeric(par1)
}
par2 <- as.numeric(par2)
par3 <- as.numeric(par3)
par4 <- as.numeric(par4)
par5 <- as.numeric(par5)
if (par6 == 'White Noise') par6 <- 'white' else par6 <- 'ma'
par7 <- as.numeric(par7)
if (par8 != '') par8 <- as.numeric(par8)
ox <- x
if (par8 == '') {
if (par2 == 0) {
x <- log(x)
} else {
x <- (x ^ par2 - 1) / par2
}
} else {
x <- log(x,base=par8)
}
if (par3 > 0) x <- diff(x,lag=1,difference=par3)
if (par4 > 0) x <- diff(x,lag=par5,difference=par4)
bitmap(file='picts.png')
op <- par(mfrow=c(2,1))
plot(ox,type='l',main='Original Time Series',xlab='time',ylab='value')
if (par8=='') {
mytitle <- paste('Working Time Series (lambda=',par2,', d=',par3,', D=',par4,')',sep='')
mysub <- paste('(lambda=',par2,', d=',par3,', D=',par4,', CI=', par7, ', CI type=',par6,')',sep='')
} else {
mytitle <- paste('Working Time Series (base=',par8,', d=',par3,', D=',par4,')',sep='')
mysub <- paste('(base=',par8,', d=',par3,', D=',par4,', CI=', par7, ', CI type=',par6,')',sep='')
}
plot(x,type='l', main=mytitle,xlab='time',ylab='value')
par(op)
dev.off()
bitmap(file='pic1.png')
racf <- acf(x, par1, main='Autocorrelation', xlab='time lag', ylab='ACF', ci.type=par6, ci=par7, sub=mysub)
dev.off()
bitmap(file='pic2.png')
rpacf <- pacf(x,par1,main='Partial Autocorrelation',xlab='lags',ylab='PACF',sub=mysub)
dev.off()
(myacf <- c(racf$acf))
(mypacf <- c(rpacf$acf))
lengthx <- length(x)
sqrtn <- sqrt(lengthx)
load(file='createtable')
a<-table.start()
a<-table.row.start(a)
a<-table.element(a,'Autocorrelation Function',4,TRUE)
a<-table.row.end(a)
a<-table.row.start(a)
a<-table.element(a,'Time lag k',header=TRUE)
a<-table.element(a,hyperlink('basics.htm','ACF(k)','click here for more information about the Autocorrelation Function'),header=TRUE)
a<-table.element(a,'T-STAT',header=TRUE)
a<-table.element(a,'P-value',header=TRUE)
a<-table.row.end(a)
for (i in 2:(par1+1)) {
a<-table.row.start(a)
a<-table.element(a,i-1,header=TRUE)
a<-table.element(a,round(myacf[i],6))
mytstat <- myacf[i]*sqrtn
a<-table.element(a,round(mytstat,4))
a<-table.element(a,round(1-pt(abs(mytstat),lengthx),6))
a<-table.row.end(a)
}
a<-table.end(a)
table.save(a,file='mytable.tab')
a<-table.start()
a<-table.row.start(a)
a<-table.element(a,'Partial Autocorrelation Function',4,TRUE)
a<-table.row.end(a)
a<-table.row.start(a)
a<-table.element(a,'Time lag k',header=TRUE)
a<-table.element(a,hyperlink('basics.htm','PACF(k)','click here for more information about the Partial Autocorrelation Function'),header=TRUE)
a<-table.element(a,'T-STAT',header=TRUE)
a<-table.element(a,'P-value',header=TRUE)
a<-table.row.end(a)
for (i in 1:par1) {
a<-table.row.start(a)
a<-table.element(a,i,header=TRUE)
a<-table.element(a,round(mypacf[i],6))
mytstat <- mypacf[i]*sqrtn
a<-table.element(a,round(mytstat,4))
a<-table.element(a,round(1-pt(abs(mytstat),lengthx),6))
a<-table.row.end(a)
}
a<-table.end(a)
table.save(a,file='mytable1.tab')