Free Statistics
of Irreproducible Research!
Description of Statistical Computation | |||||||||||||||||||||||||||||||||||||||||
|---|---|---|---|---|---|---|---|---|---|---|---|---|---|---|---|---|---|---|---|---|---|---|---|---|---|---|---|---|---|---|---|---|---|---|---|---|---|---|---|---|---|
| Author's title | |||||||||||||||||||||||||||||||||||||||||
| Author | *Unverified author* | ||||||||||||||||||||||||||||||||||||||||
| R Software Module | rwasp_univariatedataseries.wasp | ||||||||||||||||||||||||||||||||||||||||
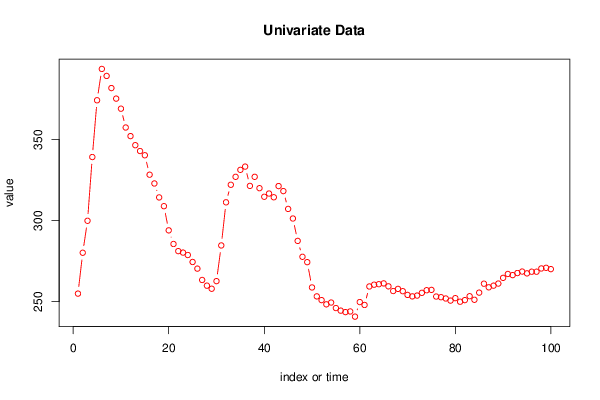
| Title produced by software | Univariate Data Series | ||||||||||||||||||||||||||||||||||||||||
| Date of computation | Wed, 13 Nov 2013 11:38:09 -0500 | ||||||||||||||||||||||||||||||||||||||||
| Cite this page as follows | Statistical Computations at FreeStatistics.org, Office for Research Development and Education, URL https://freestatistics.org/blog/index.php?v=date/2013/Nov/13/t1384360722jpqp4wsubhlv06x.htm/, Retrieved Sun, 28 Apr 2024 21:34:18 +0000 | ||||||||||||||||||||||||||||||||||||||||
| Statistical Computations at FreeStatistics.org, Office for Research Development and Education, URL https://freestatistics.org/blog/index.php?pk=224772, Retrieved Sun, 28 Apr 2024 21:34:18 +0000 | |||||||||||||||||||||||||||||||||||||||||
| QR Codes: | |||||||||||||||||||||||||||||||||||||||||
|
| |||||||||||||||||||||||||||||||||||||||||
| Original text written by user: | |||||||||||||||||||||||||||||||||||||||||
| IsPrivate? | No (this computation is public) | ||||||||||||||||||||||||||||||||||||||||
| User-defined keywords | |||||||||||||||||||||||||||||||||||||||||
| Estimated Impact | 80 | ||||||||||||||||||||||||||||||||||||||||
Tree of Dependent Computations | |||||||||||||||||||||||||||||||||||||||||
| Family? (F = Feedback message, R = changed R code, M = changed R Module, P = changed Parameters, D = changed Data) | |||||||||||||||||||||||||||||||||||||||||
| - [Univariate Data Series] [Arabica Price in ...] [2008-01-05 23:14:31] [74be16979710d4c4e7c6647856088456] - RMPD [Univariate Data Series] [Arabica Price in USA] [2013-11-13 16:38:09] [d41d8cd98f00b204e9800998ecf8427e] [Current] | |||||||||||||||||||||||||||||||||||||||||
| Feedback Forum | |||||||||||||||||||||||||||||||||||||||||
Post a new message | |||||||||||||||||||||||||||||||||||||||||
Dataset | |||||||||||||||||||||||||||||||||||||||||
| Dataseries X: | |||||||||||||||||||||||||||||||||||||||||
255 280.2 299.9 339.2 374.2 393.5 389.2 381.7 375.2 369 357.4 352.1 346.5 342.9 340.3 328.3 322.9 314.3 308.9 294 285.6 281.2 280.3 278.8 274.5 270.4 263.4 259.9 258 262.7 284.7 311.3 322.1 327 331.3 333.3 321.4 327 320 314.7 316.7 314.4 321.3 318.2 307.2 301.3 287.5 277.7 274.4 258.8 253.3 251 248.4 249.5 246.1 244.5 243.6 244 240.8 249.8 248 259.4 260.5 260.8 261.3 259.5 256.6 257.9 256.5 254.2 253.3 253.8 255.5 257.1 257.3 253.2 252.8 252 250.7 252.2 250 251 253.4 251.2 255.6 261.1 258.9 259.9 261.2 264.7 267.1 266.4 267.7 268.6 267.5 268.5 268.5 270.5 270.9 270.1 | |||||||||||||||||||||||||||||||||||||||||
Tables (Output of Computation) | |||||||||||||||||||||||||||||||||||||||||
| |||||||||||||||||||||||||||||||||||||||||
Figures (Output of Computation) | |||||||||||||||||||||||||||||||||||||||||
Input Parameters & R Code | |||||||||||||||||||||||||||||||||||||||||
| Parameters (Session): | |||||||||||||||||||||||||||||||||||||||||
| par1 = colombia ; par2 = www.ico.org ; par3 = Prices paid to growers in exporting Member countries in US cents per lb (Arabica, 1977/1 - 2006/12) ; par4 = 12 ; | |||||||||||||||||||||||||||||||||||||||||
| Parameters (R input): | |||||||||||||||||||||||||||||||||||||||||
| par1 = colombia ; par2 = www.ico.org ; par3 = Prices paid to growers in exporting Member countries in US cents per lb (Arabica, 1977/1 - 2006/12) ; par4 = 12 ; | |||||||||||||||||||||||||||||||||||||||||
| R code (references can be found in the software module): | |||||||||||||||||||||||||||||||||||||||||
bitmap(file='test1.png') | |||||||||||||||||||||||||||||||||||||||||