Free Statistics

of Irreproducible Research!

Author's title

Author*Unverified author*
R Software Modulerwasp_autocorrelation.wasp
Title produced by software(Partial) Autocorrelation Function
Date of computationWed, 13 Nov 2013 08:11:17 -0500
Cite this page as followsStatistical Computations at FreeStatistics.org, Office for Research Development and Education, URL https://freestatistics.org/blog/index.php?v=date/2013/Nov/13/t1384348301d86nlprfri72p6y.htm/, Retrieved Sun, 28 Apr 2024 23:45:43 +0000
Statistical Computations at FreeStatistics.org, Office for Research Development and Education, URL https://freestatistics.org/blog/index.php?pk=224708, Retrieved Sun, 28 Apr 2024 23:45:43 +0000
QR Codes:

Original text written by user:
IsPrivate?No (this computation is public)
User-defined keywords
Estimated Impact53
Family? (F = Feedback message, R = changed R code, M = changed R Module, P = changed Parameters, D = changed Data)
-       [(Partial) Autocorrelation Function] [] [2013-11-13 13:11:17] [27a1831061bd99e933e6c6e7cff94cc2] [Current]
Feedback Forum

Post a new message
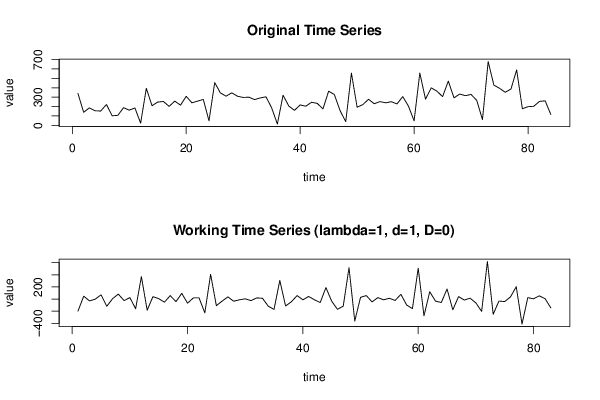
Dataseries X:
339
139
186
155
153
222
102
107
188
162
185
24
394
209
248
254
202
258
215
309
240
258
276
48
455
345
311
346
310
297
300
274
292
304
186
14
321
206
160
217
204
246
234
175
364
328
158
40
556
193
221
278
230
253
240
252
228
306
206
48
557
279
399
364
306
471
293
333
316
329
265
61
679
428
394
352
387
590
177
199
203
255
261
115


Summary of computational transaction
Raw Inputview raw input (R code)
Raw Outputview raw output of R engine
Computing time3 seconds
R Server'Gwilym Jenkins' @ jenkins.wessa.net

\begin{tabular}{lllllllll}
\hline
Summary of computational transaction \tabularnewline
Raw Input & view raw input (R code)  \tabularnewline
Raw Output & view raw output of R engine  \tabularnewline
Computing time & 3 seconds \tabularnewline
R Server & 'Gwilym Jenkins' @ jenkins.wessa.net \tabularnewline
\hline
\end{tabular}
%Source: https://freestatistics.org/blog/index.php?pk=224708&T=0

[TABLE]
[ROW][C]Summary of computational transaction[/C][/ROW]
[ROW][C]Raw Input[/C][C]view raw input (R code) [/C][/ROW]
[ROW][C]Raw Output[/C][C]view raw output of R engine [/C][/ROW]
[ROW][C]Computing time[/C][C]3 seconds[/C][/ROW]
[ROW][C]R Server[/C][C]'Gwilym Jenkins' @ jenkins.wessa.net[/C][/ROW]
[/TABLE]
Source: https://freestatistics.org/blog/index.php?pk=224708&T=0

Globally Unique Identifier (entire table): ba.freestatistics.org/blog/index.php?pk=224708&T=0

As an alternative you can also use a QR Code:  

The GUIDs for individual cells are displayed in the table below:

Summary of computational transaction
Raw Inputview raw input (R code)
Raw Outputview raw output of R engine
Computing time3 seconds
R Server'Gwilym Jenkins' @ jenkins.wessa.net


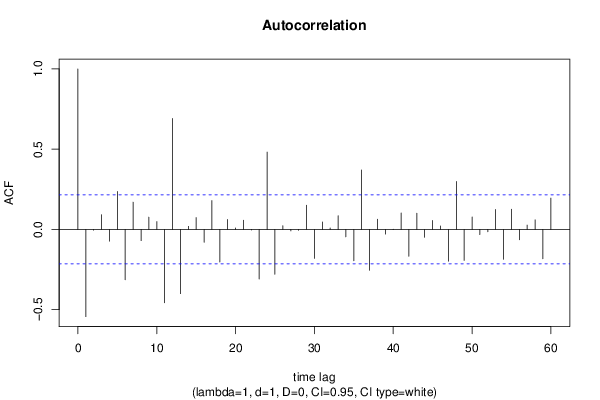
Autocorrelation Function
Time lag kACF(k)T-STATP-value
1-0.543658-4.9532e-06
2-0.004694-0.04280.482996
30.0912750.83160.204023
4-0.073179-0.66670.253409
50.2365422.1550.017029
6-0.313986-2.86050.002674
70.1698891.54780.062742
8-0.069861-0.63650.263112
90.076410.69610.244147
100.0486780.44350.329287
11-0.456873-4.16233.8e-05
120.691336.29830
13-0.400215-3.64610.000232
140.0190420.17350.431349
150.0737510.67190.251755
16-0.079753-0.72660.234764
170.1795981.63620.05279
18-0.203326-1.85240.033762
190.0620520.56530.28669
200.0088370.08050.468014
210.0573160.52220.30147
22-0.003748-0.03410.486423
23-0.309539-2.820.003002
240.4816654.38821.7e-05
25-0.27968-2.5480.006339
260.0226090.2060.418655
27-0.009139-0.08330.466921
28-0.004893-0.04460.482277
290.1502681.3690.087345
30-0.180638-1.64570.051805
310.046390.42260.336827
320.0086670.0790.468629
330.0856620.78040.218682
34-0.046362-0.42240.33692
35-0.195693-1.78280.039134
360.3700423.37120.000569
37-0.254956-2.32280.01132
380.0637350.58060.281525
39-0.029175-0.26580.395529
400.0015670.01430.494324
410.1018380.92780.178103
42-0.167808-1.52880.065058
430.100630.91680.180956
44-0.04844-0.44130.330067
450.055840.50870.306147
460.020910.19050.424693
47-0.197612-1.80030.037721
480.2989172.72330.003939
49-0.193047-1.75870.041154
500.0773170.70440.24158
51-0.032334-0.29460.384526
52-0.01454-0.13250.44747
530.1237131.12710.131479
54-0.186354-1.69780.046649
550.1255011.14340.128086
56-0.064172-0.58460.280188
570.0266630.24290.404336
580.0595310.54240.294513
59-0.183312-1.67010.049338
600.1949251.77590.039711

\begin{tabular}{lllllllll}
\hline
Autocorrelation Function \tabularnewline
Time lag k & ACF(k) & T-STAT & P-value \tabularnewline
1 & -0.543658 & -4.953 & 2e-06 \tabularnewline
2 & -0.004694 & -0.0428 & 0.482996 \tabularnewline
3 & 0.091275 & 0.8316 & 0.204023 \tabularnewline
4 & -0.073179 & -0.6667 & 0.253409 \tabularnewline
5 & 0.236542 & 2.155 & 0.017029 \tabularnewline
6 & -0.313986 & -2.8605 & 0.002674 \tabularnewline
7 & 0.169889 & 1.5478 & 0.062742 \tabularnewline
8 & -0.069861 & -0.6365 & 0.263112 \tabularnewline
9 & 0.07641 & 0.6961 & 0.244147 \tabularnewline
10 & 0.048678 & 0.4435 & 0.329287 \tabularnewline
11 & -0.456873 & -4.1623 & 3.8e-05 \tabularnewline
12 & 0.69133 & 6.2983 & 0 \tabularnewline
13 & -0.400215 & -3.6461 & 0.000232 \tabularnewline
14 & 0.019042 & 0.1735 & 0.431349 \tabularnewline
15 & 0.073751 & 0.6719 & 0.251755 \tabularnewline
16 & -0.079753 & -0.7266 & 0.234764 \tabularnewline
17 & 0.179598 & 1.6362 & 0.05279 \tabularnewline
18 & -0.203326 & -1.8524 & 0.033762 \tabularnewline
19 & 0.062052 & 0.5653 & 0.28669 \tabularnewline
20 & 0.008837 & 0.0805 & 0.468014 \tabularnewline
21 & 0.057316 & 0.5222 & 0.30147 \tabularnewline
22 & -0.003748 & -0.0341 & 0.486423 \tabularnewline
23 & -0.309539 & -2.82 & 0.003002 \tabularnewline
24 & 0.481665 & 4.3882 & 1.7e-05 \tabularnewline
25 & -0.27968 & -2.548 & 0.006339 \tabularnewline
26 & 0.022609 & 0.206 & 0.418655 \tabularnewline
27 & -0.009139 & -0.0833 & 0.466921 \tabularnewline
28 & -0.004893 & -0.0446 & 0.482277 \tabularnewline
29 & 0.150268 & 1.369 & 0.087345 \tabularnewline
30 & -0.180638 & -1.6457 & 0.051805 \tabularnewline
31 & 0.04639 & 0.4226 & 0.336827 \tabularnewline
32 & 0.008667 & 0.079 & 0.468629 \tabularnewline
33 & 0.085662 & 0.7804 & 0.218682 \tabularnewline
34 & -0.046362 & -0.4224 & 0.33692 \tabularnewline
35 & -0.195693 & -1.7828 & 0.039134 \tabularnewline
36 & 0.370042 & 3.3712 & 0.000569 \tabularnewline
37 & -0.254956 & -2.3228 & 0.01132 \tabularnewline
38 & 0.063735 & 0.5806 & 0.281525 \tabularnewline
39 & -0.029175 & -0.2658 & 0.395529 \tabularnewline
40 & 0.001567 & 0.0143 & 0.494324 \tabularnewline
41 & 0.101838 & 0.9278 & 0.178103 \tabularnewline
42 & -0.167808 & -1.5288 & 0.065058 \tabularnewline
43 & 0.10063 & 0.9168 & 0.180956 \tabularnewline
44 & -0.04844 & -0.4413 & 0.330067 \tabularnewline
45 & 0.05584 & 0.5087 & 0.306147 \tabularnewline
46 & 0.02091 & 0.1905 & 0.424693 \tabularnewline
47 & -0.197612 & -1.8003 & 0.037721 \tabularnewline
48 & 0.298917 & 2.7233 & 0.003939 \tabularnewline
49 & -0.193047 & -1.7587 & 0.041154 \tabularnewline
50 & 0.077317 & 0.7044 & 0.24158 \tabularnewline
51 & -0.032334 & -0.2946 & 0.384526 \tabularnewline
52 & -0.01454 & -0.1325 & 0.44747 \tabularnewline
53 & 0.123713 & 1.1271 & 0.131479 \tabularnewline
54 & -0.186354 & -1.6978 & 0.046649 \tabularnewline
55 & 0.125501 & 1.1434 & 0.128086 \tabularnewline
56 & -0.064172 & -0.5846 & 0.280188 \tabularnewline
57 & 0.026663 & 0.2429 & 0.404336 \tabularnewline
58 & 0.059531 & 0.5424 & 0.294513 \tabularnewline
59 & -0.183312 & -1.6701 & 0.049338 \tabularnewline
60 & 0.194925 & 1.7759 & 0.039711 \tabularnewline
\hline
\end{tabular}
%Source: https://freestatistics.org/blog/index.php?pk=224708&T=1

[TABLE]
[ROW][C]Autocorrelation Function[/C][/ROW]
[ROW][C]Time lag k[/C][C]ACF(k)[/C][C]T-STAT[/C][C]P-value[/C][/ROW]
[ROW][C]1[/C][C]-0.543658[/C][C]-4.953[/C][C]2e-06[/C][/ROW]
[ROW][C]2[/C][C]-0.004694[/C][C]-0.0428[/C][C]0.482996[/C][/ROW]
[ROW][C]3[/C][C]0.091275[/C][C]0.8316[/C][C]0.204023[/C][/ROW]
[ROW][C]4[/C][C]-0.073179[/C][C]-0.6667[/C][C]0.253409[/C][/ROW]
[ROW][C]5[/C][C]0.236542[/C][C]2.155[/C][C]0.017029[/C][/ROW]
[ROW][C]6[/C][C]-0.313986[/C][C]-2.8605[/C][C]0.002674[/C][/ROW]
[ROW][C]7[/C][C]0.169889[/C][C]1.5478[/C][C]0.062742[/C][/ROW]
[ROW][C]8[/C][C]-0.069861[/C][C]-0.6365[/C][C]0.263112[/C][/ROW]
[ROW][C]9[/C][C]0.07641[/C][C]0.6961[/C][C]0.244147[/C][/ROW]
[ROW][C]10[/C][C]0.048678[/C][C]0.4435[/C][C]0.329287[/C][/ROW]
[ROW][C]11[/C][C]-0.456873[/C][C]-4.1623[/C][C]3.8e-05[/C][/ROW]
[ROW][C]12[/C][C]0.69133[/C][C]6.2983[/C][C]0[/C][/ROW]
[ROW][C]13[/C][C]-0.400215[/C][C]-3.6461[/C][C]0.000232[/C][/ROW]
[ROW][C]14[/C][C]0.019042[/C][C]0.1735[/C][C]0.431349[/C][/ROW]
[ROW][C]15[/C][C]0.073751[/C][C]0.6719[/C][C]0.251755[/C][/ROW]
[ROW][C]16[/C][C]-0.079753[/C][C]-0.7266[/C][C]0.234764[/C][/ROW]
[ROW][C]17[/C][C]0.179598[/C][C]1.6362[/C][C]0.05279[/C][/ROW]
[ROW][C]18[/C][C]-0.203326[/C][C]-1.8524[/C][C]0.033762[/C][/ROW]
[ROW][C]19[/C][C]0.062052[/C][C]0.5653[/C][C]0.28669[/C][/ROW]
[ROW][C]20[/C][C]0.008837[/C][C]0.0805[/C][C]0.468014[/C][/ROW]
[ROW][C]21[/C][C]0.057316[/C][C]0.5222[/C][C]0.30147[/C][/ROW]
[ROW][C]22[/C][C]-0.003748[/C][C]-0.0341[/C][C]0.486423[/C][/ROW]
[ROW][C]23[/C][C]-0.309539[/C][C]-2.82[/C][C]0.003002[/C][/ROW]
[ROW][C]24[/C][C]0.481665[/C][C]4.3882[/C][C]1.7e-05[/C][/ROW]
[ROW][C]25[/C][C]-0.27968[/C][C]-2.548[/C][C]0.006339[/C][/ROW]
[ROW][C]26[/C][C]0.022609[/C][C]0.206[/C][C]0.418655[/C][/ROW]
[ROW][C]27[/C][C]-0.009139[/C][C]-0.0833[/C][C]0.466921[/C][/ROW]
[ROW][C]28[/C][C]-0.004893[/C][C]-0.0446[/C][C]0.482277[/C][/ROW]
[ROW][C]29[/C][C]0.150268[/C][C]1.369[/C][C]0.087345[/C][/ROW]
[ROW][C]30[/C][C]-0.180638[/C][C]-1.6457[/C][C]0.051805[/C][/ROW]
[ROW][C]31[/C][C]0.04639[/C][C]0.4226[/C][C]0.336827[/C][/ROW]
[ROW][C]32[/C][C]0.008667[/C][C]0.079[/C][C]0.468629[/C][/ROW]
[ROW][C]33[/C][C]0.085662[/C][C]0.7804[/C][C]0.218682[/C][/ROW]
[ROW][C]34[/C][C]-0.046362[/C][C]-0.4224[/C][C]0.33692[/C][/ROW]
[ROW][C]35[/C][C]-0.195693[/C][C]-1.7828[/C][C]0.039134[/C][/ROW]
[ROW][C]36[/C][C]0.370042[/C][C]3.3712[/C][C]0.000569[/C][/ROW]
[ROW][C]37[/C][C]-0.254956[/C][C]-2.3228[/C][C]0.01132[/C][/ROW]
[ROW][C]38[/C][C]0.063735[/C][C]0.5806[/C][C]0.281525[/C][/ROW]
[ROW][C]39[/C][C]-0.029175[/C][C]-0.2658[/C][C]0.395529[/C][/ROW]
[ROW][C]40[/C][C]0.001567[/C][C]0.0143[/C][C]0.494324[/C][/ROW]
[ROW][C]41[/C][C]0.101838[/C][C]0.9278[/C][C]0.178103[/C][/ROW]
[ROW][C]42[/C][C]-0.167808[/C][C]-1.5288[/C][C]0.065058[/C][/ROW]
[ROW][C]43[/C][C]0.10063[/C][C]0.9168[/C][C]0.180956[/C][/ROW]
[ROW][C]44[/C][C]-0.04844[/C][C]-0.4413[/C][C]0.330067[/C][/ROW]
[ROW][C]45[/C][C]0.05584[/C][C]0.5087[/C][C]0.306147[/C][/ROW]
[ROW][C]46[/C][C]0.02091[/C][C]0.1905[/C][C]0.424693[/C][/ROW]
[ROW][C]47[/C][C]-0.197612[/C][C]-1.8003[/C][C]0.037721[/C][/ROW]
[ROW][C]48[/C][C]0.298917[/C][C]2.7233[/C][C]0.003939[/C][/ROW]
[ROW][C]49[/C][C]-0.193047[/C][C]-1.7587[/C][C]0.041154[/C][/ROW]
[ROW][C]50[/C][C]0.077317[/C][C]0.7044[/C][C]0.24158[/C][/ROW]
[ROW][C]51[/C][C]-0.032334[/C][C]-0.2946[/C][C]0.384526[/C][/ROW]
[ROW][C]52[/C][C]-0.01454[/C][C]-0.1325[/C][C]0.44747[/C][/ROW]
[ROW][C]53[/C][C]0.123713[/C][C]1.1271[/C][C]0.131479[/C][/ROW]
[ROW][C]54[/C][C]-0.186354[/C][C]-1.6978[/C][C]0.046649[/C][/ROW]
[ROW][C]55[/C][C]0.125501[/C][C]1.1434[/C][C]0.128086[/C][/ROW]
[ROW][C]56[/C][C]-0.064172[/C][C]-0.5846[/C][C]0.280188[/C][/ROW]
[ROW][C]57[/C][C]0.026663[/C][C]0.2429[/C][C]0.404336[/C][/ROW]
[ROW][C]58[/C][C]0.059531[/C][C]0.5424[/C][C]0.294513[/C][/ROW]
[ROW][C]59[/C][C]-0.183312[/C][C]-1.6701[/C][C]0.049338[/C][/ROW]
[ROW][C]60[/C][C]0.194925[/C][C]1.7759[/C][C]0.039711[/C][/ROW]
[/TABLE]
Source: https://freestatistics.org/blog/index.php?pk=224708&T=1

Globally Unique Identifier (entire table): ba.freestatistics.org/blog/index.php?pk=224708&T=1

As an alternative you can also use a QR Code:  

The GUIDs for individual cells are displayed in the table below:

Autocorrelation Function
Time lag kACF(k)T-STATP-value
1-0.543658-4.9532e-06
2-0.004694-0.04280.482996
30.0912750.83160.204023
4-0.073179-0.66670.253409
50.2365422.1550.017029
6-0.313986-2.86050.002674
70.1698891.54780.062742
8-0.069861-0.63650.263112
90.076410.69610.244147
100.0486780.44350.329287
11-0.456873-4.16233.8e-05
120.691336.29830
13-0.400215-3.64610.000232
140.0190420.17350.431349
150.0737510.67190.251755
16-0.079753-0.72660.234764
170.1795981.63620.05279
18-0.203326-1.85240.033762
190.0620520.56530.28669
200.0088370.08050.468014
210.0573160.52220.30147
22-0.003748-0.03410.486423
23-0.309539-2.820.003002
240.4816654.38821.7e-05
25-0.27968-2.5480.006339
260.0226090.2060.418655
27-0.009139-0.08330.466921
28-0.004893-0.04460.482277
290.1502681.3690.087345
30-0.180638-1.64570.051805
310.046390.42260.336827
320.0086670.0790.468629
330.0856620.78040.218682
34-0.046362-0.42240.33692
35-0.195693-1.78280.039134
360.3700423.37120.000569
37-0.254956-2.32280.01132
380.0637350.58060.281525
39-0.029175-0.26580.395529
400.0015670.01430.494324
410.1018380.92780.178103
42-0.167808-1.52880.065058
430.100630.91680.180956
44-0.04844-0.44130.330067
450.055840.50870.306147
460.020910.19050.424693
47-0.197612-1.80030.037721
480.2989172.72330.003939
49-0.193047-1.75870.041154
500.0773170.70440.24158
51-0.032334-0.29460.384526
52-0.01454-0.13250.44747
530.1237131.12710.131479
54-0.186354-1.69780.046649
550.1255011.14340.128086
56-0.064172-0.58460.280188
570.0266630.24290.404336
580.0595310.54240.294513
59-0.183312-1.67010.049338
600.1949251.77590.039711


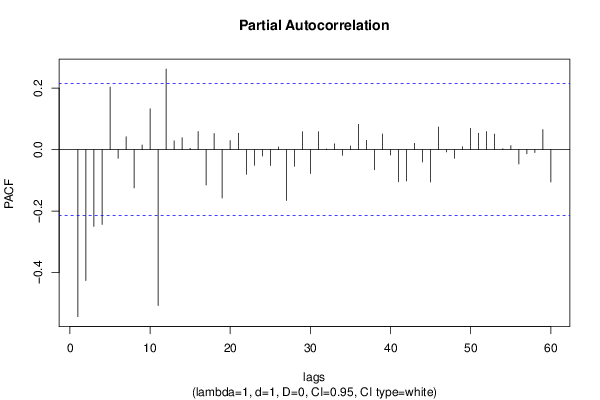
Partial Autocorrelation Function
Time lag kPACF(k)T-STATP-value
1-0.543658-4.9532e-06
2-0.426238-3.88320.000103
3-0.249962-2.27730.012671
4-0.243294-2.21650.014696
50.20351.8540.033648
6-0.028153-0.25650.399104
70.0418440.38120.35201
8-0.124651-1.13560.129691
90.0149890.13660.445855
100.1328861.21060.114734
11-0.507427-4.62297e-06
120.2625342.39180.009513
130.028580.26040.39761
140.0384170.350.363614
150.0041430.03770.484991
160.0592370.53970.295432
17-0.115385-1.05120.148106
180.0522180.47570.31776
19-0.157264-1.43270.077844
200.0293920.26780.394768
210.0532780.48540.314341
22-0.080112-0.72990.233768
23-0.050774-0.46260.322441
24-0.021044-0.19170.424214
25-0.051735-0.47130.31932
260.0086880.07920.46855
27-0.165479-1.50760.067728
28-0.054352-0.49520.310893
290.0583070.53120.298349
30-0.07787-0.70940.240023
310.0580320.52870.299214
320.0020710.01890.492496
330.0187140.17050.432518
34-0.018391-0.16760.433672
350.0118580.1080.457114
360.0828340.75470.226296
370.0306440.27920.390399
38-0.065817-0.59960.275196
390.0507580.46240.322493
40-0.017662-0.16090.43628
41-0.104565-0.95260.171771
42-0.102099-0.93020.177492
430.0208960.19040.424742
44-0.040406-0.36810.35686
45-0.105217-0.95860.170279
460.0738220.67250.251551
47-0.007314-0.06660.473517
48-0.028367-0.25840.398356
490.0094360.0860.46585
500.0691490.630.26522
510.0530640.48340.315029
520.0587350.53510.297007
530.0504960.460.323344
540.002890.02630.48953
550.0130480.11890.452831
56-0.046687-0.42530.335845
57-0.013729-0.12510.450381
58-0.009405-0.08570.465961
590.0651290.59340.27728
60-0.105246-0.95880.170213

\begin{tabular}{lllllllll}
\hline
Partial Autocorrelation Function \tabularnewline
Time lag k & PACF(k) & T-STAT & P-value \tabularnewline
1 & -0.543658 & -4.953 & 2e-06 \tabularnewline
2 & -0.426238 & -3.8832 & 0.000103 \tabularnewline
3 & -0.249962 & -2.2773 & 0.012671 \tabularnewline
4 & -0.243294 & -2.2165 & 0.014696 \tabularnewline
5 & 0.2035 & 1.854 & 0.033648 \tabularnewline
6 & -0.028153 & -0.2565 & 0.399104 \tabularnewline
7 & 0.041844 & 0.3812 & 0.35201 \tabularnewline
8 & -0.124651 & -1.1356 & 0.129691 \tabularnewline
9 & 0.014989 & 0.1366 & 0.445855 \tabularnewline
10 & 0.132886 & 1.2106 & 0.114734 \tabularnewline
11 & -0.507427 & -4.6229 & 7e-06 \tabularnewline
12 & 0.262534 & 2.3918 & 0.009513 \tabularnewline
13 & 0.02858 & 0.2604 & 0.39761 \tabularnewline
14 & 0.038417 & 0.35 & 0.363614 \tabularnewline
15 & 0.004143 & 0.0377 & 0.484991 \tabularnewline
16 & 0.059237 & 0.5397 & 0.295432 \tabularnewline
17 & -0.115385 & -1.0512 & 0.148106 \tabularnewline
18 & 0.052218 & 0.4757 & 0.31776 \tabularnewline
19 & -0.157264 & -1.4327 & 0.077844 \tabularnewline
20 & 0.029392 & 0.2678 & 0.394768 \tabularnewline
21 & 0.053278 & 0.4854 & 0.314341 \tabularnewline
22 & -0.080112 & -0.7299 & 0.233768 \tabularnewline
23 & -0.050774 & -0.4626 & 0.322441 \tabularnewline
24 & -0.021044 & -0.1917 & 0.424214 \tabularnewline
25 & -0.051735 & -0.4713 & 0.31932 \tabularnewline
26 & 0.008688 & 0.0792 & 0.46855 \tabularnewline
27 & -0.165479 & -1.5076 & 0.067728 \tabularnewline
28 & -0.054352 & -0.4952 & 0.310893 \tabularnewline
29 & 0.058307 & 0.5312 & 0.298349 \tabularnewline
30 & -0.07787 & -0.7094 & 0.240023 \tabularnewline
31 & 0.058032 & 0.5287 & 0.299214 \tabularnewline
32 & 0.002071 & 0.0189 & 0.492496 \tabularnewline
33 & 0.018714 & 0.1705 & 0.432518 \tabularnewline
34 & -0.018391 & -0.1676 & 0.433672 \tabularnewline
35 & 0.011858 & 0.108 & 0.457114 \tabularnewline
36 & 0.082834 & 0.7547 & 0.226296 \tabularnewline
37 & 0.030644 & 0.2792 & 0.390399 \tabularnewline
38 & -0.065817 & -0.5996 & 0.275196 \tabularnewline
39 & 0.050758 & 0.4624 & 0.322493 \tabularnewline
40 & -0.017662 & -0.1609 & 0.43628 \tabularnewline
41 & -0.104565 & -0.9526 & 0.171771 \tabularnewline
42 & -0.102099 & -0.9302 & 0.177492 \tabularnewline
43 & 0.020896 & 0.1904 & 0.424742 \tabularnewline
44 & -0.040406 & -0.3681 & 0.35686 \tabularnewline
45 & -0.105217 & -0.9586 & 0.170279 \tabularnewline
46 & 0.073822 & 0.6725 & 0.251551 \tabularnewline
47 & -0.007314 & -0.0666 & 0.473517 \tabularnewline
48 & -0.028367 & -0.2584 & 0.398356 \tabularnewline
49 & 0.009436 & 0.086 & 0.46585 \tabularnewline
50 & 0.069149 & 0.63 & 0.26522 \tabularnewline
51 & 0.053064 & 0.4834 & 0.315029 \tabularnewline
52 & 0.058735 & 0.5351 & 0.297007 \tabularnewline
53 & 0.050496 & 0.46 & 0.323344 \tabularnewline
54 & 0.00289 & 0.0263 & 0.48953 \tabularnewline
55 & 0.013048 & 0.1189 & 0.452831 \tabularnewline
56 & -0.046687 & -0.4253 & 0.335845 \tabularnewline
57 & -0.013729 & -0.1251 & 0.450381 \tabularnewline
58 & -0.009405 & -0.0857 & 0.465961 \tabularnewline
59 & 0.065129 & 0.5934 & 0.27728 \tabularnewline
60 & -0.105246 & -0.9588 & 0.170213 \tabularnewline
\hline
\end{tabular}
%Source: https://freestatistics.org/blog/index.php?pk=224708&T=2

[TABLE]
[ROW][C]Partial Autocorrelation Function[/C][/ROW]
[ROW][C]Time lag k[/C][C]PACF(k)[/C][C]T-STAT[/C][C]P-value[/C][/ROW]
[ROW][C]1[/C][C]-0.543658[/C][C]-4.953[/C][C]2e-06[/C][/ROW]
[ROW][C]2[/C][C]-0.426238[/C][C]-3.8832[/C][C]0.000103[/C][/ROW]
[ROW][C]3[/C][C]-0.249962[/C][C]-2.2773[/C][C]0.012671[/C][/ROW]
[ROW][C]4[/C][C]-0.243294[/C][C]-2.2165[/C][C]0.014696[/C][/ROW]
[ROW][C]5[/C][C]0.2035[/C][C]1.854[/C][C]0.033648[/C][/ROW]
[ROW][C]6[/C][C]-0.028153[/C][C]-0.2565[/C][C]0.399104[/C][/ROW]
[ROW][C]7[/C][C]0.041844[/C][C]0.3812[/C][C]0.35201[/C][/ROW]
[ROW][C]8[/C][C]-0.124651[/C][C]-1.1356[/C][C]0.129691[/C][/ROW]
[ROW][C]9[/C][C]0.014989[/C][C]0.1366[/C][C]0.445855[/C][/ROW]
[ROW][C]10[/C][C]0.132886[/C][C]1.2106[/C][C]0.114734[/C][/ROW]
[ROW][C]11[/C][C]-0.507427[/C][C]-4.6229[/C][C]7e-06[/C][/ROW]
[ROW][C]12[/C][C]0.262534[/C][C]2.3918[/C][C]0.009513[/C][/ROW]
[ROW][C]13[/C][C]0.02858[/C][C]0.2604[/C][C]0.39761[/C][/ROW]
[ROW][C]14[/C][C]0.038417[/C][C]0.35[/C][C]0.363614[/C][/ROW]
[ROW][C]15[/C][C]0.004143[/C][C]0.0377[/C][C]0.484991[/C][/ROW]
[ROW][C]16[/C][C]0.059237[/C][C]0.5397[/C][C]0.295432[/C][/ROW]
[ROW][C]17[/C][C]-0.115385[/C][C]-1.0512[/C][C]0.148106[/C][/ROW]
[ROW][C]18[/C][C]0.052218[/C][C]0.4757[/C][C]0.31776[/C][/ROW]
[ROW][C]19[/C][C]-0.157264[/C][C]-1.4327[/C][C]0.077844[/C][/ROW]
[ROW][C]20[/C][C]0.029392[/C][C]0.2678[/C][C]0.394768[/C][/ROW]
[ROW][C]21[/C][C]0.053278[/C][C]0.4854[/C][C]0.314341[/C][/ROW]
[ROW][C]22[/C][C]-0.080112[/C][C]-0.7299[/C][C]0.233768[/C][/ROW]
[ROW][C]23[/C][C]-0.050774[/C][C]-0.4626[/C][C]0.322441[/C][/ROW]
[ROW][C]24[/C][C]-0.021044[/C][C]-0.1917[/C][C]0.424214[/C][/ROW]
[ROW][C]25[/C][C]-0.051735[/C][C]-0.4713[/C][C]0.31932[/C][/ROW]
[ROW][C]26[/C][C]0.008688[/C][C]0.0792[/C][C]0.46855[/C][/ROW]
[ROW][C]27[/C][C]-0.165479[/C][C]-1.5076[/C][C]0.067728[/C][/ROW]
[ROW][C]28[/C][C]-0.054352[/C][C]-0.4952[/C][C]0.310893[/C][/ROW]
[ROW][C]29[/C][C]0.058307[/C][C]0.5312[/C][C]0.298349[/C][/ROW]
[ROW][C]30[/C][C]-0.07787[/C][C]-0.7094[/C][C]0.240023[/C][/ROW]
[ROW][C]31[/C][C]0.058032[/C][C]0.5287[/C][C]0.299214[/C][/ROW]
[ROW][C]32[/C][C]0.002071[/C][C]0.0189[/C][C]0.492496[/C][/ROW]
[ROW][C]33[/C][C]0.018714[/C][C]0.1705[/C][C]0.432518[/C][/ROW]
[ROW][C]34[/C][C]-0.018391[/C][C]-0.1676[/C][C]0.433672[/C][/ROW]
[ROW][C]35[/C][C]0.011858[/C][C]0.108[/C][C]0.457114[/C][/ROW]
[ROW][C]36[/C][C]0.082834[/C][C]0.7547[/C][C]0.226296[/C][/ROW]
[ROW][C]37[/C][C]0.030644[/C][C]0.2792[/C][C]0.390399[/C][/ROW]
[ROW][C]38[/C][C]-0.065817[/C][C]-0.5996[/C][C]0.275196[/C][/ROW]
[ROW][C]39[/C][C]0.050758[/C][C]0.4624[/C][C]0.322493[/C][/ROW]
[ROW][C]40[/C][C]-0.017662[/C][C]-0.1609[/C][C]0.43628[/C][/ROW]
[ROW][C]41[/C][C]-0.104565[/C][C]-0.9526[/C][C]0.171771[/C][/ROW]
[ROW][C]42[/C][C]-0.102099[/C][C]-0.9302[/C][C]0.177492[/C][/ROW]
[ROW][C]43[/C][C]0.020896[/C][C]0.1904[/C][C]0.424742[/C][/ROW]
[ROW][C]44[/C][C]-0.040406[/C][C]-0.3681[/C][C]0.35686[/C][/ROW]
[ROW][C]45[/C][C]-0.105217[/C][C]-0.9586[/C][C]0.170279[/C][/ROW]
[ROW][C]46[/C][C]0.073822[/C][C]0.6725[/C][C]0.251551[/C][/ROW]
[ROW][C]47[/C][C]-0.007314[/C][C]-0.0666[/C][C]0.473517[/C][/ROW]
[ROW][C]48[/C][C]-0.028367[/C][C]-0.2584[/C][C]0.398356[/C][/ROW]
[ROW][C]49[/C][C]0.009436[/C][C]0.086[/C][C]0.46585[/C][/ROW]
[ROW][C]50[/C][C]0.069149[/C][C]0.63[/C][C]0.26522[/C][/ROW]
[ROW][C]51[/C][C]0.053064[/C][C]0.4834[/C][C]0.315029[/C][/ROW]
[ROW][C]52[/C][C]0.058735[/C][C]0.5351[/C][C]0.297007[/C][/ROW]
[ROW][C]53[/C][C]0.050496[/C][C]0.46[/C][C]0.323344[/C][/ROW]
[ROW][C]54[/C][C]0.00289[/C][C]0.0263[/C][C]0.48953[/C][/ROW]
[ROW][C]55[/C][C]0.013048[/C][C]0.1189[/C][C]0.452831[/C][/ROW]
[ROW][C]56[/C][C]-0.046687[/C][C]-0.4253[/C][C]0.335845[/C][/ROW]
[ROW][C]57[/C][C]-0.013729[/C][C]-0.1251[/C][C]0.450381[/C][/ROW]
[ROW][C]58[/C][C]-0.009405[/C][C]-0.0857[/C][C]0.465961[/C][/ROW]
[ROW][C]59[/C][C]0.065129[/C][C]0.5934[/C][C]0.27728[/C][/ROW]
[ROW][C]60[/C][C]-0.105246[/C][C]-0.9588[/C][C]0.170213[/C][/ROW]
[/TABLE]
Source: https://freestatistics.org/blog/index.php?pk=224708&T=2

Globally Unique Identifier (entire table): ba.freestatistics.org/blog/index.php?pk=224708&T=2

As an alternative you can also use a QR Code:  

The GUIDs for individual cells are displayed in the table below:

Partial Autocorrelation Function
Time lag kPACF(k)T-STATP-value
1-0.543658-4.9532e-06
2-0.426238-3.88320.000103
3-0.249962-2.27730.012671
4-0.243294-2.21650.014696
50.20351.8540.033648
6-0.028153-0.25650.399104
70.0418440.38120.35201
8-0.124651-1.13560.129691
90.0149890.13660.445855
100.1328861.21060.114734
11-0.507427-4.62297e-06
120.2625342.39180.009513
130.028580.26040.39761
140.0384170.350.363614
150.0041430.03770.484991
160.0592370.53970.295432
17-0.115385-1.05120.148106
180.0522180.47570.31776
19-0.157264-1.43270.077844
200.0293920.26780.394768
210.0532780.48540.314341
22-0.080112-0.72990.233768
23-0.050774-0.46260.322441
24-0.021044-0.19170.424214
25-0.051735-0.47130.31932
260.0086880.07920.46855
27-0.165479-1.50760.067728
28-0.054352-0.49520.310893
290.0583070.53120.298349
30-0.07787-0.70940.240023
310.0580320.52870.299214
320.0020710.01890.492496
330.0187140.17050.432518
34-0.018391-0.16760.433672
350.0118580.1080.457114
360.0828340.75470.226296
370.0306440.27920.390399
38-0.065817-0.59960.275196
390.0507580.46240.322493
40-0.017662-0.16090.43628
41-0.104565-0.95260.171771
42-0.102099-0.93020.177492
430.0208960.19040.424742
44-0.040406-0.36810.35686
45-0.105217-0.95860.170279
460.0738220.67250.251551
47-0.007314-0.06660.473517
48-0.028367-0.25840.398356
490.0094360.0860.46585
500.0691490.630.26522
510.0530640.48340.315029
520.0587350.53510.297007
530.0504960.460.323344
540.002890.02630.48953
550.0130480.11890.452831
56-0.046687-0.42530.335845
57-0.013729-0.12510.450381
58-0.009405-0.08570.465961
590.0651290.59340.27728
60-0.105246-0.95880.170213


Parameters (Session):
par1 = 60 ; par2 = 1 ; par3 = 1 ; par4 = 0 ; par5 = 12 ; par6 = White Noise ; par7 = 0.95 ;
Parameters (R input):
par1 = 60 ; par2 = 1 ; par3 = 1 ; par4 = 0 ; par5 = 12 ; par6 = White Noise ; par7 = 0.95 ; par8 = ;
R code (references can be found in the software module):
if (par1 == 'Default') {
par1 = 10*log10(length(x))
} else {
par1 <- as.numeric(par1)
}
par2 <- as.numeric(par2)
par3 <- as.numeric(par3)
par4 <- as.numeric(par4)
par5 <- as.numeric(par5)
if (par6 == 'White Noise') par6 <- 'white' else par6 <- 'ma'
par7 <- as.numeric(par7)
if (par8 != '') par8 <- as.numeric(par8)
ox <- x
if (par8 == '') {
if (par2 == 0) {
x <- log(x)
} else {
x <- (x ^ par2 - 1) / par2
}
} else {
x <- log(x,base=par8)
}
if (par3 > 0) x <- diff(x,lag=1,difference=par3)
if (par4 > 0) x <- diff(x,lag=par5,difference=par4)
bitmap(file='picts.png')
op <- par(mfrow=c(2,1))
plot(ox,type='l',main='Original Time Series',xlab='time',ylab='value')
if (par8=='') {
mytitle <- paste('Working Time Series (lambda=',par2,', d=',par3,', D=',par4,')',sep='')
mysub <- paste('(lambda=',par2,', d=',par3,', D=',par4,', CI=', par7, ', CI type=',par6,')',sep='')
} else {
mytitle <- paste('Working Time Series (base=',par8,', d=',par3,', D=',par4,')',sep='')
mysub <- paste('(base=',par8,', d=',par3,', D=',par4,', CI=', par7, ', CI type=',par6,')',sep='')
}
plot(x,type='l', main=mytitle,xlab='time',ylab='value')
par(op)
dev.off()
bitmap(file='pic1.png')
racf <- acf(x, par1, main='Autocorrelation', xlab='time lag', ylab='ACF', ci.type=par6, ci=par7, sub=mysub)
dev.off()
bitmap(file='pic2.png')
rpacf <- pacf(x,par1,main='Partial Autocorrelation',xlab='lags',ylab='PACF',sub=mysub)
dev.off()
(myacf <- c(racf$acf))
(mypacf <- c(rpacf$acf))
lengthx <- length(x)
sqrtn <- sqrt(lengthx)
load(file='createtable')
a<-table.start()
a<-table.row.start(a)
a<-table.element(a,'Autocorrelation Function',4,TRUE)
a<-table.row.end(a)
a<-table.row.start(a)
a<-table.element(a,'Time lag k',header=TRUE)
a<-table.element(a,hyperlink('basics.htm','ACF(k)','click here for more information about the Autocorrelation Function'),header=TRUE)
a<-table.element(a,'T-STAT',header=TRUE)
a<-table.element(a,'P-value',header=TRUE)
a<-table.row.end(a)
for (i in 2:(par1+1)) {
a<-table.row.start(a)
a<-table.element(a,i-1,header=TRUE)
a<-table.element(a,round(myacf[i],6))
mytstat <- myacf[i]*sqrtn
a<-table.element(a,round(mytstat,4))
a<-table.element(a,round(1-pt(abs(mytstat),lengthx),6))
a<-table.row.end(a)
}
a<-table.end(a)
table.save(a,file='mytable.tab')
a<-table.start()
a<-table.row.start(a)
a<-table.element(a,'Partial Autocorrelation Function',4,TRUE)
a<-table.row.end(a)
a<-table.row.start(a)
a<-table.element(a,'Time lag k',header=TRUE)
a<-table.element(a,hyperlink('basics.htm','PACF(k)','click here for more information about the Partial Autocorrelation Function'),header=TRUE)
a<-table.element(a,'T-STAT',header=TRUE)
a<-table.element(a,'P-value',header=TRUE)
a<-table.row.end(a)
for (i in 1:par1) {
a<-table.row.start(a)
a<-table.element(a,i,header=TRUE)
a<-table.element(a,round(mypacf[i],6))
mytstat <- mypacf[i]*sqrtn
a<-table.element(a,round(mytstat,4))
a<-table.element(a,round(1-pt(abs(mytstat),lengthx),6))
a<-table.row.end(a)
}
a<-table.end(a)
table.save(a,file='mytable1.tab')