Free Statistics

of Irreproducible Research!

Author's title

Author*Unverified author*
R Software Modulerwasp_autocorrelation.wasp
Title produced by software(Partial) Autocorrelation Function
Date of computationWed, 13 Nov 2013 07:53:40 -0500
Cite this page as followsStatistical Computations at FreeStatistics.org, Office for Research Development and Education, URL https://freestatistics.org/blog/index.php?v=date/2013/Nov/13/t1384347248nuef44zbwqkb8d8.htm/, Retrieved Mon, 29 Apr 2024 04:20:56 +0000
Statistical Computations at FreeStatistics.org, Office for Research Development and Education, URL https://freestatistics.org/blog/index.php?pk=224699, Retrieved Mon, 29 Apr 2024 04:20:56 +0000
QR Codes:

Original text written by user:
IsPrivate?No (this computation is public)
User-defined keywords
Estimated Impact55
Family? (F = Feedback message, R = changed R code, M = changed R Module, P = changed Parameters, D = changed Data)
-       [(Partial) Autocorrelation Function] [] [2013-11-13 12:53:40] [27a1831061bd99e933e6c6e7cff94cc2] [Current]
Feedback Forum

Post a new message
Dataseries X:
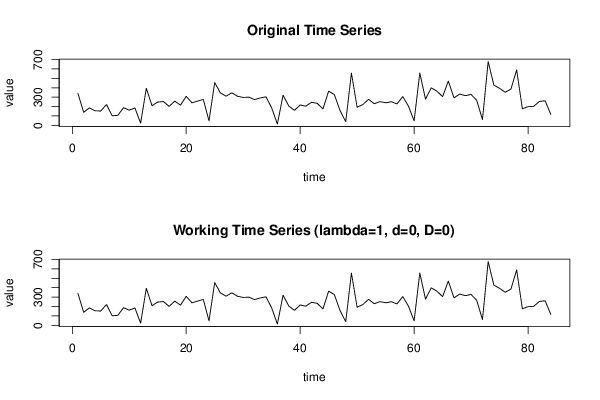
339
139
186
155
153
222
102
107
188
162
185
24
394
209
248
254
202
258
215
309
240
258
276
48
455
345
311
346
310
297
300
274
292
304
186
14
321
206
160
217
204
246
234
175
364
328
158
40
556
193
221
278
230
253
240
252
228
306
206
48
557
279
399
364
306
471
293
333
316
329
265
61
679
428
394
352
387
590
177
199
203
255
261
115


Summary of computational transaction
Raw Inputview raw input (R code)
Raw Outputview raw output of R engine
Computing time3 seconds
R Server'Gwilym Jenkins' @ jenkins.wessa.net

\begin{tabular}{lllllllll}
\hline
Summary of computational transaction \tabularnewline
Raw Input & view raw input (R code)  \tabularnewline
Raw Output & view raw output of R engine  \tabularnewline
Computing time & 3 seconds \tabularnewline
R Server & 'Gwilym Jenkins' @ jenkins.wessa.net \tabularnewline
\hline
\end{tabular}
%Source: https://freestatistics.org/blog/index.php?pk=224699&T=0

[TABLE]
[ROW][C]Summary of computational transaction[/C][/ROW]
[ROW][C]Raw Input[/C][C]view raw input (R code) [/C][/ROW]
[ROW][C]Raw Output[/C][C]view raw output of R engine [/C][/ROW]
[ROW][C]Computing time[/C][C]3 seconds[/C][/ROW]
[ROW][C]R Server[/C][C]'Gwilym Jenkins' @ jenkins.wessa.net[/C][/ROW]
[/TABLE]
Source: https://freestatistics.org/blog/index.php?pk=224699&T=0

Globally Unique Identifier (entire table): ba.freestatistics.org/blog/index.php?pk=224699&T=0

As an alternative you can also use a QR Code:  

The GUIDs for individual cells are displayed in the table below:

Summary of computational transaction
Raw Inputview raw input (R code)
Raw Outputview raw output of R engine
Computing time3 seconds
R Server'Gwilym Jenkins' @ jenkins.wessa.net


Autocorrelation Function
Time lag kACF(k)T-STATP-value
10.0353830.32430.373263
20.1373121.25850.105852
30.2446842.24260.013779
40.1738981.59380.057369
50.2423572.22120.014513
6-0.147201-1.34910.090462
70.1193191.09360.138633
80.0381440.34960.363758
90.081270.74490.22922
10-0.014231-0.13040.44827
11-0.199474-1.82820.035534
120.5274814.83443e-06
13-0.160724-1.47310.072236
14-0.050141-0.45960.323512
150.0293810.26930.394187
16-0.033574-0.30770.379531
170.0609730.55880.288883
18-0.195149-1.78860.038645
19-0.039396-0.36110.359478
20-0.027482-0.25190.400875
21-0.021085-0.19320.423615
22-0.120756-1.10670.135781
23-0.228747-2.09650.019523
240.3015552.76380.00351
25-0.173197-1.58740.058093
26-0.089591-0.82110.206953
27-0.035284-0.32340.373604
280.0246050.22550.411065
290.0986220.90390.184321
30-0.114759-1.05180.147958
310.0173270.15880.437101
320.0595880.54610.293212
330.089670.82180.206748
34-0.051444-0.47150.319256
35-0.100304-0.91930.180285
360.2786522.55390.006229
37-0.129015-1.18240.120183
38-0.029762-0.27280.392849
39-0.028865-0.26460.396
400.0284520.26080.397454
410.0609030.55820.289101
42-0.096703-0.88630.188993
430.0675730.61930.268692
440.038510.35290.362506
450.0909650.83370.203405
460.0318220.29170.385635
47-0.051291-0.47010.319754
480.2636762.41660.008915
49-0.061298-0.56180.287873
500.0245120.22470.411396
51-0.024966-0.22880.409783
52-0.018047-0.16540.434512
530.0172460.15810.437395
54-0.181889-1.6670.049615
55-0.02547-0.23340.407995
56-0.10773-0.98740.16315
57-0.061952-0.56780.285843
58-0.076348-0.69970.243012
59-0.19401-1.77810.0395
600.0612540.56140.288009

\begin{tabular}{lllllllll}
\hline
Autocorrelation Function \tabularnewline
Time lag k & ACF(k) & T-STAT & P-value \tabularnewline
1 & 0.035383 & 0.3243 & 0.373263 \tabularnewline
2 & 0.137312 & 1.2585 & 0.105852 \tabularnewline
3 & 0.244684 & 2.2426 & 0.013779 \tabularnewline
4 & 0.173898 & 1.5938 & 0.057369 \tabularnewline
5 & 0.242357 & 2.2212 & 0.014513 \tabularnewline
6 & -0.147201 & -1.3491 & 0.090462 \tabularnewline
7 & 0.119319 & 1.0936 & 0.138633 \tabularnewline
8 & 0.038144 & 0.3496 & 0.363758 \tabularnewline
9 & 0.08127 & 0.7449 & 0.22922 \tabularnewline
10 & -0.014231 & -0.1304 & 0.44827 \tabularnewline
11 & -0.199474 & -1.8282 & 0.035534 \tabularnewline
12 & 0.527481 & 4.8344 & 3e-06 \tabularnewline
13 & -0.160724 & -1.4731 & 0.072236 \tabularnewline
14 & -0.050141 & -0.4596 & 0.323512 \tabularnewline
15 & 0.029381 & 0.2693 & 0.394187 \tabularnewline
16 & -0.033574 & -0.3077 & 0.379531 \tabularnewline
17 & 0.060973 & 0.5588 & 0.288883 \tabularnewline
18 & -0.195149 & -1.7886 & 0.038645 \tabularnewline
19 & -0.039396 & -0.3611 & 0.359478 \tabularnewline
20 & -0.027482 & -0.2519 & 0.400875 \tabularnewline
21 & -0.021085 & -0.1932 & 0.423615 \tabularnewline
22 & -0.120756 & -1.1067 & 0.135781 \tabularnewline
23 & -0.228747 & -2.0965 & 0.019523 \tabularnewline
24 & 0.301555 & 2.7638 & 0.00351 \tabularnewline
25 & -0.173197 & -1.5874 & 0.058093 \tabularnewline
26 & -0.089591 & -0.8211 & 0.206953 \tabularnewline
27 & -0.035284 & -0.3234 & 0.373604 \tabularnewline
28 & 0.024605 & 0.2255 & 0.411065 \tabularnewline
29 & 0.098622 & 0.9039 & 0.184321 \tabularnewline
30 & -0.114759 & -1.0518 & 0.147958 \tabularnewline
31 & 0.017327 & 0.1588 & 0.437101 \tabularnewline
32 & 0.059588 & 0.5461 & 0.293212 \tabularnewline
33 & 0.08967 & 0.8218 & 0.206748 \tabularnewline
34 & -0.051444 & -0.4715 & 0.319256 \tabularnewline
35 & -0.100304 & -0.9193 & 0.180285 \tabularnewline
36 & 0.278652 & 2.5539 & 0.006229 \tabularnewline
37 & -0.129015 & -1.1824 & 0.120183 \tabularnewline
38 & -0.029762 & -0.2728 & 0.392849 \tabularnewline
39 & -0.028865 & -0.2646 & 0.396 \tabularnewline
40 & 0.028452 & 0.2608 & 0.397454 \tabularnewline
41 & 0.060903 & 0.5582 & 0.289101 \tabularnewline
42 & -0.096703 & -0.8863 & 0.188993 \tabularnewline
43 & 0.067573 & 0.6193 & 0.268692 \tabularnewline
44 & 0.03851 & 0.3529 & 0.362506 \tabularnewline
45 & 0.090965 & 0.8337 & 0.203405 \tabularnewline
46 & 0.031822 & 0.2917 & 0.385635 \tabularnewline
47 & -0.051291 & -0.4701 & 0.319754 \tabularnewline
48 & 0.263676 & 2.4166 & 0.008915 \tabularnewline
49 & -0.061298 & -0.5618 & 0.287873 \tabularnewline
50 & 0.024512 & 0.2247 & 0.411396 \tabularnewline
51 & -0.024966 & -0.2288 & 0.409783 \tabularnewline
52 & -0.018047 & -0.1654 & 0.434512 \tabularnewline
53 & 0.017246 & 0.1581 & 0.437395 \tabularnewline
54 & -0.181889 & -1.667 & 0.049615 \tabularnewline
55 & -0.02547 & -0.2334 & 0.407995 \tabularnewline
56 & -0.10773 & -0.9874 & 0.16315 \tabularnewline
57 & -0.061952 & -0.5678 & 0.285843 \tabularnewline
58 & -0.076348 & -0.6997 & 0.243012 \tabularnewline
59 & -0.19401 & -1.7781 & 0.0395 \tabularnewline
60 & 0.061254 & 0.5614 & 0.288009 \tabularnewline
\hline
\end{tabular}
%Source: https://freestatistics.org/blog/index.php?pk=224699&T=1

[TABLE]
[ROW][C]Autocorrelation Function[/C][/ROW]
[ROW][C]Time lag k[/C][C]ACF(k)[/C][C]T-STAT[/C][C]P-value[/C][/ROW]
[ROW][C]1[/C][C]0.035383[/C][C]0.3243[/C][C]0.373263[/C][/ROW]
[ROW][C]2[/C][C]0.137312[/C][C]1.2585[/C][C]0.105852[/C][/ROW]
[ROW][C]3[/C][C]0.244684[/C][C]2.2426[/C][C]0.013779[/C][/ROW]
[ROW][C]4[/C][C]0.173898[/C][C]1.5938[/C][C]0.057369[/C][/ROW]
[ROW][C]5[/C][C]0.242357[/C][C]2.2212[/C][C]0.014513[/C][/ROW]
[ROW][C]6[/C][C]-0.147201[/C][C]-1.3491[/C][C]0.090462[/C][/ROW]
[ROW][C]7[/C][C]0.119319[/C][C]1.0936[/C][C]0.138633[/C][/ROW]
[ROW][C]8[/C][C]0.038144[/C][C]0.3496[/C][C]0.363758[/C][/ROW]
[ROW][C]9[/C][C]0.08127[/C][C]0.7449[/C][C]0.22922[/C][/ROW]
[ROW][C]10[/C][C]-0.014231[/C][C]-0.1304[/C][C]0.44827[/C][/ROW]
[ROW][C]11[/C][C]-0.199474[/C][C]-1.8282[/C][C]0.035534[/C][/ROW]
[ROW][C]12[/C][C]0.527481[/C][C]4.8344[/C][C]3e-06[/C][/ROW]
[ROW][C]13[/C][C]-0.160724[/C][C]-1.4731[/C][C]0.072236[/C][/ROW]
[ROW][C]14[/C][C]-0.050141[/C][C]-0.4596[/C][C]0.323512[/C][/ROW]
[ROW][C]15[/C][C]0.029381[/C][C]0.2693[/C][C]0.394187[/C][/ROW]
[ROW][C]16[/C][C]-0.033574[/C][C]-0.3077[/C][C]0.379531[/C][/ROW]
[ROW][C]17[/C][C]0.060973[/C][C]0.5588[/C][C]0.288883[/C][/ROW]
[ROW][C]18[/C][C]-0.195149[/C][C]-1.7886[/C][C]0.038645[/C][/ROW]
[ROW][C]19[/C][C]-0.039396[/C][C]-0.3611[/C][C]0.359478[/C][/ROW]
[ROW][C]20[/C][C]-0.027482[/C][C]-0.2519[/C][C]0.400875[/C][/ROW]
[ROW][C]21[/C][C]-0.021085[/C][C]-0.1932[/C][C]0.423615[/C][/ROW]
[ROW][C]22[/C][C]-0.120756[/C][C]-1.1067[/C][C]0.135781[/C][/ROW]
[ROW][C]23[/C][C]-0.228747[/C][C]-2.0965[/C][C]0.019523[/C][/ROW]
[ROW][C]24[/C][C]0.301555[/C][C]2.7638[/C][C]0.00351[/C][/ROW]
[ROW][C]25[/C][C]-0.173197[/C][C]-1.5874[/C][C]0.058093[/C][/ROW]
[ROW][C]26[/C][C]-0.089591[/C][C]-0.8211[/C][C]0.206953[/C][/ROW]
[ROW][C]27[/C][C]-0.035284[/C][C]-0.3234[/C][C]0.373604[/C][/ROW]
[ROW][C]28[/C][C]0.024605[/C][C]0.2255[/C][C]0.411065[/C][/ROW]
[ROW][C]29[/C][C]0.098622[/C][C]0.9039[/C][C]0.184321[/C][/ROW]
[ROW][C]30[/C][C]-0.114759[/C][C]-1.0518[/C][C]0.147958[/C][/ROW]
[ROW][C]31[/C][C]0.017327[/C][C]0.1588[/C][C]0.437101[/C][/ROW]
[ROW][C]32[/C][C]0.059588[/C][C]0.5461[/C][C]0.293212[/C][/ROW]
[ROW][C]33[/C][C]0.08967[/C][C]0.8218[/C][C]0.206748[/C][/ROW]
[ROW][C]34[/C][C]-0.051444[/C][C]-0.4715[/C][C]0.319256[/C][/ROW]
[ROW][C]35[/C][C]-0.100304[/C][C]-0.9193[/C][C]0.180285[/C][/ROW]
[ROW][C]36[/C][C]0.278652[/C][C]2.5539[/C][C]0.006229[/C][/ROW]
[ROW][C]37[/C][C]-0.129015[/C][C]-1.1824[/C][C]0.120183[/C][/ROW]
[ROW][C]38[/C][C]-0.029762[/C][C]-0.2728[/C][C]0.392849[/C][/ROW]
[ROW][C]39[/C][C]-0.028865[/C][C]-0.2646[/C][C]0.396[/C][/ROW]
[ROW][C]40[/C][C]0.028452[/C][C]0.2608[/C][C]0.397454[/C][/ROW]
[ROW][C]41[/C][C]0.060903[/C][C]0.5582[/C][C]0.289101[/C][/ROW]
[ROW][C]42[/C][C]-0.096703[/C][C]-0.8863[/C][C]0.188993[/C][/ROW]
[ROW][C]43[/C][C]0.067573[/C][C]0.6193[/C][C]0.268692[/C][/ROW]
[ROW][C]44[/C][C]0.03851[/C][C]0.3529[/C][C]0.362506[/C][/ROW]
[ROW][C]45[/C][C]0.090965[/C][C]0.8337[/C][C]0.203405[/C][/ROW]
[ROW][C]46[/C][C]0.031822[/C][C]0.2917[/C][C]0.385635[/C][/ROW]
[ROW][C]47[/C][C]-0.051291[/C][C]-0.4701[/C][C]0.319754[/C][/ROW]
[ROW][C]48[/C][C]0.263676[/C][C]2.4166[/C][C]0.008915[/C][/ROW]
[ROW][C]49[/C][C]-0.061298[/C][C]-0.5618[/C][C]0.287873[/C][/ROW]
[ROW][C]50[/C][C]0.024512[/C][C]0.2247[/C][C]0.411396[/C][/ROW]
[ROW][C]51[/C][C]-0.024966[/C][C]-0.2288[/C][C]0.409783[/C][/ROW]
[ROW][C]52[/C][C]-0.018047[/C][C]-0.1654[/C][C]0.434512[/C][/ROW]
[ROW][C]53[/C][C]0.017246[/C][C]0.1581[/C][C]0.437395[/C][/ROW]
[ROW][C]54[/C][C]-0.181889[/C][C]-1.667[/C][C]0.049615[/C][/ROW]
[ROW][C]55[/C][C]-0.02547[/C][C]-0.2334[/C][C]0.407995[/C][/ROW]
[ROW][C]56[/C][C]-0.10773[/C][C]-0.9874[/C][C]0.16315[/C][/ROW]
[ROW][C]57[/C][C]-0.061952[/C][C]-0.5678[/C][C]0.285843[/C][/ROW]
[ROW][C]58[/C][C]-0.076348[/C][C]-0.6997[/C][C]0.243012[/C][/ROW]
[ROW][C]59[/C][C]-0.19401[/C][C]-1.7781[/C][C]0.0395[/C][/ROW]
[ROW][C]60[/C][C]0.061254[/C][C]0.5614[/C][C]0.288009[/C][/ROW]
[/TABLE]
Source: https://freestatistics.org/blog/index.php?pk=224699&T=1

Globally Unique Identifier (entire table): ba.freestatistics.org/blog/index.php?pk=224699&T=1

As an alternative you can also use a QR Code:  

The GUIDs for individual cells are displayed in the table below:

Autocorrelation Function
Time lag kACF(k)T-STATP-value
10.0353830.32430.373263
20.1373121.25850.105852
30.2446842.24260.013779
40.1738981.59380.057369
50.2423572.22120.014513
6-0.147201-1.34910.090462
70.1193191.09360.138633
80.0381440.34960.363758
90.081270.74490.22922
10-0.014231-0.13040.44827
11-0.199474-1.82820.035534
120.5274814.83443e-06
13-0.160724-1.47310.072236
14-0.050141-0.45960.323512
150.0293810.26930.394187
16-0.033574-0.30770.379531
170.0609730.55880.288883
18-0.195149-1.78860.038645
19-0.039396-0.36110.359478
20-0.027482-0.25190.400875
21-0.021085-0.19320.423615
22-0.120756-1.10670.135781
23-0.228747-2.09650.019523
240.3015552.76380.00351
25-0.173197-1.58740.058093
26-0.089591-0.82110.206953
27-0.035284-0.32340.373604
280.0246050.22550.411065
290.0986220.90390.184321
30-0.114759-1.05180.147958
310.0173270.15880.437101
320.0595880.54610.293212
330.089670.82180.206748
34-0.051444-0.47150.319256
35-0.100304-0.91930.180285
360.2786522.55390.006229
37-0.129015-1.18240.120183
38-0.029762-0.27280.392849
39-0.028865-0.26460.396
400.0284520.26080.397454
410.0609030.55820.289101
42-0.096703-0.88630.188993
430.0675730.61930.268692
440.038510.35290.362506
450.0909650.83370.203405
460.0318220.29170.385635
47-0.051291-0.47010.319754
480.2636762.41660.008915
49-0.061298-0.56180.287873
500.0245120.22470.411396
51-0.024966-0.22880.409783
52-0.018047-0.16540.434512
530.0172460.15810.437395
54-0.181889-1.6670.049615
55-0.02547-0.23340.407995
56-0.10773-0.98740.16315
57-0.061952-0.56780.285843
58-0.076348-0.69970.243012
59-0.19401-1.77810.0395
600.0612540.56140.288009


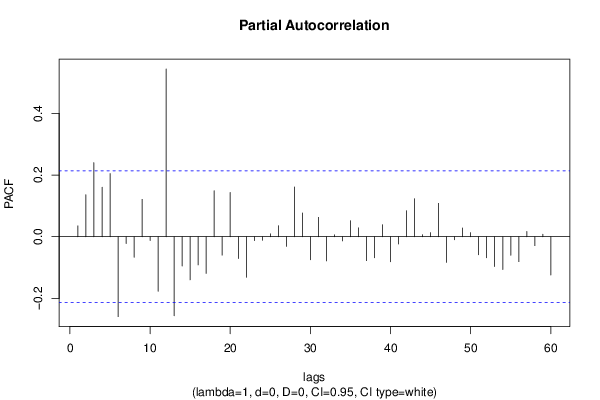
Partial Autocorrelation Function
Time lag kPACF(k)T-STATP-value
10.0353830.32430.373263
20.136231.24860.107645
30.2404252.20350.015147
40.16051.4710.072513
50.2047591.87660.032019
6-0.259291-2.37640.009877
7-0.022183-0.20330.419693
8-0.066351-0.60810.272375
90.1212181.1110.134872
10-0.012152-0.11140.455793
11-0.17705-1.62270.054201
120.5444574.992e-06
13-0.256439-2.35030.010551
14-0.095056-0.87120.193064
15-0.139864-1.28190.101707
16-0.091229-0.83610.202728
17-0.118858-1.08940.139557
180.1492971.36830.087429
19-0.059708-0.54720.292834
200.1436831.31690.095731
21-0.070674-0.64770.259461
22-0.131629-1.20640.115525
23-0.012508-0.11460.454503
24-0.011509-0.10550.458124
250.0092390.08470.466361
260.0357990.32810.371824
27-0.031242-0.28630.387664
280.1611911.47730.071662
290.0772210.70770.240532
30-0.074539-0.68320.248192
310.0628260.57580.283142
32-0.078306-0.71770.237472
330.0061630.05650.477544
34-0.013416-0.1230.451217
350.052160.47810.316926
360.0287850.26380.396284
37-0.077621-0.71140.2394
38-0.068435-0.62720.266108
390.038920.35670.361103
40-0.081025-0.74260.229897
41-0.023522-0.21560.414919
420.084140.77120.221388
430.1231291.12850.131161
440.0067680.0620.475342
450.0132910.12180.451667
460.1083030.99260.161874
47-0.083123-0.76180.224146
48-0.009694-0.08880.464708
490.0281930.25840.398367
500.0132870.12180.451683
51-0.058259-0.53390.297394
52-0.068205-0.62510.266797
53-0.096644-0.88580.189137
54-0.106546-0.97650.165807
55-0.059861-0.54860.292355
56-0.080891-0.74140.230266
570.0168640.15460.43877
58-0.02885-0.26440.396053
590.0078910.07230.471259
60-0.124225-1.13850.129066

\begin{tabular}{lllllllll}
\hline
Partial Autocorrelation Function \tabularnewline
Time lag k & PACF(k) & T-STAT & P-value \tabularnewline
1 & 0.035383 & 0.3243 & 0.373263 \tabularnewline
2 & 0.13623 & 1.2486 & 0.107645 \tabularnewline
3 & 0.240425 & 2.2035 & 0.015147 \tabularnewline
4 & 0.1605 & 1.471 & 0.072513 \tabularnewline
5 & 0.204759 & 1.8766 & 0.032019 \tabularnewline
6 & -0.259291 & -2.3764 & 0.009877 \tabularnewline
7 & -0.022183 & -0.2033 & 0.419693 \tabularnewline
8 & -0.066351 & -0.6081 & 0.272375 \tabularnewline
9 & 0.121218 & 1.111 & 0.134872 \tabularnewline
10 & -0.012152 & -0.1114 & 0.455793 \tabularnewline
11 & -0.17705 & -1.6227 & 0.054201 \tabularnewline
12 & 0.544457 & 4.99 & 2e-06 \tabularnewline
13 & -0.256439 & -2.3503 & 0.010551 \tabularnewline
14 & -0.095056 & -0.8712 & 0.193064 \tabularnewline
15 & -0.139864 & -1.2819 & 0.101707 \tabularnewline
16 & -0.091229 & -0.8361 & 0.202728 \tabularnewline
17 & -0.118858 & -1.0894 & 0.139557 \tabularnewline
18 & 0.149297 & 1.3683 & 0.087429 \tabularnewline
19 & -0.059708 & -0.5472 & 0.292834 \tabularnewline
20 & 0.143683 & 1.3169 & 0.095731 \tabularnewline
21 & -0.070674 & -0.6477 & 0.259461 \tabularnewline
22 & -0.131629 & -1.2064 & 0.115525 \tabularnewline
23 & -0.012508 & -0.1146 & 0.454503 \tabularnewline
24 & -0.011509 & -0.1055 & 0.458124 \tabularnewline
25 & 0.009239 & 0.0847 & 0.466361 \tabularnewline
26 & 0.035799 & 0.3281 & 0.371824 \tabularnewline
27 & -0.031242 & -0.2863 & 0.387664 \tabularnewline
28 & 0.161191 & 1.4773 & 0.071662 \tabularnewline
29 & 0.077221 & 0.7077 & 0.240532 \tabularnewline
30 & -0.074539 & -0.6832 & 0.248192 \tabularnewline
31 & 0.062826 & 0.5758 & 0.283142 \tabularnewline
32 & -0.078306 & -0.7177 & 0.237472 \tabularnewline
33 & 0.006163 & 0.0565 & 0.477544 \tabularnewline
34 & -0.013416 & -0.123 & 0.451217 \tabularnewline
35 & 0.05216 & 0.4781 & 0.316926 \tabularnewline
36 & 0.028785 & 0.2638 & 0.396284 \tabularnewline
37 & -0.077621 & -0.7114 & 0.2394 \tabularnewline
38 & -0.068435 & -0.6272 & 0.266108 \tabularnewline
39 & 0.03892 & 0.3567 & 0.361103 \tabularnewline
40 & -0.081025 & -0.7426 & 0.229897 \tabularnewline
41 & -0.023522 & -0.2156 & 0.414919 \tabularnewline
42 & 0.08414 & 0.7712 & 0.221388 \tabularnewline
43 & 0.123129 & 1.1285 & 0.131161 \tabularnewline
44 & 0.006768 & 0.062 & 0.475342 \tabularnewline
45 & 0.013291 & 0.1218 & 0.451667 \tabularnewline
46 & 0.108303 & 0.9926 & 0.161874 \tabularnewline
47 & -0.083123 & -0.7618 & 0.224146 \tabularnewline
48 & -0.009694 & -0.0888 & 0.464708 \tabularnewline
49 & 0.028193 & 0.2584 & 0.398367 \tabularnewline
50 & 0.013287 & 0.1218 & 0.451683 \tabularnewline
51 & -0.058259 & -0.5339 & 0.297394 \tabularnewline
52 & -0.068205 & -0.6251 & 0.266797 \tabularnewline
53 & -0.096644 & -0.8858 & 0.189137 \tabularnewline
54 & -0.106546 & -0.9765 & 0.165807 \tabularnewline
55 & -0.059861 & -0.5486 & 0.292355 \tabularnewline
56 & -0.080891 & -0.7414 & 0.230266 \tabularnewline
57 & 0.016864 & 0.1546 & 0.43877 \tabularnewline
58 & -0.02885 & -0.2644 & 0.396053 \tabularnewline
59 & 0.007891 & 0.0723 & 0.471259 \tabularnewline
60 & -0.124225 & -1.1385 & 0.129066 \tabularnewline
\hline
\end{tabular}
%Source: https://freestatistics.org/blog/index.php?pk=224699&T=2

[TABLE]
[ROW][C]Partial Autocorrelation Function[/C][/ROW]
[ROW][C]Time lag k[/C][C]PACF(k)[/C][C]T-STAT[/C][C]P-value[/C][/ROW]
[ROW][C]1[/C][C]0.035383[/C][C]0.3243[/C][C]0.373263[/C][/ROW]
[ROW][C]2[/C][C]0.13623[/C][C]1.2486[/C][C]0.107645[/C][/ROW]
[ROW][C]3[/C][C]0.240425[/C][C]2.2035[/C][C]0.015147[/C][/ROW]
[ROW][C]4[/C][C]0.1605[/C][C]1.471[/C][C]0.072513[/C][/ROW]
[ROW][C]5[/C][C]0.204759[/C][C]1.8766[/C][C]0.032019[/C][/ROW]
[ROW][C]6[/C][C]-0.259291[/C][C]-2.3764[/C][C]0.009877[/C][/ROW]
[ROW][C]7[/C][C]-0.022183[/C][C]-0.2033[/C][C]0.419693[/C][/ROW]
[ROW][C]8[/C][C]-0.066351[/C][C]-0.6081[/C][C]0.272375[/C][/ROW]
[ROW][C]9[/C][C]0.121218[/C][C]1.111[/C][C]0.134872[/C][/ROW]
[ROW][C]10[/C][C]-0.012152[/C][C]-0.1114[/C][C]0.455793[/C][/ROW]
[ROW][C]11[/C][C]-0.17705[/C][C]-1.6227[/C][C]0.054201[/C][/ROW]
[ROW][C]12[/C][C]0.544457[/C][C]4.99[/C][C]2e-06[/C][/ROW]
[ROW][C]13[/C][C]-0.256439[/C][C]-2.3503[/C][C]0.010551[/C][/ROW]
[ROW][C]14[/C][C]-0.095056[/C][C]-0.8712[/C][C]0.193064[/C][/ROW]
[ROW][C]15[/C][C]-0.139864[/C][C]-1.2819[/C][C]0.101707[/C][/ROW]
[ROW][C]16[/C][C]-0.091229[/C][C]-0.8361[/C][C]0.202728[/C][/ROW]
[ROW][C]17[/C][C]-0.118858[/C][C]-1.0894[/C][C]0.139557[/C][/ROW]
[ROW][C]18[/C][C]0.149297[/C][C]1.3683[/C][C]0.087429[/C][/ROW]
[ROW][C]19[/C][C]-0.059708[/C][C]-0.5472[/C][C]0.292834[/C][/ROW]
[ROW][C]20[/C][C]0.143683[/C][C]1.3169[/C][C]0.095731[/C][/ROW]
[ROW][C]21[/C][C]-0.070674[/C][C]-0.6477[/C][C]0.259461[/C][/ROW]
[ROW][C]22[/C][C]-0.131629[/C][C]-1.2064[/C][C]0.115525[/C][/ROW]
[ROW][C]23[/C][C]-0.012508[/C][C]-0.1146[/C][C]0.454503[/C][/ROW]
[ROW][C]24[/C][C]-0.011509[/C][C]-0.1055[/C][C]0.458124[/C][/ROW]
[ROW][C]25[/C][C]0.009239[/C][C]0.0847[/C][C]0.466361[/C][/ROW]
[ROW][C]26[/C][C]0.035799[/C][C]0.3281[/C][C]0.371824[/C][/ROW]
[ROW][C]27[/C][C]-0.031242[/C][C]-0.2863[/C][C]0.387664[/C][/ROW]
[ROW][C]28[/C][C]0.161191[/C][C]1.4773[/C][C]0.071662[/C][/ROW]
[ROW][C]29[/C][C]0.077221[/C][C]0.7077[/C][C]0.240532[/C][/ROW]
[ROW][C]30[/C][C]-0.074539[/C][C]-0.6832[/C][C]0.248192[/C][/ROW]
[ROW][C]31[/C][C]0.062826[/C][C]0.5758[/C][C]0.283142[/C][/ROW]
[ROW][C]32[/C][C]-0.078306[/C][C]-0.7177[/C][C]0.237472[/C][/ROW]
[ROW][C]33[/C][C]0.006163[/C][C]0.0565[/C][C]0.477544[/C][/ROW]
[ROW][C]34[/C][C]-0.013416[/C][C]-0.123[/C][C]0.451217[/C][/ROW]
[ROW][C]35[/C][C]0.05216[/C][C]0.4781[/C][C]0.316926[/C][/ROW]
[ROW][C]36[/C][C]0.028785[/C][C]0.2638[/C][C]0.396284[/C][/ROW]
[ROW][C]37[/C][C]-0.077621[/C][C]-0.7114[/C][C]0.2394[/C][/ROW]
[ROW][C]38[/C][C]-0.068435[/C][C]-0.6272[/C][C]0.266108[/C][/ROW]
[ROW][C]39[/C][C]0.03892[/C][C]0.3567[/C][C]0.361103[/C][/ROW]
[ROW][C]40[/C][C]-0.081025[/C][C]-0.7426[/C][C]0.229897[/C][/ROW]
[ROW][C]41[/C][C]-0.023522[/C][C]-0.2156[/C][C]0.414919[/C][/ROW]
[ROW][C]42[/C][C]0.08414[/C][C]0.7712[/C][C]0.221388[/C][/ROW]
[ROW][C]43[/C][C]0.123129[/C][C]1.1285[/C][C]0.131161[/C][/ROW]
[ROW][C]44[/C][C]0.006768[/C][C]0.062[/C][C]0.475342[/C][/ROW]
[ROW][C]45[/C][C]0.013291[/C][C]0.1218[/C][C]0.451667[/C][/ROW]
[ROW][C]46[/C][C]0.108303[/C][C]0.9926[/C][C]0.161874[/C][/ROW]
[ROW][C]47[/C][C]-0.083123[/C][C]-0.7618[/C][C]0.224146[/C][/ROW]
[ROW][C]48[/C][C]-0.009694[/C][C]-0.0888[/C][C]0.464708[/C][/ROW]
[ROW][C]49[/C][C]0.028193[/C][C]0.2584[/C][C]0.398367[/C][/ROW]
[ROW][C]50[/C][C]0.013287[/C][C]0.1218[/C][C]0.451683[/C][/ROW]
[ROW][C]51[/C][C]-0.058259[/C][C]-0.5339[/C][C]0.297394[/C][/ROW]
[ROW][C]52[/C][C]-0.068205[/C][C]-0.6251[/C][C]0.266797[/C][/ROW]
[ROW][C]53[/C][C]-0.096644[/C][C]-0.8858[/C][C]0.189137[/C][/ROW]
[ROW][C]54[/C][C]-0.106546[/C][C]-0.9765[/C][C]0.165807[/C][/ROW]
[ROW][C]55[/C][C]-0.059861[/C][C]-0.5486[/C][C]0.292355[/C][/ROW]
[ROW][C]56[/C][C]-0.080891[/C][C]-0.7414[/C][C]0.230266[/C][/ROW]
[ROW][C]57[/C][C]0.016864[/C][C]0.1546[/C][C]0.43877[/C][/ROW]
[ROW][C]58[/C][C]-0.02885[/C][C]-0.2644[/C][C]0.396053[/C][/ROW]
[ROW][C]59[/C][C]0.007891[/C][C]0.0723[/C][C]0.471259[/C][/ROW]
[ROW][C]60[/C][C]-0.124225[/C][C]-1.1385[/C][C]0.129066[/C][/ROW]
[/TABLE]
Source: https://freestatistics.org/blog/index.php?pk=224699&T=2

Globally Unique Identifier (entire table): ba.freestatistics.org/blog/index.php?pk=224699&T=2

As an alternative you can also use a QR Code:  

The GUIDs for individual cells are displayed in the table below:

Partial Autocorrelation Function
Time lag kPACF(k)T-STATP-value
10.0353830.32430.373263
20.136231.24860.107645
30.2404252.20350.015147
40.16051.4710.072513
50.2047591.87660.032019
6-0.259291-2.37640.009877
7-0.022183-0.20330.419693
8-0.066351-0.60810.272375
90.1212181.1110.134872
10-0.012152-0.11140.455793
11-0.17705-1.62270.054201
120.5444574.992e-06
13-0.256439-2.35030.010551
14-0.095056-0.87120.193064
15-0.139864-1.28190.101707
16-0.091229-0.83610.202728
17-0.118858-1.08940.139557
180.1492971.36830.087429
19-0.059708-0.54720.292834
200.1436831.31690.095731
21-0.070674-0.64770.259461
22-0.131629-1.20640.115525
23-0.012508-0.11460.454503
24-0.011509-0.10550.458124
250.0092390.08470.466361
260.0357990.32810.371824
27-0.031242-0.28630.387664
280.1611911.47730.071662
290.0772210.70770.240532
30-0.074539-0.68320.248192
310.0628260.57580.283142
32-0.078306-0.71770.237472
330.0061630.05650.477544
34-0.013416-0.1230.451217
350.052160.47810.316926
360.0287850.26380.396284
37-0.077621-0.71140.2394
38-0.068435-0.62720.266108
390.038920.35670.361103
40-0.081025-0.74260.229897
41-0.023522-0.21560.414919
420.084140.77120.221388
430.1231291.12850.131161
440.0067680.0620.475342
450.0132910.12180.451667
460.1083030.99260.161874
47-0.083123-0.76180.224146
48-0.009694-0.08880.464708
490.0281930.25840.398367
500.0132870.12180.451683
51-0.058259-0.53390.297394
52-0.068205-0.62510.266797
53-0.096644-0.88580.189137
54-0.106546-0.97650.165807
55-0.059861-0.54860.292355
56-0.080891-0.74140.230266
570.0168640.15460.43877
58-0.02885-0.26440.396053
590.0078910.07230.471259
60-0.124225-1.13850.129066


Parameters (Session):
par1 = 60 ; par2 = 1 ; par3 = 0 ; par4 = 0 ; par5 = 12 ; par6 = White Noise ; par7 = 0.95 ;
Parameters (R input):
par1 = 60 ; par2 = 1 ; par3 = 0 ; par4 = 0 ; par5 = 12 ; par6 = White Noise ; par7 = 0.95 ; par8 = ;
R code (references can be found in the software module):
if (par1 == 'Default') {
par1 = 10*log10(length(x))
} else {
par1 <- as.numeric(par1)
}
par2 <- as.numeric(par2)
par3 <- as.numeric(par3)
par4 <- as.numeric(par4)
par5 <- as.numeric(par5)
if (par6 == 'White Noise') par6 <- 'white' else par6 <- 'ma'
par7 <- as.numeric(par7)
if (par8 != '') par8 <- as.numeric(par8)
ox <- x
if (par8 == '') {
if (par2 == 0) {
x <- log(x)
} else {
x <- (x ^ par2 - 1) / par2
}
} else {
x <- log(x,base=par8)
}
if (par3 > 0) x <- diff(x,lag=1,difference=par3)
if (par4 > 0) x <- diff(x,lag=par5,difference=par4)
bitmap(file='picts.png')
op <- par(mfrow=c(2,1))
plot(ox,type='l',main='Original Time Series',xlab='time',ylab='value')
if (par8=='') {
mytitle <- paste('Working Time Series (lambda=',par2,', d=',par3,', D=',par4,')',sep='')
mysub <- paste('(lambda=',par2,', d=',par3,', D=',par4,', CI=', par7, ', CI type=',par6,')',sep='')
} else {
mytitle <- paste('Working Time Series (base=',par8,', d=',par3,', D=',par4,')',sep='')
mysub <- paste('(base=',par8,', d=',par3,', D=',par4,', CI=', par7, ', CI type=',par6,')',sep='')
}
plot(x,type='l', main=mytitle,xlab='time',ylab='value')
par(op)
dev.off()
bitmap(file='pic1.png')
racf <- acf(x, par1, main='Autocorrelation', xlab='time lag', ylab='ACF', ci.type=par6, ci=par7, sub=mysub)
dev.off()
bitmap(file='pic2.png')
rpacf <- pacf(x,par1,main='Partial Autocorrelation',xlab='lags',ylab='PACF',sub=mysub)
dev.off()
(myacf <- c(racf$acf))
(mypacf <- c(rpacf$acf))
lengthx <- length(x)
sqrtn <- sqrt(lengthx)
load(file='createtable')
a<-table.start()
a<-table.row.start(a)
a<-table.element(a,'Autocorrelation Function',4,TRUE)
a<-table.row.end(a)
a<-table.row.start(a)
a<-table.element(a,'Time lag k',header=TRUE)
a<-table.element(a,hyperlink('basics.htm','ACF(k)','click here for more information about the Autocorrelation Function'),header=TRUE)
a<-table.element(a,'T-STAT',header=TRUE)
a<-table.element(a,'P-value',header=TRUE)
a<-table.row.end(a)
for (i in 2:(par1+1)) {
a<-table.row.start(a)
a<-table.element(a,i-1,header=TRUE)
a<-table.element(a,round(myacf[i],6))
mytstat <- myacf[i]*sqrtn
a<-table.element(a,round(mytstat,4))
a<-table.element(a,round(1-pt(abs(mytstat),lengthx),6))
a<-table.row.end(a)
}
a<-table.end(a)
table.save(a,file='mytable.tab')
a<-table.start()
a<-table.row.start(a)
a<-table.element(a,'Partial Autocorrelation Function',4,TRUE)
a<-table.row.end(a)
a<-table.row.start(a)
a<-table.element(a,'Time lag k',header=TRUE)
a<-table.element(a,hyperlink('basics.htm','PACF(k)','click here for more information about the Partial Autocorrelation Function'),header=TRUE)
a<-table.element(a,'T-STAT',header=TRUE)
a<-table.element(a,'P-value',header=TRUE)
a<-table.row.end(a)
for (i in 1:par1) {
a<-table.row.start(a)
a<-table.element(a,i,header=TRUE)
a<-table.element(a,round(mypacf[i],6))
mytstat <- mypacf[i]*sqrtn
a<-table.element(a,round(mytstat,4))
a<-table.element(a,round(1-pt(abs(mytstat),lengthx),6))
a<-table.row.end(a)
}
a<-table.end(a)
table.save(a,file='mytable1.tab')