Free Statistics

of Irreproducible Research!

Author's title

Author*Unverified author*
R Software Modulerwasp_autocorrelation.wasp
Title produced by software(Partial) Autocorrelation Function
Date of computationWed, 13 Nov 2013 04:16:53 -0500
Cite this page as followsStatistical Computations at FreeStatistics.org, Office for Research Development and Education, URL https://freestatistics.org/blog/index.php?v=date/2013/Nov/13/t1384334346t2o0f0c6s4nt0yk.htm/, Retrieved Mon, 29 Apr 2024 03:47:59 +0000
Statistical Computations at FreeStatistics.org, Office for Research Development and Education, URL https://freestatistics.org/blog/index.php?pk=224676, Retrieved Mon, 29 Apr 2024 03:47:59 +0000
QR Codes:

Original text written by user:
IsPrivate?No (this computation is public)
User-defined keywords
Estimated Impact48
Family? (F = Feedback message, R = changed R code, M = changed R Module, P = changed Parameters, D = changed Data)
-       [(Partial) Autocorrelation Function] [] [2013-11-13 09:16:53] [a1de13929df8f72ca0bba4a56316571d] [Current]
Feedback Forum

Post a new message
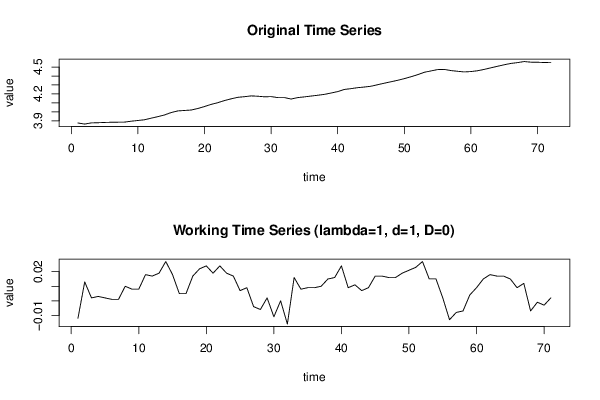
Dataseries X:
3.875
3.863
3.876
3.878
3.881
3.883
3.884
3.885
3.895
3.903
3.911
3.929
3.946
3.965
3.992
4.010
4.015
4.020
4.037
4.059
4.083
4.102
4.126
4.145
4.162
4.169
4.178
4.174
4.168
4.170
4.159
4.159
4.143
4.159
4.167
4.176
4.185
4.195
4.210
4.226
4.250
4.259
4.270
4.277
4.286
4.303
4.320
4.336
4.352
4.371
4.392
4.415
4.442
4.457
4.472
4.474
4.461
4.453
4.446
4.450
4.459
4.474
4.492
4.509
4.526
4.541
4.550
4.562
4.555
4.554
4.551
4.553


Summary of computational transaction
Raw Inputview raw input (R code)
Raw Outputview raw output of R engine
Computing time3 seconds
R Server'Gwilym Jenkins' @ jenkins.wessa.net

\begin{tabular}{lllllllll}
\hline
Summary of computational transaction \tabularnewline
Raw Input & view raw input (R code)  \tabularnewline
Raw Output & view raw output of R engine  \tabularnewline
Computing time & 3 seconds \tabularnewline
R Server & 'Gwilym Jenkins' @ jenkins.wessa.net \tabularnewline
\hline
\end{tabular}
%Source: https://freestatistics.org/blog/index.php?pk=224676&T=0

[TABLE]
[ROW][C]Summary of computational transaction[/C][/ROW]
[ROW][C]Raw Input[/C][C]view raw input (R code) [/C][/ROW]
[ROW][C]Raw Output[/C][C]view raw output of R engine [/C][/ROW]
[ROW][C]Computing time[/C][C]3 seconds[/C][/ROW]
[ROW][C]R Server[/C][C]'Gwilym Jenkins' @ jenkins.wessa.net[/C][/ROW]
[/TABLE]
Source: https://freestatistics.org/blog/index.php?pk=224676&T=0

Globally Unique Identifier (entire table): ba.freestatistics.org/blog/index.php?pk=224676&T=0

As an alternative you can also use a QR Code:  

The GUIDs for individual cells are displayed in the table below:

Summary of computational transaction
Raw Inputview raw input (R code)
Raw Outputview raw output of R engine
Computing time3 seconds
R Server'Gwilym Jenkins' @ jenkins.wessa.net


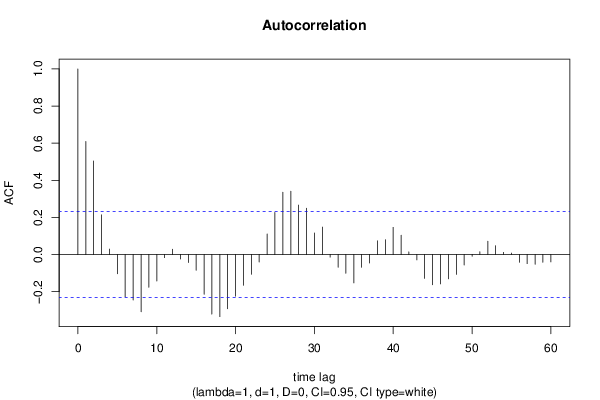
Autocorrelation Function
Time lag kACF(k)T-STATP-value
10.6091725.1331e-06
20.5044674.25073.2e-05
30.2138441.80190.037905
40.0292430.24640.40304
5-0.103414-0.87140.193242
6-0.22769-1.91850.029531
7-0.245111-2.06530.021271
8-0.307871-2.59420.005755
9-0.176035-1.48330.07121
10-0.142393-1.19980.117098
11-0.016705-0.14080.444229
120.0283760.23910.405857
13-0.023936-0.20170.420369
14-0.042846-0.3610.359576
15-0.084979-0.7160.238157
16-0.213512-1.79910.038128
17-0.320787-2.7030.004296
18-0.334516-2.81870.003122
19-0.29191-2.45970.008172
20-0.223986-1.88730.031601
21-0.165289-1.39270.084021
22-0.106089-0.89390.187192
23-0.039976-0.33680.368613
240.110520.93130.177438
250.2264921.90850.030188
260.3360762.83180.003009
270.3408932.87240.002684
280.2665312.24580.013914
290.2495442.10270.019519
300.1158280.9760.166193
310.1480451.24750.108166
32-0.013871-0.11690.453643
33-0.068396-0.57630.283112
34-0.100586-0.84760.199768
35-0.15265-1.28620.101268
36-0.068067-0.57350.284046
37-0.045291-0.38160.351937
380.0738510.62230.267876
390.0801060.6750.250937
400.1465661.2350.110453
410.1039450.87590.192032
420.0143320.12080.452109
43-0.028703-0.24190.404795
44-0.128425-1.08210.141429
45-0.162337-1.36790.087833
46-0.157913-1.33060.093789
47-0.130838-1.10250.136992
48-0.10659-0.89810.186073
49-0.056051-0.47230.319081
50-0.00898-0.07570.469948
510.0152610.12860.449023
520.072020.60690.272942
530.0477820.40260.34422
540.0117250.09880.460788
550.0078190.06590.473829
56-0.041327-0.34820.364349
57-0.048866-0.41180.340881
58-0.052064-0.43870.331106
59-0.041252-0.34760.364585
60-0.039448-0.33240.370286

\begin{tabular}{lllllllll}
\hline
Autocorrelation Function \tabularnewline
Time lag k & ACF(k) & T-STAT & P-value \tabularnewline
1 & 0.609172 & 5.133 & 1e-06 \tabularnewline
2 & 0.504467 & 4.2507 & 3.2e-05 \tabularnewline
3 & 0.213844 & 1.8019 & 0.037905 \tabularnewline
4 & 0.029243 & 0.2464 & 0.40304 \tabularnewline
5 & -0.103414 & -0.8714 & 0.193242 \tabularnewline
6 & -0.22769 & -1.9185 & 0.029531 \tabularnewline
7 & -0.245111 & -2.0653 & 0.021271 \tabularnewline
8 & -0.307871 & -2.5942 & 0.005755 \tabularnewline
9 & -0.176035 & -1.4833 & 0.07121 \tabularnewline
10 & -0.142393 & -1.1998 & 0.117098 \tabularnewline
11 & -0.016705 & -0.1408 & 0.444229 \tabularnewline
12 & 0.028376 & 0.2391 & 0.405857 \tabularnewline
13 & -0.023936 & -0.2017 & 0.420369 \tabularnewline
14 & -0.042846 & -0.361 & 0.359576 \tabularnewline
15 & -0.084979 & -0.716 & 0.238157 \tabularnewline
16 & -0.213512 & -1.7991 & 0.038128 \tabularnewline
17 & -0.320787 & -2.703 & 0.004296 \tabularnewline
18 & -0.334516 & -2.8187 & 0.003122 \tabularnewline
19 & -0.29191 & -2.4597 & 0.008172 \tabularnewline
20 & -0.223986 & -1.8873 & 0.031601 \tabularnewline
21 & -0.165289 & -1.3927 & 0.084021 \tabularnewline
22 & -0.106089 & -0.8939 & 0.187192 \tabularnewline
23 & -0.039976 & -0.3368 & 0.368613 \tabularnewline
24 & 0.11052 & 0.9313 & 0.177438 \tabularnewline
25 & 0.226492 & 1.9085 & 0.030188 \tabularnewline
26 & 0.336076 & 2.8318 & 0.003009 \tabularnewline
27 & 0.340893 & 2.8724 & 0.002684 \tabularnewline
28 & 0.266531 & 2.2458 & 0.013914 \tabularnewline
29 & 0.249544 & 2.1027 & 0.019519 \tabularnewline
30 & 0.115828 & 0.976 & 0.166193 \tabularnewline
31 & 0.148045 & 1.2475 & 0.108166 \tabularnewline
32 & -0.013871 & -0.1169 & 0.453643 \tabularnewline
33 & -0.068396 & -0.5763 & 0.283112 \tabularnewline
34 & -0.100586 & -0.8476 & 0.199768 \tabularnewline
35 & -0.15265 & -1.2862 & 0.101268 \tabularnewline
36 & -0.068067 & -0.5735 & 0.284046 \tabularnewline
37 & -0.045291 & -0.3816 & 0.351937 \tabularnewline
38 & 0.073851 & 0.6223 & 0.267876 \tabularnewline
39 & 0.080106 & 0.675 & 0.250937 \tabularnewline
40 & 0.146566 & 1.235 & 0.110453 \tabularnewline
41 & 0.103945 & 0.8759 & 0.192032 \tabularnewline
42 & 0.014332 & 0.1208 & 0.452109 \tabularnewline
43 & -0.028703 & -0.2419 & 0.404795 \tabularnewline
44 & -0.128425 & -1.0821 & 0.141429 \tabularnewline
45 & -0.162337 & -1.3679 & 0.087833 \tabularnewline
46 & -0.157913 & -1.3306 & 0.093789 \tabularnewline
47 & -0.130838 & -1.1025 & 0.136992 \tabularnewline
48 & -0.10659 & -0.8981 & 0.186073 \tabularnewline
49 & -0.056051 & -0.4723 & 0.319081 \tabularnewline
50 & -0.00898 & -0.0757 & 0.469948 \tabularnewline
51 & 0.015261 & 0.1286 & 0.449023 \tabularnewline
52 & 0.07202 & 0.6069 & 0.272942 \tabularnewline
53 & 0.047782 & 0.4026 & 0.34422 \tabularnewline
54 & 0.011725 & 0.0988 & 0.460788 \tabularnewline
55 & 0.007819 & 0.0659 & 0.473829 \tabularnewline
56 & -0.041327 & -0.3482 & 0.364349 \tabularnewline
57 & -0.048866 & -0.4118 & 0.340881 \tabularnewline
58 & -0.052064 & -0.4387 & 0.331106 \tabularnewline
59 & -0.041252 & -0.3476 & 0.364585 \tabularnewline
60 & -0.039448 & -0.3324 & 0.370286 \tabularnewline
\hline
\end{tabular}
%Source: https://freestatistics.org/blog/index.php?pk=224676&T=1

[TABLE]
[ROW][C]Autocorrelation Function[/C][/ROW]
[ROW][C]Time lag k[/C][C]ACF(k)[/C][C]T-STAT[/C][C]P-value[/C][/ROW]
[ROW][C]1[/C][C]0.609172[/C][C]5.133[/C][C]1e-06[/C][/ROW]
[ROW][C]2[/C][C]0.504467[/C][C]4.2507[/C][C]3.2e-05[/C][/ROW]
[ROW][C]3[/C][C]0.213844[/C][C]1.8019[/C][C]0.037905[/C][/ROW]
[ROW][C]4[/C][C]0.029243[/C][C]0.2464[/C][C]0.40304[/C][/ROW]
[ROW][C]5[/C][C]-0.103414[/C][C]-0.8714[/C][C]0.193242[/C][/ROW]
[ROW][C]6[/C][C]-0.22769[/C][C]-1.9185[/C][C]0.029531[/C][/ROW]
[ROW][C]7[/C][C]-0.245111[/C][C]-2.0653[/C][C]0.021271[/C][/ROW]
[ROW][C]8[/C][C]-0.307871[/C][C]-2.5942[/C][C]0.005755[/C][/ROW]
[ROW][C]9[/C][C]-0.176035[/C][C]-1.4833[/C][C]0.07121[/C][/ROW]
[ROW][C]10[/C][C]-0.142393[/C][C]-1.1998[/C][C]0.117098[/C][/ROW]
[ROW][C]11[/C][C]-0.016705[/C][C]-0.1408[/C][C]0.444229[/C][/ROW]
[ROW][C]12[/C][C]0.028376[/C][C]0.2391[/C][C]0.405857[/C][/ROW]
[ROW][C]13[/C][C]-0.023936[/C][C]-0.2017[/C][C]0.420369[/C][/ROW]
[ROW][C]14[/C][C]-0.042846[/C][C]-0.361[/C][C]0.359576[/C][/ROW]
[ROW][C]15[/C][C]-0.084979[/C][C]-0.716[/C][C]0.238157[/C][/ROW]
[ROW][C]16[/C][C]-0.213512[/C][C]-1.7991[/C][C]0.038128[/C][/ROW]
[ROW][C]17[/C][C]-0.320787[/C][C]-2.703[/C][C]0.004296[/C][/ROW]
[ROW][C]18[/C][C]-0.334516[/C][C]-2.8187[/C][C]0.003122[/C][/ROW]
[ROW][C]19[/C][C]-0.29191[/C][C]-2.4597[/C][C]0.008172[/C][/ROW]
[ROW][C]20[/C][C]-0.223986[/C][C]-1.8873[/C][C]0.031601[/C][/ROW]
[ROW][C]21[/C][C]-0.165289[/C][C]-1.3927[/C][C]0.084021[/C][/ROW]
[ROW][C]22[/C][C]-0.106089[/C][C]-0.8939[/C][C]0.187192[/C][/ROW]
[ROW][C]23[/C][C]-0.039976[/C][C]-0.3368[/C][C]0.368613[/C][/ROW]
[ROW][C]24[/C][C]0.11052[/C][C]0.9313[/C][C]0.177438[/C][/ROW]
[ROW][C]25[/C][C]0.226492[/C][C]1.9085[/C][C]0.030188[/C][/ROW]
[ROW][C]26[/C][C]0.336076[/C][C]2.8318[/C][C]0.003009[/C][/ROW]
[ROW][C]27[/C][C]0.340893[/C][C]2.8724[/C][C]0.002684[/C][/ROW]
[ROW][C]28[/C][C]0.266531[/C][C]2.2458[/C][C]0.013914[/C][/ROW]
[ROW][C]29[/C][C]0.249544[/C][C]2.1027[/C][C]0.019519[/C][/ROW]
[ROW][C]30[/C][C]0.115828[/C][C]0.976[/C][C]0.166193[/C][/ROW]
[ROW][C]31[/C][C]0.148045[/C][C]1.2475[/C][C]0.108166[/C][/ROW]
[ROW][C]32[/C][C]-0.013871[/C][C]-0.1169[/C][C]0.453643[/C][/ROW]
[ROW][C]33[/C][C]-0.068396[/C][C]-0.5763[/C][C]0.283112[/C][/ROW]
[ROW][C]34[/C][C]-0.100586[/C][C]-0.8476[/C][C]0.199768[/C][/ROW]
[ROW][C]35[/C][C]-0.15265[/C][C]-1.2862[/C][C]0.101268[/C][/ROW]
[ROW][C]36[/C][C]-0.068067[/C][C]-0.5735[/C][C]0.284046[/C][/ROW]
[ROW][C]37[/C][C]-0.045291[/C][C]-0.3816[/C][C]0.351937[/C][/ROW]
[ROW][C]38[/C][C]0.073851[/C][C]0.6223[/C][C]0.267876[/C][/ROW]
[ROW][C]39[/C][C]0.080106[/C][C]0.675[/C][C]0.250937[/C][/ROW]
[ROW][C]40[/C][C]0.146566[/C][C]1.235[/C][C]0.110453[/C][/ROW]
[ROW][C]41[/C][C]0.103945[/C][C]0.8759[/C][C]0.192032[/C][/ROW]
[ROW][C]42[/C][C]0.014332[/C][C]0.1208[/C][C]0.452109[/C][/ROW]
[ROW][C]43[/C][C]-0.028703[/C][C]-0.2419[/C][C]0.404795[/C][/ROW]
[ROW][C]44[/C][C]-0.128425[/C][C]-1.0821[/C][C]0.141429[/C][/ROW]
[ROW][C]45[/C][C]-0.162337[/C][C]-1.3679[/C][C]0.087833[/C][/ROW]
[ROW][C]46[/C][C]-0.157913[/C][C]-1.3306[/C][C]0.093789[/C][/ROW]
[ROW][C]47[/C][C]-0.130838[/C][C]-1.1025[/C][C]0.136992[/C][/ROW]
[ROW][C]48[/C][C]-0.10659[/C][C]-0.8981[/C][C]0.186073[/C][/ROW]
[ROW][C]49[/C][C]-0.056051[/C][C]-0.4723[/C][C]0.319081[/C][/ROW]
[ROW][C]50[/C][C]-0.00898[/C][C]-0.0757[/C][C]0.469948[/C][/ROW]
[ROW][C]51[/C][C]0.015261[/C][C]0.1286[/C][C]0.449023[/C][/ROW]
[ROW][C]52[/C][C]0.07202[/C][C]0.6069[/C][C]0.272942[/C][/ROW]
[ROW][C]53[/C][C]0.047782[/C][C]0.4026[/C][C]0.34422[/C][/ROW]
[ROW][C]54[/C][C]0.011725[/C][C]0.0988[/C][C]0.460788[/C][/ROW]
[ROW][C]55[/C][C]0.007819[/C][C]0.0659[/C][C]0.473829[/C][/ROW]
[ROW][C]56[/C][C]-0.041327[/C][C]-0.3482[/C][C]0.364349[/C][/ROW]
[ROW][C]57[/C][C]-0.048866[/C][C]-0.4118[/C][C]0.340881[/C][/ROW]
[ROW][C]58[/C][C]-0.052064[/C][C]-0.4387[/C][C]0.331106[/C][/ROW]
[ROW][C]59[/C][C]-0.041252[/C][C]-0.3476[/C][C]0.364585[/C][/ROW]
[ROW][C]60[/C][C]-0.039448[/C][C]-0.3324[/C][C]0.370286[/C][/ROW]
[/TABLE]
Source: https://freestatistics.org/blog/index.php?pk=224676&T=1

Globally Unique Identifier (entire table): ba.freestatistics.org/blog/index.php?pk=224676&T=1

As an alternative you can also use a QR Code:  

The GUIDs for individual cells are displayed in the table below:

Autocorrelation Function
Time lag kACF(k)T-STATP-value
10.6091725.1331e-06
20.5044674.25073.2e-05
30.2138441.80190.037905
40.0292430.24640.40304
5-0.103414-0.87140.193242
6-0.22769-1.91850.029531
7-0.245111-2.06530.021271
8-0.307871-2.59420.005755
9-0.176035-1.48330.07121
10-0.142393-1.19980.117098
11-0.016705-0.14080.444229
120.0283760.23910.405857
13-0.023936-0.20170.420369
14-0.042846-0.3610.359576
15-0.084979-0.7160.238157
16-0.213512-1.79910.038128
17-0.320787-2.7030.004296
18-0.334516-2.81870.003122
19-0.29191-2.45970.008172
20-0.223986-1.88730.031601
21-0.165289-1.39270.084021
22-0.106089-0.89390.187192
23-0.039976-0.33680.368613
240.110520.93130.177438
250.2264921.90850.030188
260.3360762.83180.003009
270.3408932.87240.002684
280.2665312.24580.013914
290.2495442.10270.019519
300.1158280.9760.166193
310.1480451.24750.108166
32-0.013871-0.11690.453643
33-0.068396-0.57630.283112
34-0.100586-0.84760.199768
35-0.15265-1.28620.101268
36-0.068067-0.57350.284046
37-0.045291-0.38160.351937
380.0738510.62230.267876
390.0801060.6750.250937
400.1465661.2350.110453
410.1039450.87590.192032
420.0143320.12080.452109
43-0.028703-0.24190.404795
44-0.128425-1.08210.141429
45-0.162337-1.36790.087833
46-0.157913-1.33060.093789
47-0.130838-1.10250.136992
48-0.10659-0.89810.186073
49-0.056051-0.47230.319081
50-0.00898-0.07570.469948
510.0152610.12860.449023
520.072020.60690.272942
530.0477820.40260.34422
540.0117250.09880.460788
550.0078190.06590.473829
56-0.041327-0.34820.364349
57-0.048866-0.41180.340881
58-0.052064-0.43870.331106
59-0.041252-0.34760.364585
60-0.039448-0.33240.370286


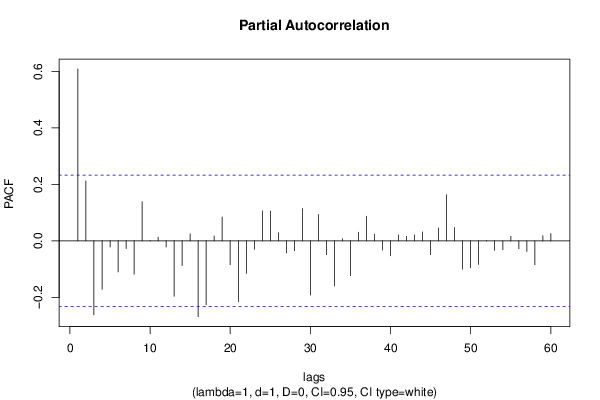
Partial Autocorrelation Function
Time lag kPACF(k)T-STATP-value
10.6091725.1331e-06
20.2120761.7870.039104
3-0.262197-2.20930.01519
4-0.171702-1.44680.076179
5-0.022025-0.18560.42665
6-0.110022-0.92710.178518
7-0.027166-0.22890.409801
8-0.118009-0.99440.161711
90.13891.17040.122878
10-0.000731-0.00620.497552
110.012660.10670.457674
12-0.022008-0.18540.426704
13-0.196439-1.65520.051147
14-0.08762-0.73830.231382
150.0247320.20840.417758
16-0.268618-2.26340.013334
17-0.226745-1.91060.030048
180.0170540.14370.443071
190.0840640.70830.240527
20-0.084879-0.71520.238414
21-0.21481-1.810.037262
22-0.115233-0.9710.167429
23-0.029967-0.25250.40069
240.1061410.89440.187075
250.1053840.8880.188774
260.0287320.24210.404701
27-0.042659-0.35950.360162
28-0.035394-0.29820.383198
290.1145260.9650.168906
30-0.191844-1.61650.05521
310.0933830.78690.216992
32-0.04886-0.41170.3409
33-0.159718-1.34580.091324
340.0076340.06430.474448
35-0.123299-1.03890.151179
360.0305540.25750.398788
370.0870330.73340.232878
380.0231630.19520.422906
39-0.032745-0.27590.391709
40-0.052618-0.44340.329425
410.0209930.17690.430049
420.0160180.1350.446508
430.0209730.17670.430115
440.0312950.26370.396388
45-0.048773-0.4110.341166
460.0452740.38150.351991
470.1631231.37450.086805
480.0470970.39680.346337
49-0.100148-0.84390.200791
50-0.095553-0.80510.211712
51-0.084126-0.70890.240367
52-0.000614-0.00520.497942
53-0.033172-0.27950.390333
54-0.031128-0.26230.39693
550.0163040.13740.445559
56-0.02792-0.23530.407343
57-0.037424-0.31530.376713
58-0.084663-0.71340.238974
590.0179690.15140.440041
600.025720.21670.414522

\begin{tabular}{lllllllll}
\hline
Partial Autocorrelation Function \tabularnewline
Time lag k & PACF(k) & T-STAT & P-value \tabularnewline
1 & 0.609172 & 5.133 & 1e-06 \tabularnewline
2 & 0.212076 & 1.787 & 0.039104 \tabularnewline
3 & -0.262197 & -2.2093 & 0.01519 \tabularnewline
4 & -0.171702 & -1.4468 & 0.076179 \tabularnewline
5 & -0.022025 & -0.1856 & 0.42665 \tabularnewline
6 & -0.110022 & -0.9271 & 0.178518 \tabularnewline
7 & -0.027166 & -0.2289 & 0.409801 \tabularnewline
8 & -0.118009 & -0.9944 & 0.161711 \tabularnewline
9 & 0.1389 & 1.1704 & 0.122878 \tabularnewline
10 & -0.000731 & -0.0062 & 0.497552 \tabularnewline
11 & 0.01266 & 0.1067 & 0.457674 \tabularnewline
12 & -0.022008 & -0.1854 & 0.426704 \tabularnewline
13 & -0.196439 & -1.6552 & 0.051147 \tabularnewline
14 & -0.08762 & -0.7383 & 0.231382 \tabularnewline
15 & 0.024732 & 0.2084 & 0.417758 \tabularnewline
16 & -0.268618 & -2.2634 & 0.013334 \tabularnewline
17 & -0.226745 & -1.9106 & 0.030048 \tabularnewline
18 & 0.017054 & 0.1437 & 0.443071 \tabularnewline
19 & 0.084064 & 0.7083 & 0.240527 \tabularnewline
20 & -0.084879 & -0.7152 & 0.238414 \tabularnewline
21 & -0.21481 & -1.81 & 0.037262 \tabularnewline
22 & -0.115233 & -0.971 & 0.167429 \tabularnewline
23 & -0.029967 & -0.2525 & 0.40069 \tabularnewline
24 & 0.106141 & 0.8944 & 0.187075 \tabularnewline
25 & 0.105384 & 0.888 & 0.188774 \tabularnewline
26 & 0.028732 & 0.2421 & 0.404701 \tabularnewline
27 & -0.042659 & -0.3595 & 0.360162 \tabularnewline
28 & -0.035394 & -0.2982 & 0.383198 \tabularnewline
29 & 0.114526 & 0.965 & 0.168906 \tabularnewline
30 & -0.191844 & -1.6165 & 0.05521 \tabularnewline
31 & 0.093383 & 0.7869 & 0.216992 \tabularnewline
32 & -0.04886 & -0.4117 & 0.3409 \tabularnewline
33 & -0.159718 & -1.3458 & 0.091324 \tabularnewline
34 & 0.007634 & 0.0643 & 0.474448 \tabularnewline
35 & -0.123299 & -1.0389 & 0.151179 \tabularnewline
36 & 0.030554 & 0.2575 & 0.398788 \tabularnewline
37 & 0.087033 & 0.7334 & 0.232878 \tabularnewline
38 & 0.023163 & 0.1952 & 0.422906 \tabularnewline
39 & -0.032745 & -0.2759 & 0.391709 \tabularnewline
40 & -0.052618 & -0.4434 & 0.329425 \tabularnewline
41 & 0.020993 & 0.1769 & 0.430049 \tabularnewline
42 & 0.016018 & 0.135 & 0.446508 \tabularnewline
43 & 0.020973 & 0.1767 & 0.430115 \tabularnewline
44 & 0.031295 & 0.2637 & 0.396388 \tabularnewline
45 & -0.048773 & -0.411 & 0.341166 \tabularnewline
46 & 0.045274 & 0.3815 & 0.351991 \tabularnewline
47 & 0.163123 & 1.3745 & 0.086805 \tabularnewline
48 & 0.047097 & 0.3968 & 0.346337 \tabularnewline
49 & -0.100148 & -0.8439 & 0.200791 \tabularnewline
50 & -0.095553 & -0.8051 & 0.211712 \tabularnewline
51 & -0.084126 & -0.7089 & 0.240367 \tabularnewline
52 & -0.000614 & -0.0052 & 0.497942 \tabularnewline
53 & -0.033172 & -0.2795 & 0.390333 \tabularnewline
54 & -0.031128 & -0.2623 & 0.39693 \tabularnewline
55 & 0.016304 & 0.1374 & 0.445559 \tabularnewline
56 & -0.02792 & -0.2353 & 0.407343 \tabularnewline
57 & -0.037424 & -0.3153 & 0.376713 \tabularnewline
58 & -0.084663 & -0.7134 & 0.238974 \tabularnewline
59 & 0.017969 & 0.1514 & 0.440041 \tabularnewline
60 & 0.02572 & 0.2167 & 0.414522 \tabularnewline
\hline
\end{tabular}
%Source: https://freestatistics.org/blog/index.php?pk=224676&T=2

[TABLE]
[ROW][C]Partial Autocorrelation Function[/C][/ROW]
[ROW][C]Time lag k[/C][C]PACF(k)[/C][C]T-STAT[/C][C]P-value[/C][/ROW]
[ROW][C]1[/C][C]0.609172[/C][C]5.133[/C][C]1e-06[/C][/ROW]
[ROW][C]2[/C][C]0.212076[/C][C]1.787[/C][C]0.039104[/C][/ROW]
[ROW][C]3[/C][C]-0.262197[/C][C]-2.2093[/C][C]0.01519[/C][/ROW]
[ROW][C]4[/C][C]-0.171702[/C][C]-1.4468[/C][C]0.076179[/C][/ROW]
[ROW][C]5[/C][C]-0.022025[/C][C]-0.1856[/C][C]0.42665[/C][/ROW]
[ROW][C]6[/C][C]-0.110022[/C][C]-0.9271[/C][C]0.178518[/C][/ROW]
[ROW][C]7[/C][C]-0.027166[/C][C]-0.2289[/C][C]0.409801[/C][/ROW]
[ROW][C]8[/C][C]-0.118009[/C][C]-0.9944[/C][C]0.161711[/C][/ROW]
[ROW][C]9[/C][C]0.1389[/C][C]1.1704[/C][C]0.122878[/C][/ROW]
[ROW][C]10[/C][C]-0.000731[/C][C]-0.0062[/C][C]0.497552[/C][/ROW]
[ROW][C]11[/C][C]0.01266[/C][C]0.1067[/C][C]0.457674[/C][/ROW]
[ROW][C]12[/C][C]-0.022008[/C][C]-0.1854[/C][C]0.426704[/C][/ROW]
[ROW][C]13[/C][C]-0.196439[/C][C]-1.6552[/C][C]0.051147[/C][/ROW]
[ROW][C]14[/C][C]-0.08762[/C][C]-0.7383[/C][C]0.231382[/C][/ROW]
[ROW][C]15[/C][C]0.024732[/C][C]0.2084[/C][C]0.417758[/C][/ROW]
[ROW][C]16[/C][C]-0.268618[/C][C]-2.2634[/C][C]0.013334[/C][/ROW]
[ROW][C]17[/C][C]-0.226745[/C][C]-1.9106[/C][C]0.030048[/C][/ROW]
[ROW][C]18[/C][C]0.017054[/C][C]0.1437[/C][C]0.443071[/C][/ROW]
[ROW][C]19[/C][C]0.084064[/C][C]0.7083[/C][C]0.240527[/C][/ROW]
[ROW][C]20[/C][C]-0.084879[/C][C]-0.7152[/C][C]0.238414[/C][/ROW]
[ROW][C]21[/C][C]-0.21481[/C][C]-1.81[/C][C]0.037262[/C][/ROW]
[ROW][C]22[/C][C]-0.115233[/C][C]-0.971[/C][C]0.167429[/C][/ROW]
[ROW][C]23[/C][C]-0.029967[/C][C]-0.2525[/C][C]0.40069[/C][/ROW]
[ROW][C]24[/C][C]0.106141[/C][C]0.8944[/C][C]0.187075[/C][/ROW]
[ROW][C]25[/C][C]0.105384[/C][C]0.888[/C][C]0.188774[/C][/ROW]
[ROW][C]26[/C][C]0.028732[/C][C]0.2421[/C][C]0.404701[/C][/ROW]
[ROW][C]27[/C][C]-0.042659[/C][C]-0.3595[/C][C]0.360162[/C][/ROW]
[ROW][C]28[/C][C]-0.035394[/C][C]-0.2982[/C][C]0.383198[/C][/ROW]
[ROW][C]29[/C][C]0.114526[/C][C]0.965[/C][C]0.168906[/C][/ROW]
[ROW][C]30[/C][C]-0.191844[/C][C]-1.6165[/C][C]0.05521[/C][/ROW]
[ROW][C]31[/C][C]0.093383[/C][C]0.7869[/C][C]0.216992[/C][/ROW]
[ROW][C]32[/C][C]-0.04886[/C][C]-0.4117[/C][C]0.3409[/C][/ROW]
[ROW][C]33[/C][C]-0.159718[/C][C]-1.3458[/C][C]0.091324[/C][/ROW]
[ROW][C]34[/C][C]0.007634[/C][C]0.0643[/C][C]0.474448[/C][/ROW]
[ROW][C]35[/C][C]-0.123299[/C][C]-1.0389[/C][C]0.151179[/C][/ROW]
[ROW][C]36[/C][C]0.030554[/C][C]0.2575[/C][C]0.398788[/C][/ROW]
[ROW][C]37[/C][C]0.087033[/C][C]0.7334[/C][C]0.232878[/C][/ROW]
[ROW][C]38[/C][C]0.023163[/C][C]0.1952[/C][C]0.422906[/C][/ROW]
[ROW][C]39[/C][C]-0.032745[/C][C]-0.2759[/C][C]0.391709[/C][/ROW]
[ROW][C]40[/C][C]-0.052618[/C][C]-0.4434[/C][C]0.329425[/C][/ROW]
[ROW][C]41[/C][C]0.020993[/C][C]0.1769[/C][C]0.430049[/C][/ROW]
[ROW][C]42[/C][C]0.016018[/C][C]0.135[/C][C]0.446508[/C][/ROW]
[ROW][C]43[/C][C]0.020973[/C][C]0.1767[/C][C]0.430115[/C][/ROW]
[ROW][C]44[/C][C]0.031295[/C][C]0.2637[/C][C]0.396388[/C][/ROW]
[ROW][C]45[/C][C]-0.048773[/C][C]-0.411[/C][C]0.341166[/C][/ROW]
[ROW][C]46[/C][C]0.045274[/C][C]0.3815[/C][C]0.351991[/C][/ROW]
[ROW][C]47[/C][C]0.163123[/C][C]1.3745[/C][C]0.086805[/C][/ROW]
[ROW][C]48[/C][C]0.047097[/C][C]0.3968[/C][C]0.346337[/C][/ROW]
[ROW][C]49[/C][C]-0.100148[/C][C]-0.8439[/C][C]0.200791[/C][/ROW]
[ROW][C]50[/C][C]-0.095553[/C][C]-0.8051[/C][C]0.211712[/C][/ROW]
[ROW][C]51[/C][C]-0.084126[/C][C]-0.7089[/C][C]0.240367[/C][/ROW]
[ROW][C]52[/C][C]-0.000614[/C][C]-0.0052[/C][C]0.497942[/C][/ROW]
[ROW][C]53[/C][C]-0.033172[/C][C]-0.2795[/C][C]0.390333[/C][/ROW]
[ROW][C]54[/C][C]-0.031128[/C][C]-0.2623[/C][C]0.39693[/C][/ROW]
[ROW][C]55[/C][C]0.016304[/C][C]0.1374[/C][C]0.445559[/C][/ROW]
[ROW][C]56[/C][C]-0.02792[/C][C]-0.2353[/C][C]0.407343[/C][/ROW]
[ROW][C]57[/C][C]-0.037424[/C][C]-0.3153[/C][C]0.376713[/C][/ROW]
[ROW][C]58[/C][C]-0.084663[/C][C]-0.7134[/C][C]0.238974[/C][/ROW]
[ROW][C]59[/C][C]0.017969[/C][C]0.1514[/C][C]0.440041[/C][/ROW]
[ROW][C]60[/C][C]0.02572[/C][C]0.2167[/C][C]0.414522[/C][/ROW]
[/TABLE]
Source: https://freestatistics.org/blog/index.php?pk=224676&T=2

Globally Unique Identifier (entire table): ba.freestatistics.org/blog/index.php?pk=224676&T=2

As an alternative you can also use a QR Code:  

The GUIDs for individual cells are displayed in the table below:

Partial Autocorrelation Function
Time lag kPACF(k)T-STATP-value
10.6091725.1331e-06
20.2120761.7870.039104
3-0.262197-2.20930.01519
4-0.171702-1.44680.076179
5-0.022025-0.18560.42665
6-0.110022-0.92710.178518
7-0.027166-0.22890.409801
8-0.118009-0.99440.161711
90.13891.17040.122878
10-0.000731-0.00620.497552
110.012660.10670.457674
12-0.022008-0.18540.426704
13-0.196439-1.65520.051147
14-0.08762-0.73830.231382
150.0247320.20840.417758
16-0.268618-2.26340.013334
17-0.226745-1.91060.030048
180.0170540.14370.443071
190.0840640.70830.240527
20-0.084879-0.71520.238414
21-0.21481-1.810.037262
22-0.115233-0.9710.167429
23-0.029967-0.25250.40069
240.1061410.89440.187075
250.1053840.8880.188774
260.0287320.24210.404701
27-0.042659-0.35950.360162
28-0.035394-0.29820.383198
290.1145260.9650.168906
30-0.191844-1.61650.05521
310.0933830.78690.216992
32-0.04886-0.41170.3409
33-0.159718-1.34580.091324
340.0076340.06430.474448
35-0.123299-1.03890.151179
360.0305540.25750.398788
370.0870330.73340.232878
380.0231630.19520.422906
39-0.032745-0.27590.391709
40-0.052618-0.44340.329425
410.0209930.17690.430049
420.0160180.1350.446508
430.0209730.17670.430115
440.0312950.26370.396388
45-0.048773-0.4110.341166
460.0452740.38150.351991
470.1631231.37450.086805
480.0470970.39680.346337
49-0.100148-0.84390.200791
50-0.095553-0.80510.211712
51-0.084126-0.70890.240367
52-0.000614-0.00520.497942
53-0.033172-0.27950.390333
54-0.031128-0.26230.39693
550.0163040.13740.445559
56-0.02792-0.23530.407343
57-0.037424-0.31530.376713
58-0.084663-0.71340.238974
590.0179690.15140.440041
600.025720.21670.414522


Parameters (Session):
par1 = 60 ; par2 = 1 ; par3 = 1 ; par4 = 0 ; par5 = 12 ; par6 = White Noise ; par7 = 0.95 ;
Parameters (R input):
par1 = 60 ; par2 = 1 ; par3 = 1 ; par4 = 0 ; par5 = 12 ; par6 = White Noise ; par7 = 0.95 ; par8 = ;
R code (references can be found in the software module):
if (par1 == 'Default') {
par1 = 10*log10(length(x))
} else {
par1 <- as.numeric(par1)
}
par2 <- as.numeric(par2)
par3 <- as.numeric(par3)
par4 <- as.numeric(par4)
par5 <- as.numeric(par5)
if (par6 == 'White Noise') par6 <- 'white' else par6 <- 'ma'
par7 <- as.numeric(par7)
if (par8 != '') par8 <- as.numeric(par8)
ox <- x
if (par8 == '') {
if (par2 == 0) {
x <- log(x)
} else {
x <- (x ^ par2 - 1) / par2
}
} else {
x <- log(x,base=par8)
}
if (par3 > 0) x <- diff(x,lag=1,difference=par3)
if (par4 > 0) x <- diff(x,lag=par5,difference=par4)
bitmap(file='picts.png')
op <- par(mfrow=c(2,1))
plot(ox,type='l',main='Original Time Series',xlab='time',ylab='value')
if (par8=='') {
mytitle <- paste('Working Time Series (lambda=',par2,', d=',par3,', D=',par4,')',sep='')
mysub <- paste('(lambda=',par2,', d=',par3,', D=',par4,', CI=', par7, ', CI type=',par6,')',sep='')
} else {
mytitle <- paste('Working Time Series (base=',par8,', d=',par3,', D=',par4,')',sep='')
mysub <- paste('(base=',par8,', d=',par3,', D=',par4,', CI=', par7, ', CI type=',par6,')',sep='')
}
plot(x,type='l', main=mytitle,xlab='time',ylab='value')
par(op)
dev.off()
bitmap(file='pic1.png')
racf <- acf(x, par1, main='Autocorrelation', xlab='time lag', ylab='ACF', ci.type=par6, ci=par7, sub=mysub)
dev.off()
bitmap(file='pic2.png')
rpacf <- pacf(x,par1,main='Partial Autocorrelation',xlab='lags',ylab='PACF',sub=mysub)
dev.off()
(myacf <- c(racf$acf))
(mypacf <- c(rpacf$acf))
lengthx <- length(x)
sqrtn <- sqrt(lengthx)
load(file='createtable')
a<-table.start()
a<-table.row.start(a)
a<-table.element(a,'Autocorrelation Function',4,TRUE)
a<-table.row.end(a)
a<-table.row.start(a)
a<-table.element(a,'Time lag k',header=TRUE)
a<-table.element(a,hyperlink('basics.htm','ACF(k)','click here for more information about the Autocorrelation Function'),header=TRUE)
a<-table.element(a,'T-STAT',header=TRUE)
a<-table.element(a,'P-value',header=TRUE)
a<-table.row.end(a)
for (i in 2:(par1+1)) {
a<-table.row.start(a)
a<-table.element(a,i-1,header=TRUE)
a<-table.element(a,round(myacf[i],6))
mytstat <- myacf[i]*sqrtn
a<-table.element(a,round(mytstat,4))
a<-table.element(a,round(1-pt(abs(mytstat),lengthx),6))
a<-table.row.end(a)
}
a<-table.end(a)
table.save(a,file='mytable.tab')
a<-table.start()
a<-table.row.start(a)
a<-table.element(a,'Partial Autocorrelation Function',4,TRUE)
a<-table.row.end(a)
a<-table.row.start(a)
a<-table.element(a,'Time lag k',header=TRUE)
a<-table.element(a,hyperlink('basics.htm','PACF(k)','click here for more information about the Partial Autocorrelation Function'),header=TRUE)
a<-table.element(a,'T-STAT',header=TRUE)
a<-table.element(a,'P-value',header=TRUE)
a<-table.row.end(a)
for (i in 1:par1) {
a<-table.row.start(a)
a<-table.element(a,i,header=TRUE)
a<-table.element(a,round(mypacf[i],6))
mytstat <- mypacf[i]*sqrtn
a<-table.element(a,round(mytstat,4))
a<-table.element(a,round(1-pt(abs(mytstat),lengthx),6))
a<-table.row.end(a)
}
a<-table.end(a)
table.save(a,file='mytable1.tab')