Free Statistics

of Irreproducible Research!

Author's title

Author*Unverified author*
R Software Modulerwasp_autocorrelation.wasp
Title produced by software(Partial) Autocorrelation Function
Date of computationWed, 13 Nov 2013 04:16:29 -0500
Cite this page as followsStatistical Computations at FreeStatistics.org, Office for Research Development and Education, URL https://freestatistics.org/blog/index.php?v=date/2013/Nov/13/t1384334270qicsdbmxiy98zo7.htm/, Retrieved Sun, 28 Apr 2024 19:23:21 +0000
Statistical Computations at FreeStatistics.org, Office for Research Development and Education, URL https://freestatistics.org/blog/index.php?pk=224674, Retrieved Sun, 28 Apr 2024 19:23:21 +0000
QR Codes:

Original text written by user:
IsPrivate?No (this computation is public)
User-defined keywords
Estimated Impact68
Family? (F = Feedback message, R = changed R code, M = changed R Module, P = changed Parameters, D = changed Data)
-       [(Partial) Autocorrelation Function] [] [2013-11-13 09:16:29] [a1de13929df8f72ca0bba4a56316571d] [Current]
Feedback Forum

Post a new message
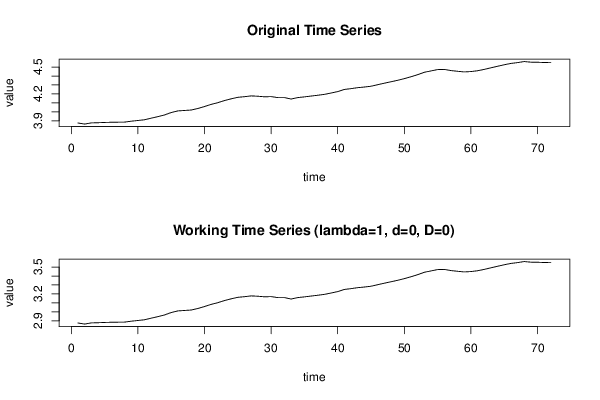
Dataseries X:
3.875
3.863
3.876
3.878
3.881
3.883
3.884
3.885
3.895
3.903
3.911
3.929
3.946
3.965
3.992
4.010
4.015
4.020
4.037
4.059
4.083
4.102
4.126
4.145
4.162
4.169
4.178
4.174
4.168
4.170
4.159
4.159
4.143
4.159
4.167
4.176
4.185
4.195
4.210
4.226
4.250
4.259
4.270
4.277
4.286
4.303
4.320
4.336
4.352
4.371
4.392
4.415
4.442
4.457
4.472
4.474
4.461
4.453
4.446
4.450
4.459
4.474
4.492
4.509
4.526
4.541
4.550
4.562
4.555
4.554
4.551
4.553


Summary of computational transaction
Raw Inputview raw input (R code)
Raw Outputview raw output of R engine
Computing time2 seconds
R Server'Gwilym Jenkins' @ jenkins.wessa.net

\begin{tabular}{lllllllll}
\hline
Summary of computational transaction \tabularnewline
Raw Input & view raw input (R code)  \tabularnewline
Raw Output & view raw output of R engine  \tabularnewline
Computing time & 2 seconds \tabularnewline
R Server & 'Gwilym Jenkins' @ jenkins.wessa.net \tabularnewline
\hline
\end{tabular}
%Source: https://freestatistics.org/blog/index.php?pk=224674&T=0

[TABLE]
[ROW][C]Summary of computational transaction[/C][/ROW]
[ROW][C]Raw Input[/C][C]view raw input (R code) [/C][/ROW]
[ROW][C]Raw Output[/C][C]view raw output of R engine [/C][/ROW]
[ROW][C]Computing time[/C][C]2 seconds[/C][/ROW]
[ROW][C]R Server[/C][C]'Gwilym Jenkins' @ jenkins.wessa.net[/C][/ROW]
[/TABLE]
Source: https://freestatistics.org/blog/index.php?pk=224674&T=0

Globally Unique Identifier (entire table): ba.freestatistics.org/blog/index.php?pk=224674&T=0

As an alternative you can also use a QR Code:  

The GUIDs for individual cells are displayed in the table below:

Summary of computational transaction
Raw Inputview raw input (R code)
Raw Outputview raw output of R engine
Computing time2 seconds
R Server'Gwilym Jenkins' @ jenkins.wessa.net


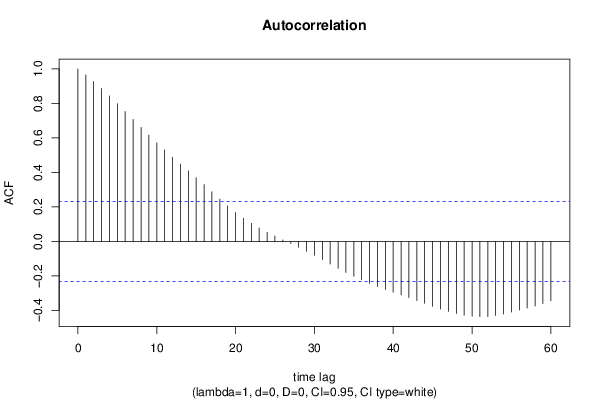
Autocorrelation Function
Time lag kACF(k)T-STATP-value
10.9655098.19260
20.92697.8650
30.8863537.5210
40.8435597.15780
50.798396.77460
60.7528316.3880
70.7067575.9970
80.6607885.6070
90.6161665.22831e-06
100.5724674.85753e-06
110.5297624.49521.3e-05
120.4885464.14554.6e-05
130.4481073.80230.000149
140.4083093.46460.000449
150.3689613.13070.00126
160.3291782.79320.003341
170.2874372.4390.008597
180.245372.0820.020447
190.2054651.74340.042763
200.1681951.42720.078925
210.1348621.14430.128135
220.1045690.88730.188938
230.0775860.65830.25621
240.0531790.45120.326586
250.0306250.25990.397857
260.0087460.07420.470525
27-0.012349-0.10480.458419
28-0.033927-0.28790.387134
29-0.056803-0.4820.315638
30-0.080355-0.68180.248767
31-0.105221-0.89280.187462
32-0.130587-1.10810.13576
33-0.156265-1.3260.094523
34-0.179721-1.5250.065822
35-0.201726-1.71170.045628
36-0.222523-1.88820.031516
37-0.242358-2.05650.021681
38-0.261154-2.2160.014928
39-0.278728-2.36510.010362
40-0.294177-2.49620.007422
41-0.309888-2.62950.005224
42-0.325724-2.76390.003624
43-0.342372-2.90510.002437
44-0.358905-3.04540.001623
45-0.375698-3.18790.001061
46-0.391703-3.32377e-04
47-0.405656-3.44210.000482
48-0.417863-3.54570.000346
49-0.427364-3.62630.000267
50-0.433706-3.68010.000223
51-0.43622-3.70150.000208
52-0.435148-3.69240.000215
53-0.429631-3.64550.00025
54-0.420904-3.57150.000319
55-0.409304-3.47310.000437
56-0.397231-3.37060.000604
57-0.386094-3.27610.00081
58-0.37416-3.17490.001103
59-0.360445-3.05850.001561
60-0.344619-2.92420.002307

\begin{tabular}{lllllllll}
\hline
Autocorrelation Function \tabularnewline
Time lag k & ACF(k) & T-STAT & P-value \tabularnewline
1 & 0.965509 & 8.1926 & 0 \tabularnewline
2 & 0.9269 & 7.865 & 0 \tabularnewline
3 & 0.886353 & 7.521 & 0 \tabularnewline
4 & 0.843559 & 7.1578 & 0 \tabularnewline
5 & 0.79839 & 6.7746 & 0 \tabularnewline
6 & 0.752831 & 6.388 & 0 \tabularnewline
7 & 0.706757 & 5.997 & 0 \tabularnewline
8 & 0.660788 & 5.607 & 0 \tabularnewline
9 & 0.616166 & 5.2283 & 1e-06 \tabularnewline
10 & 0.572467 & 4.8575 & 3e-06 \tabularnewline
11 & 0.529762 & 4.4952 & 1.3e-05 \tabularnewline
12 & 0.488546 & 4.1455 & 4.6e-05 \tabularnewline
13 & 0.448107 & 3.8023 & 0.000149 \tabularnewline
14 & 0.408309 & 3.4646 & 0.000449 \tabularnewline
15 & 0.368961 & 3.1307 & 0.00126 \tabularnewline
16 & 0.329178 & 2.7932 & 0.003341 \tabularnewline
17 & 0.287437 & 2.439 & 0.008597 \tabularnewline
18 & 0.24537 & 2.082 & 0.020447 \tabularnewline
19 & 0.205465 & 1.7434 & 0.042763 \tabularnewline
20 & 0.168195 & 1.4272 & 0.078925 \tabularnewline
21 & 0.134862 & 1.1443 & 0.128135 \tabularnewline
22 & 0.104569 & 0.8873 & 0.188938 \tabularnewline
23 & 0.077586 & 0.6583 & 0.25621 \tabularnewline
24 & 0.053179 & 0.4512 & 0.326586 \tabularnewline
25 & 0.030625 & 0.2599 & 0.397857 \tabularnewline
26 & 0.008746 & 0.0742 & 0.470525 \tabularnewline
27 & -0.012349 & -0.1048 & 0.458419 \tabularnewline
28 & -0.033927 & -0.2879 & 0.387134 \tabularnewline
29 & -0.056803 & -0.482 & 0.315638 \tabularnewline
30 & -0.080355 & -0.6818 & 0.248767 \tabularnewline
31 & -0.105221 & -0.8928 & 0.187462 \tabularnewline
32 & -0.130587 & -1.1081 & 0.13576 \tabularnewline
33 & -0.156265 & -1.326 & 0.094523 \tabularnewline
34 & -0.179721 & -1.525 & 0.065822 \tabularnewline
35 & -0.201726 & -1.7117 & 0.045628 \tabularnewline
36 & -0.222523 & -1.8882 & 0.031516 \tabularnewline
37 & -0.242358 & -2.0565 & 0.021681 \tabularnewline
38 & -0.261154 & -2.216 & 0.014928 \tabularnewline
39 & -0.278728 & -2.3651 & 0.010362 \tabularnewline
40 & -0.294177 & -2.4962 & 0.007422 \tabularnewline
41 & -0.309888 & -2.6295 & 0.005224 \tabularnewline
42 & -0.325724 & -2.7639 & 0.003624 \tabularnewline
43 & -0.342372 & -2.9051 & 0.002437 \tabularnewline
44 & -0.358905 & -3.0454 & 0.001623 \tabularnewline
45 & -0.375698 & -3.1879 & 0.001061 \tabularnewline
46 & -0.391703 & -3.3237 & 7e-04 \tabularnewline
47 & -0.405656 & -3.4421 & 0.000482 \tabularnewline
48 & -0.417863 & -3.5457 & 0.000346 \tabularnewline
49 & -0.427364 & -3.6263 & 0.000267 \tabularnewline
50 & -0.433706 & -3.6801 & 0.000223 \tabularnewline
51 & -0.43622 & -3.7015 & 0.000208 \tabularnewline
52 & -0.435148 & -3.6924 & 0.000215 \tabularnewline
53 & -0.429631 & -3.6455 & 0.00025 \tabularnewline
54 & -0.420904 & -3.5715 & 0.000319 \tabularnewline
55 & -0.409304 & -3.4731 & 0.000437 \tabularnewline
56 & -0.397231 & -3.3706 & 0.000604 \tabularnewline
57 & -0.386094 & -3.2761 & 0.00081 \tabularnewline
58 & -0.37416 & -3.1749 & 0.001103 \tabularnewline
59 & -0.360445 & -3.0585 & 0.001561 \tabularnewline
60 & -0.344619 & -2.9242 & 0.002307 \tabularnewline
\hline
\end{tabular}
%Source: https://freestatistics.org/blog/index.php?pk=224674&T=1

[TABLE]
[ROW][C]Autocorrelation Function[/C][/ROW]
[ROW][C]Time lag k[/C][C]ACF(k)[/C][C]T-STAT[/C][C]P-value[/C][/ROW]
[ROW][C]1[/C][C]0.965509[/C][C]8.1926[/C][C]0[/C][/ROW]
[ROW][C]2[/C][C]0.9269[/C][C]7.865[/C][C]0[/C][/ROW]
[ROW][C]3[/C][C]0.886353[/C][C]7.521[/C][C]0[/C][/ROW]
[ROW][C]4[/C][C]0.843559[/C][C]7.1578[/C][C]0[/C][/ROW]
[ROW][C]5[/C][C]0.79839[/C][C]6.7746[/C][C]0[/C][/ROW]
[ROW][C]6[/C][C]0.752831[/C][C]6.388[/C][C]0[/C][/ROW]
[ROW][C]7[/C][C]0.706757[/C][C]5.997[/C][C]0[/C][/ROW]
[ROW][C]8[/C][C]0.660788[/C][C]5.607[/C][C]0[/C][/ROW]
[ROW][C]9[/C][C]0.616166[/C][C]5.2283[/C][C]1e-06[/C][/ROW]
[ROW][C]10[/C][C]0.572467[/C][C]4.8575[/C][C]3e-06[/C][/ROW]
[ROW][C]11[/C][C]0.529762[/C][C]4.4952[/C][C]1.3e-05[/C][/ROW]
[ROW][C]12[/C][C]0.488546[/C][C]4.1455[/C][C]4.6e-05[/C][/ROW]
[ROW][C]13[/C][C]0.448107[/C][C]3.8023[/C][C]0.000149[/C][/ROW]
[ROW][C]14[/C][C]0.408309[/C][C]3.4646[/C][C]0.000449[/C][/ROW]
[ROW][C]15[/C][C]0.368961[/C][C]3.1307[/C][C]0.00126[/C][/ROW]
[ROW][C]16[/C][C]0.329178[/C][C]2.7932[/C][C]0.003341[/C][/ROW]
[ROW][C]17[/C][C]0.287437[/C][C]2.439[/C][C]0.008597[/C][/ROW]
[ROW][C]18[/C][C]0.24537[/C][C]2.082[/C][C]0.020447[/C][/ROW]
[ROW][C]19[/C][C]0.205465[/C][C]1.7434[/C][C]0.042763[/C][/ROW]
[ROW][C]20[/C][C]0.168195[/C][C]1.4272[/C][C]0.078925[/C][/ROW]
[ROW][C]21[/C][C]0.134862[/C][C]1.1443[/C][C]0.128135[/C][/ROW]
[ROW][C]22[/C][C]0.104569[/C][C]0.8873[/C][C]0.188938[/C][/ROW]
[ROW][C]23[/C][C]0.077586[/C][C]0.6583[/C][C]0.25621[/C][/ROW]
[ROW][C]24[/C][C]0.053179[/C][C]0.4512[/C][C]0.326586[/C][/ROW]
[ROW][C]25[/C][C]0.030625[/C][C]0.2599[/C][C]0.397857[/C][/ROW]
[ROW][C]26[/C][C]0.008746[/C][C]0.0742[/C][C]0.470525[/C][/ROW]
[ROW][C]27[/C][C]-0.012349[/C][C]-0.1048[/C][C]0.458419[/C][/ROW]
[ROW][C]28[/C][C]-0.033927[/C][C]-0.2879[/C][C]0.387134[/C][/ROW]
[ROW][C]29[/C][C]-0.056803[/C][C]-0.482[/C][C]0.315638[/C][/ROW]
[ROW][C]30[/C][C]-0.080355[/C][C]-0.6818[/C][C]0.248767[/C][/ROW]
[ROW][C]31[/C][C]-0.105221[/C][C]-0.8928[/C][C]0.187462[/C][/ROW]
[ROW][C]32[/C][C]-0.130587[/C][C]-1.1081[/C][C]0.13576[/C][/ROW]
[ROW][C]33[/C][C]-0.156265[/C][C]-1.326[/C][C]0.094523[/C][/ROW]
[ROW][C]34[/C][C]-0.179721[/C][C]-1.525[/C][C]0.065822[/C][/ROW]
[ROW][C]35[/C][C]-0.201726[/C][C]-1.7117[/C][C]0.045628[/C][/ROW]
[ROW][C]36[/C][C]-0.222523[/C][C]-1.8882[/C][C]0.031516[/C][/ROW]
[ROW][C]37[/C][C]-0.242358[/C][C]-2.0565[/C][C]0.021681[/C][/ROW]
[ROW][C]38[/C][C]-0.261154[/C][C]-2.216[/C][C]0.014928[/C][/ROW]
[ROW][C]39[/C][C]-0.278728[/C][C]-2.3651[/C][C]0.010362[/C][/ROW]
[ROW][C]40[/C][C]-0.294177[/C][C]-2.4962[/C][C]0.007422[/C][/ROW]
[ROW][C]41[/C][C]-0.309888[/C][C]-2.6295[/C][C]0.005224[/C][/ROW]
[ROW][C]42[/C][C]-0.325724[/C][C]-2.7639[/C][C]0.003624[/C][/ROW]
[ROW][C]43[/C][C]-0.342372[/C][C]-2.9051[/C][C]0.002437[/C][/ROW]
[ROW][C]44[/C][C]-0.358905[/C][C]-3.0454[/C][C]0.001623[/C][/ROW]
[ROW][C]45[/C][C]-0.375698[/C][C]-3.1879[/C][C]0.001061[/C][/ROW]
[ROW][C]46[/C][C]-0.391703[/C][C]-3.3237[/C][C]7e-04[/C][/ROW]
[ROW][C]47[/C][C]-0.405656[/C][C]-3.4421[/C][C]0.000482[/C][/ROW]
[ROW][C]48[/C][C]-0.417863[/C][C]-3.5457[/C][C]0.000346[/C][/ROW]
[ROW][C]49[/C][C]-0.427364[/C][C]-3.6263[/C][C]0.000267[/C][/ROW]
[ROW][C]50[/C][C]-0.433706[/C][C]-3.6801[/C][C]0.000223[/C][/ROW]
[ROW][C]51[/C][C]-0.43622[/C][C]-3.7015[/C][C]0.000208[/C][/ROW]
[ROW][C]52[/C][C]-0.435148[/C][C]-3.6924[/C][C]0.000215[/C][/ROW]
[ROW][C]53[/C][C]-0.429631[/C][C]-3.6455[/C][C]0.00025[/C][/ROW]
[ROW][C]54[/C][C]-0.420904[/C][C]-3.5715[/C][C]0.000319[/C][/ROW]
[ROW][C]55[/C][C]-0.409304[/C][C]-3.4731[/C][C]0.000437[/C][/ROW]
[ROW][C]56[/C][C]-0.397231[/C][C]-3.3706[/C][C]0.000604[/C][/ROW]
[ROW][C]57[/C][C]-0.386094[/C][C]-3.2761[/C][C]0.00081[/C][/ROW]
[ROW][C]58[/C][C]-0.37416[/C][C]-3.1749[/C][C]0.001103[/C][/ROW]
[ROW][C]59[/C][C]-0.360445[/C][C]-3.0585[/C][C]0.001561[/C][/ROW]
[ROW][C]60[/C][C]-0.344619[/C][C]-2.9242[/C][C]0.002307[/C][/ROW]
[/TABLE]
Source: https://freestatistics.org/blog/index.php?pk=224674&T=1

Globally Unique Identifier (entire table): ba.freestatistics.org/blog/index.php?pk=224674&T=1

As an alternative you can also use a QR Code:  

The GUIDs for individual cells are displayed in the table below:

Autocorrelation Function
Time lag kACF(k)T-STATP-value
10.9655098.19260
20.92697.8650
30.8863537.5210
40.8435597.15780
50.798396.77460
60.7528316.3880
70.7067575.9970
80.6607885.6070
90.6161665.22831e-06
100.5724674.85753e-06
110.5297624.49521.3e-05
120.4885464.14554.6e-05
130.4481073.80230.000149
140.4083093.46460.000449
150.3689613.13070.00126
160.3291782.79320.003341
170.2874372.4390.008597
180.245372.0820.020447
190.2054651.74340.042763
200.1681951.42720.078925
210.1348621.14430.128135
220.1045690.88730.188938
230.0775860.65830.25621
240.0531790.45120.326586
250.0306250.25990.397857
260.0087460.07420.470525
27-0.012349-0.10480.458419
28-0.033927-0.28790.387134
29-0.056803-0.4820.315638
30-0.080355-0.68180.248767
31-0.105221-0.89280.187462
32-0.130587-1.10810.13576
33-0.156265-1.3260.094523
34-0.179721-1.5250.065822
35-0.201726-1.71170.045628
36-0.222523-1.88820.031516
37-0.242358-2.05650.021681
38-0.261154-2.2160.014928
39-0.278728-2.36510.010362
40-0.294177-2.49620.007422
41-0.309888-2.62950.005224
42-0.325724-2.76390.003624
43-0.342372-2.90510.002437
44-0.358905-3.04540.001623
45-0.375698-3.18790.001061
46-0.391703-3.32377e-04
47-0.405656-3.44210.000482
48-0.417863-3.54570.000346
49-0.427364-3.62630.000267
50-0.433706-3.68010.000223
51-0.43622-3.70150.000208
52-0.435148-3.69240.000215
53-0.429631-3.64550.00025
54-0.420904-3.57150.000319
55-0.409304-3.47310.000437
56-0.397231-3.37060.000604
57-0.386094-3.27610.00081
58-0.37416-3.17490.001103
59-0.360445-3.05850.001561
60-0.344619-2.92420.002307


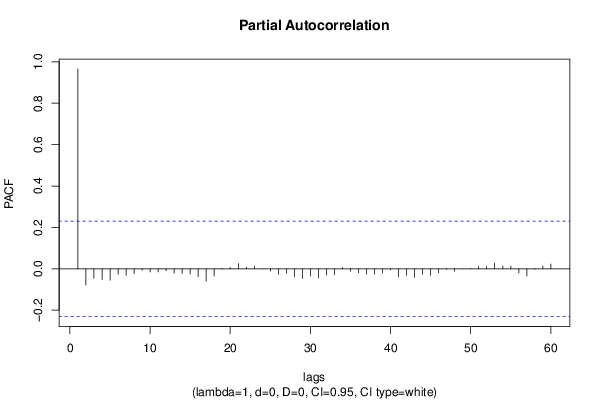
Partial Autocorrelation Function
Time lag kPACF(k)T-STATP-value
10.9655098.19260
2-0.078288-0.66430.254313
3-0.045295-0.38430.350929
4-0.051885-0.44030.330536
5-0.054514-0.46260.322536
6-0.026038-0.22090.412883
7-0.031071-0.26360.396402
8-0.022854-0.19390.42339
9-0.006405-0.05430.478405
10-0.015508-0.13160.447838
11-0.014839-0.12590.450076
12-0.008794-0.07460.470363
13-0.02072-0.17580.430467
14-0.021872-0.18560.426644
15-0.025161-0.21350.415769
16-0.038289-0.32490.373102
17-0.059923-0.50850.30634
18-0.034921-0.29630.383921
190.000780.00660.497368
200.0063060.05350.478736
210.0250250.21230.416221
220.0082830.07030.472083
230.0120340.10210.459475
240.0001150.0010.499612
25-0.010872-0.09220.463379
26-0.025997-0.22060.413018
27-0.021625-0.18350.427461
28-0.038558-0.32720.372242
29-0.046768-0.39680.346329
30-0.034894-0.29610.384008
31-0.044091-0.37410.354705
32-0.029806-0.25290.400528
33-0.028671-0.24330.40424
340.0063710.05410.47852
35-0.010981-0.09320.463013
36-0.018298-0.15530.438526
37-0.025131-0.21320.415869
38-0.024677-0.20940.417366
39-0.020302-0.17230.431856
40-0.004746-0.04030.483995
41-0.037898-0.32160.374354
42-0.031296-0.26560.395669
43-0.041264-0.35010.36363
44-0.026253-0.22280.412174
45-0.031124-0.26410.39623
46-0.018493-0.15690.437874
47-0.001931-0.01640.493487
48-0.011095-0.09410.462627
49-0.000521-0.00440.498243
500.0017080.01450.494239
510.0111610.09470.462405
520.0110170.09350.462888
530.0276690.23480.407523
540.0137150.11640.45384
550.0129830.11020.456294
56-0.019481-0.16530.434584
57-0.034531-0.2930.385181
58-0.002217-0.01880.492522
590.0140370.11910.45276
600.0226690.19240.424004

\begin{tabular}{lllllllll}
\hline
Partial Autocorrelation Function \tabularnewline
Time lag k & PACF(k) & T-STAT & P-value \tabularnewline
1 & 0.965509 & 8.1926 & 0 \tabularnewline
2 & -0.078288 & -0.6643 & 0.254313 \tabularnewline
3 & -0.045295 & -0.3843 & 0.350929 \tabularnewline
4 & -0.051885 & -0.4403 & 0.330536 \tabularnewline
5 & -0.054514 & -0.4626 & 0.322536 \tabularnewline
6 & -0.026038 & -0.2209 & 0.412883 \tabularnewline
7 & -0.031071 & -0.2636 & 0.396402 \tabularnewline
8 & -0.022854 & -0.1939 & 0.42339 \tabularnewline
9 & -0.006405 & -0.0543 & 0.478405 \tabularnewline
10 & -0.015508 & -0.1316 & 0.447838 \tabularnewline
11 & -0.014839 & -0.1259 & 0.450076 \tabularnewline
12 & -0.008794 & -0.0746 & 0.470363 \tabularnewline
13 & -0.02072 & -0.1758 & 0.430467 \tabularnewline
14 & -0.021872 & -0.1856 & 0.426644 \tabularnewline
15 & -0.025161 & -0.2135 & 0.415769 \tabularnewline
16 & -0.038289 & -0.3249 & 0.373102 \tabularnewline
17 & -0.059923 & -0.5085 & 0.30634 \tabularnewline
18 & -0.034921 & -0.2963 & 0.383921 \tabularnewline
19 & 0.00078 & 0.0066 & 0.497368 \tabularnewline
20 & 0.006306 & 0.0535 & 0.478736 \tabularnewline
21 & 0.025025 & 0.2123 & 0.416221 \tabularnewline
22 & 0.008283 & 0.0703 & 0.472083 \tabularnewline
23 & 0.012034 & 0.1021 & 0.459475 \tabularnewline
24 & 0.000115 & 0.001 & 0.499612 \tabularnewline
25 & -0.010872 & -0.0922 & 0.463379 \tabularnewline
26 & -0.025997 & -0.2206 & 0.413018 \tabularnewline
27 & -0.021625 & -0.1835 & 0.427461 \tabularnewline
28 & -0.038558 & -0.3272 & 0.372242 \tabularnewline
29 & -0.046768 & -0.3968 & 0.346329 \tabularnewline
30 & -0.034894 & -0.2961 & 0.384008 \tabularnewline
31 & -0.044091 & -0.3741 & 0.354705 \tabularnewline
32 & -0.029806 & -0.2529 & 0.400528 \tabularnewline
33 & -0.028671 & -0.2433 & 0.40424 \tabularnewline
34 & 0.006371 & 0.0541 & 0.47852 \tabularnewline
35 & -0.010981 & -0.0932 & 0.463013 \tabularnewline
36 & -0.018298 & -0.1553 & 0.438526 \tabularnewline
37 & -0.025131 & -0.2132 & 0.415869 \tabularnewline
38 & -0.024677 & -0.2094 & 0.417366 \tabularnewline
39 & -0.020302 & -0.1723 & 0.431856 \tabularnewline
40 & -0.004746 & -0.0403 & 0.483995 \tabularnewline
41 & -0.037898 & -0.3216 & 0.374354 \tabularnewline
42 & -0.031296 & -0.2656 & 0.395669 \tabularnewline
43 & -0.041264 & -0.3501 & 0.36363 \tabularnewline
44 & -0.026253 & -0.2228 & 0.412174 \tabularnewline
45 & -0.031124 & -0.2641 & 0.39623 \tabularnewline
46 & -0.018493 & -0.1569 & 0.437874 \tabularnewline
47 & -0.001931 & -0.0164 & 0.493487 \tabularnewline
48 & -0.011095 & -0.0941 & 0.462627 \tabularnewline
49 & -0.000521 & -0.0044 & 0.498243 \tabularnewline
50 & 0.001708 & 0.0145 & 0.494239 \tabularnewline
51 & 0.011161 & 0.0947 & 0.462405 \tabularnewline
52 & 0.011017 & 0.0935 & 0.462888 \tabularnewline
53 & 0.027669 & 0.2348 & 0.407523 \tabularnewline
54 & 0.013715 & 0.1164 & 0.45384 \tabularnewline
55 & 0.012983 & 0.1102 & 0.456294 \tabularnewline
56 & -0.019481 & -0.1653 & 0.434584 \tabularnewline
57 & -0.034531 & -0.293 & 0.385181 \tabularnewline
58 & -0.002217 & -0.0188 & 0.492522 \tabularnewline
59 & 0.014037 & 0.1191 & 0.45276 \tabularnewline
60 & 0.022669 & 0.1924 & 0.424004 \tabularnewline
\hline
\end{tabular}
%Source: https://freestatistics.org/blog/index.php?pk=224674&T=2

[TABLE]
[ROW][C]Partial Autocorrelation Function[/C][/ROW]
[ROW][C]Time lag k[/C][C]PACF(k)[/C][C]T-STAT[/C][C]P-value[/C][/ROW]
[ROW][C]1[/C][C]0.965509[/C][C]8.1926[/C][C]0[/C][/ROW]
[ROW][C]2[/C][C]-0.078288[/C][C]-0.6643[/C][C]0.254313[/C][/ROW]
[ROW][C]3[/C][C]-0.045295[/C][C]-0.3843[/C][C]0.350929[/C][/ROW]
[ROW][C]4[/C][C]-0.051885[/C][C]-0.4403[/C][C]0.330536[/C][/ROW]
[ROW][C]5[/C][C]-0.054514[/C][C]-0.4626[/C][C]0.322536[/C][/ROW]
[ROW][C]6[/C][C]-0.026038[/C][C]-0.2209[/C][C]0.412883[/C][/ROW]
[ROW][C]7[/C][C]-0.031071[/C][C]-0.2636[/C][C]0.396402[/C][/ROW]
[ROW][C]8[/C][C]-0.022854[/C][C]-0.1939[/C][C]0.42339[/C][/ROW]
[ROW][C]9[/C][C]-0.006405[/C][C]-0.0543[/C][C]0.478405[/C][/ROW]
[ROW][C]10[/C][C]-0.015508[/C][C]-0.1316[/C][C]0.447838[/C][/ROW]
[ROW][C]11[/C][C]-0.014839[/C][C]-0.1259[/C][C]0.450076[/C][/ROW]
[ROW][C]12[/C][C]-0.008794[/C][C]-0.0746[/C][C]0.470363[/C][/ROW]
[ROW][C]13[/C][C]-0.02072[/C][C]-0.1758[/C][C]0.430467[/C][/ROW]
[ROW][C]14[/C][C]-0.021872[/C][C]-0.1856[/C][C]0.426644[/C][/ROW]
[ROW][C]15[/C][C]-0.025161[/C][C]-0.2135[/C][C]0.415769[/C][/ROW]
[ROW][C]16[/C][C]-0.038289[/C][C]-0.3249[/C][C]0.373102[/C][/ROW]
[ROW][C]17[/C][C]-0.059923[/C][C]-0.5085[/C][C]0.30634[/C][/ROW]
[ROW][C]18[/C][C]-0.034921[/C][C]-0.2963[/C][C]0.383921[/C][/ROW]
[ROW][C]19[/C][C]0.00078[/C][C]0.0066[/C][C]0.497368[/C][/ROW]
[ROW][C]20[/C][C]0.006306[/C][C]0.0535[/C][C]0.478736[/C][/ROW]
[ROW][C]21[/C][C]0.025025[/C][C]0.2123[/C][C]0.416221[/C][/ROW]
[ROW][C]22[/C][C]0.008283[/C][C]0.0703[/C][C]0.472083[/C][/ROW]
[ROW][C]23[/C][C]0.012034[/C][C]0.1021[/C][C]0.459475[/C][/ROW]
[ROW][C]24[/C][C]0.000115[/C][C]0.001[/C][C]0.499612[/C][/ROW]
[ROW][C]25[/C][C]-0.010872[/C][C]-0.0922[/C][C]0.463379[/C][/ROW]
[ROW][C]26[/C][C]-0.025997[/C][C]-0.2206[/C][C]0.413018[/C][/ROW]
[ROW][C]27[/C][C]-0.021625[/C][C]-0.1835[/C][C]0.427461[/C][/ROW]
[ROW][C]28[/C][C]-0.038558[/C][C]-0.3272[/C][C]0.372242[/C][/ROW]
[ROW][C]29[/C][C]-0.046768[/C][C]-0.3968[/C][C]0.346329[/C][/ROW]
[ROW][C]30[/C][C]-0.034894[/C][C]-0.2961[/C][C]0.384008[/C][/ROW]
[ROW][C]31[/C][C]-0.044091[/C][C]-0.3741[/C][C]0.354705[/C][/ROW]
[ROW][C]32[/C][C]-0.029806[/C][C]-0.2529[/C][C]0.400528[/C][/ROW]
[ROW][C]33[/C][C]-0.028671[/C][C]-0.2433[/C][C]0.40424[/C][/ROW]
[ROW][C]34[/C][C]0.006371[/C][C]0.0541[/C][C]0.47852[/C][/ROW]
[ROW][C]35[/C][C]-0.010981[/C][C]-0.0932[/C][C]0.463013[/C][/ROW]
[ROW][C]36[/C][C]-0.018298[/C][C]-0.1553[/C][C]0.438526[/C][/ROW]
[ROW][C]37[/C][C]-0.025131[/C][C]-0.2132[/C][C]0.415869[/C][/ROW]
[ROW][C]38[/C][C]-0.024677[/C][C]-0.2094[/C][C]0.417366[/C][/ROW]
[ROW][C]39[/C][C]-0.020302[/C][C]-0.1723[/C][C]0.431856[/C][/ROW]
[ROW][C]40[/C][C]-0.004746[/C][C]-0.0403[/C][C]0.483995[/C][/ROW]
[ROW][C]41[/C][C]-0.037898[/C][C]-0.3216[/C][C]0.374354[/C][/ROW]
[ROW][C]42[/C][C]-0.031296[/C][C]-0.2656[/C][C]0.395669[/C][/ROW]
[ROW][C]43[/C][C]-0.041264[/C][C]-0.3501[/C][C]0.36363[/C][/ROW]
[ROW][C]44[/C][C]-0.026253[/C][C]-0.2228[/C][C]0.412174[/C][/ROW]
[ROW][C]45[/C][C]-0.031124[/C][C]-0.2641[/C][C]0.39623[/C][/ROW]
[ROW][C]46[/C][C]-0.018493[/C][C]-0.1569[/C][C]0.437874[/C][/ROW]
[ROW][C]47[/C][C]-0.001931[/C][C]-0.0164[/C][C]0.493487[/C][/ROW]
[ROW][C]48[/C][C]-0.011095[/C][C]-0.0941[/C][C]0.462627[/C][/ROW]
[ROW][C]49[/C][C]-0.000521[/C][C]-0.0044[/C][C]0.498243[/C][/ROW]
[ROW][C]50[/C][C]0.001708[/C][C]0.0145[/C][C]0.494239[/C][/ROW]
[ROW][C]51[/C][C]0.011161[/C][C]0.0947[/C][C]0.462405[/C][/ROW]
[ROW][C]52[/C][C]0.011017[/C][C]0.0935[/C][C]0.462888[/C][/ROW]
[ROW][C]53[/C][C]0.027669[/C][C]0.2348[/C][C]0.407523[/C][/ROW]
[ROW][C]54[/C][C]0.013715[/C][C]0.1164[/C][C]0.45384[/C][/ROW]
[ROW][C]55[/C][C]0.012983[/C][C]0.1102[/C][C]0.456294[/C][/ROW]
[ROW][C]56[/C][C]-0.019481[/C][C]-0.1653[/C][C]0.434584[/C][/ROW]
[ROW][C]57[/C][C]-0.034531[/C][C]-0.293[/C][C]0.385181[/C][/ROW]
[ROW][C]58[/C][C]-0.002217[/C][C]-0.0188[/C][C]0.492522[/C][/ROW]
[ROW][C]59[/C][C]0.014037[/C][C]0.1191[/C][C]0.45276[/C][/ROW]
[ROW][C]60[/C][C]0.022669[/C][C]0.1924[/C][C]0.424004[/C][/ROW]
[/TABLE]
Source: https://freestatistics.org/blog/index.php?pk=224674&T=2

Globally Unique Identifier (entire table): ba.freestatistics.org/blog/index.php?pk=224674&T=2

As an alternative you can also use a QR Code:  

The GUIDs for individual cells are displayed in the table below:

Partial Autocorrelation Function
Time lag kPACF(k)T-STATP-value
10.9655098.19260
2-0.078288-0.66430.254313
3-0.045295-0.38430.350929
4-0.051885-0.44030.330536
5-0.054514-0.46260.322536
6-0.026038-0.22090.412883
7-0.031071-0.26360.396402
8-0.022854-0.19390.42339
9-0.006405-0.05430.478405
10-0.015508-0.13160.447838
11-0.014839-0.12590.450076
12-0.008794-0.07460.470363
13-0.02072-0.17580.430467
14-0.021872-0.18560.426644
15-0.025161-0.21350.415769
16-0.038289-0.32490.373102
17-0.059923-0.50850.30634
18-0.034921-0.29630.383921
190.000780.00660.497368
200.0063060.05350.478736
210.0250250.21230.416221
220.0082830.07030.472083
230.0120340.10210.459475
240.0001150.0010.499612
25-0.010872-0.09220.463379
26-0.025997-0.22060.413018
27-0.021625-0.18350.427461
28-0.038558-0.32720.372242
29-0.046768-0.39680.346329
30-0.034894-0.29610.384008
31-0.044091-0.37410.354705
32-0.029806-0.25290.400528
33-0.028671-0.24330.40424
340.0063710.05410.47852
35-0.010981-0.09320.463013
36-0.018298-0.15530.438526
37-0.025131-0.21320.415869
38-0.024677-0.20940.417366
39-0.020302-0.17230.431856
40-0.004746-0.04030.483995
41-0.037898-0.32160.374354
42-0.031296-0.26560.395669
43-0.041264-0.35010.36363
44-0.026253-0.22280.412174
45-0.031124-0.26410.39623
46-0.018493-0.15690.437874
47-0.001931-0.01640.493487
48-0.011095-0.09410.462627
49-0.000521-0.00440.498243
500.0017080.01450.494239
510.0111610.09470.462405
520.0110170.09350.462888
530.0276690.23480.407523
540.0137150.11640.45384
550.0129830.11020.456294
56-0.019481-0.16530.434584
57-0.034531-0.2930.385181
58-0.002217-0.01880.492522
590.0140370.11910.45276
600.0226690.19240.424004


Parameters (Session):
par1 = 60 ; par2 = 1 ; par3 = 0 ; par4 = 0 ; par5 = 12 ; par6 = White Noise ; par7 = 0.95 ;
Parameters (R input):
par1 = 60 ; par2 = 1 ; par3 = 0 ; par4 = 0 ; par5 = 12 ; par6 = White Noise ; par7 = 0.95 ; par8 = ;
R code (references can be found in the software module):
if (par1 == 'Default') {
par1 = 10*log10(length(x))
} else {
par1 <- as.numeric(par1)
}
par2 <- as.numeric(par2)
par3 <- as.numeric(par3)
par4 <- as.numeric(par4)
par5 <- as.numeric(par5)
if (par6 == 'White Noise') par6 <- 'white' else par6 <- 'ma'
par7 <- as.numeric(par7)
if (par8 != '') par8 <- as.numeric(par8)
ox <- x
if (par8 == '') {
if (par2 == 0) {
x <- log(x)
} else {
x <- (x ^ par2 - 1) / par2
}
} else {
x <- log(x,base=par8)
}
if (par3 > 0) x <- diff(x,lag=1,difference=par3)
if (par4 > 0) x <- diff(x,lag=par5,difference=par4)
bitmap(file='picts.png')
op <- par(mfrow=c(2,1))
plot(ox,type='l',main='Original Time Series',xlab='time',ylab='value')
if (par8=='') {
mytitle <- paste('Working Time Series (lambda=',par2,', d=',par3,', D=',par4,')',sep='')
mysub <- paste('(lambda=',par2,', d=',par3,', D=',par4,', CI=', par7, ', CI type=',par6,')',sep='')
} else {
mytitle <- paste('Working Time Series (base=',par8,', d=',par3,', D=',par4,')',sep='')
mysub <- paste('(base=',par8,', d=',par3,', D=',par4,', CI=', par7, ', CI type=',par6,')',sep='')
}
plot(x,type='l', main=mytitle,xlab='time',ylab='value')
par(op)
dev.off()
bitmap(file='pic1.png')
racf <- acf(x, par1, main='Autocorrelation', xlab='time lag', ylab='ACF', ci.type=par6, ci=par7, sub=mysub)
dev.off()
bitmap(file='pic2.png')
rpacf <- pacf(x,par1,main='Partial Autocorrelation',xlab='lags',ylab='PACF',sub=mysub)
dev.off()
(myacf <- c(racf$acf))
(mypacf <- c(rpacf$acf))
lengthx <- length(x)
sqrtn <- sqrt(lengthx)
load(file='createtable')
a<-table.start()
a<-table.row.start(a)
a<-table.element(a,'Autocorrelation Function',4,TRUE)
a<-table.row.end(a)
a<-table.row.start(a)
a<-table.element(a,'Time lag k',header=TRUE)
a<-table.element(a,hyperlink('basics.htm','ACF(k)','click here for more information about the Autocorrelation Function'),header=TRUE)
a<-table.element(a,'T-STAT',header=TRUE)
a<-table.element(a,'P-value',header=TRUE)
a<-table.row.end(a)
for (i in 2:(par1+1)) {
a<-table.row.start(a)
a<-table.element(a,i-1,header=TRUE)
a<-table.element(a,round(myacf[i],6))
mytstat <- myacf[i]*sqrtn
a<-table.element(a,round(mytstat,4))
a<-table.element(a,round(1-pt(abs(mytstat),lengthx),6))
a<-table.row.end(a)
}
a<-table.end(a)
table.save(a,file='mytable.tab')
a<-table.start()
a<-table.row.start(a)
a<-table.element(a,'Partial Autocorrelation Function',4,TRUE)
a<-table.row.end(a)
a<-table.row.start(a)
a<-table.element(a,'Time lag k',header=TRUE)
a<-table.element(a,hyperlink('basics.htm','PACF(k)','click here for more information about the Partial Autocorrelation Function'),header=TRUE)
a<-table.element(a,'T-STAT',header=TRUE)
a<-table.element(a,'P-value',header=TRUE)
a<-table.row.end(a)
for (i in 1:par1) {
a<-table.row.start(a)
a<-table.element(a,i,header=TRUE)
a<-table.element(a,round(mypacf[i],6))
mytstat <- mypacf[i]*sqrtn
a<-table.element(a,round(mytstat,4))
a<-table.element(a,round(1-pt(abs(mytstat),lengthx),6))
a<-table.row.end(a)
}
a<-table.end(a)
table.save(a,file='mytable1.tab')