Free Statistics

of Irreproducible Research!

Author's title

Author*Unverified author*
R Software Modulerwasp_autocorrelation.wasp
Title produced by software(Partial) Autocorrelation Function
Date of computationWed, 13 Nov 2013 04:10:55 -0500
Cite this page as followsStatistical Computations at FreeStatistics.org, Office for Research Development and Education, URL https://freestatistics.org/blog/index.php?v=date/2013/Nov/13/t1384334018l2noz752e502hat.htm/, Retrieved Sun, 28 Apr 2024 20:55:14 +0000
Statistical Computations at FreeStatistics.org, Office for Research Development and Education, URL https://freestatistics.org/blog/index.php?pk=224667, Retrieved Sun, 28 Apr 2024 20:55:14 +0000
QR Codes:

Original text written by user:
IsPrivate?No (this computation is public)
User-defined keywords
Estimated Impact72
Family? (F = Feedback message, R = changed R code, M = changed R Module, P = changed Parameters, D = changed Data)
-       [(Partial) Autocorrelation Function] [] [2013-11-13 09:10:55] [4a7f7842fc88d649abcd00dd10ef7b6c] [Current]
Feedback Forum

Post a new message
Dataseries X:
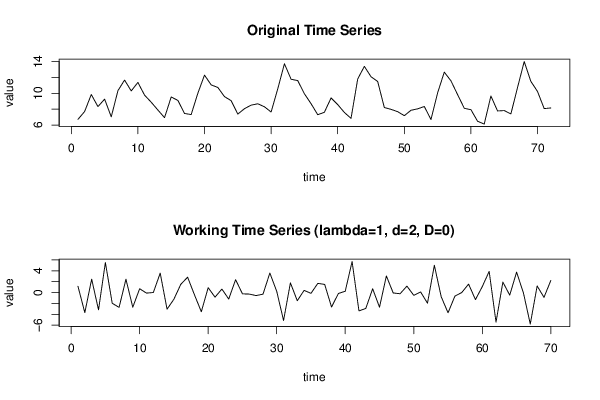
 6.715 
 7.703 
 9.856 
 8.326 
 9.269 
 7.035 
 10.342 
 11.682 
 10.304 
 11.385 
 9.777 
 8.882 
 7.897 
 6.930 
 9.545 
 9.110 
 7.459 
 7.320 
 10.017 
 12.307 
 11.072 
 10.749 
 9.589 
 9.080 
 7.384 
 8.062 
 8.511 
 8.684 
 8.306 
 7.643 
 10.577 
 13.747 
 11.783 
 11.611 
 9.946 
 8.693 
 7.303 
 7.609 
 9.423 
 8.584 
 7.586 
 6.843 
 11.811 
 13.414 
 12.103 
 11.501 
 8.213 
 7.982 
 7.687 
 7.180 
 7.862 
 8.043 
 8.340 
 6.692 
 10.065 
 12.684 
 11.587 
 9.843 
 8.110 
 7.940 
 6.475 
 6.121 
 9.669 
 7.778 
 7.826 
 7.403 
 10.741 
 14.023 
 11.519 
 10.236 
 8.075 
 8.157 


Summary of computational transaction
Raw Inputview raw input (R code)
Raw Outputview raw output of R engine
Computing time2 seconds
R Server'Gwilym Jenkins' @ jenkins.wessa.net

\begin{tabular}{lllllllll}
\hline
Summary of computational transaction \tabularnewline
Raw Input & view raw input (R code)  \tabularnewline
Raw Output & view raw output of R engine  \tabularnewline
Computing time & 2 seconds \tabularnewline
R Server & 'Gwilym Jenkins' @ jenkins.wessa.net \tabularnewline
\hline
\end{tabular}
%Source: https://freestatistics.org/blog/index.php?pk=224667&T=0

[TABLE]
[ROW][C]Summary of computational transaction[/C][/ROW]
[ROW][C]Raw Input[/C][C]view raw input (R code) [/C][/ROW]
[ROW][C]Raw Output[/C][C]view raw output of R engine [/C][/ROW]
[ROW][C]Computing time[/C][C]2 seconds[/C][/ROW]
[ROW][C]R Server[/C][C]'Gwilym Jenkins' @ jenkins.wessa.net[/C][/ROW]
[/TABLE]
Source: https://freestatistics.org/blog/index.php?pk=224667&T=0

Globally Unique Identifier (entire table): ba.freestatistics.org/blog/index.php?pk=224667&T=0

As an alternative you can also use a QR Code:  

The GUIDs for individual cells are displayed in the table below:

Summary of computational transaction
Raw Inputview raw input (R code)
Raw Outputview raw output of R engine
Computing time2 seconds
R Server'Gwilym Jenkins' @ jenkins.wessa.net


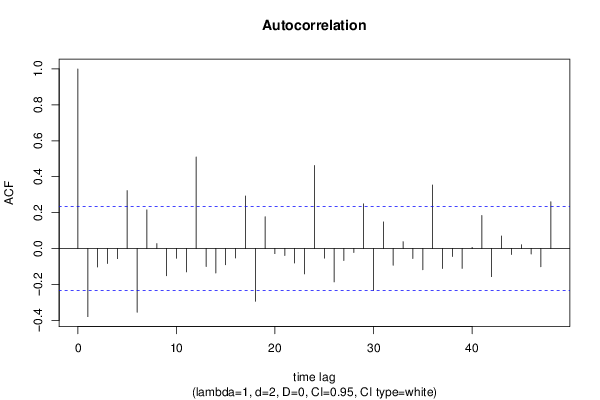
Autocorrelation Function
Time lag kACF(k)T-STATP-value
1-0.379595-3.17590.001111
2-0.102695-0.85920.196578
3-0.083519-0.69880.243505
4-0.056545-0.47310.318812
50.3222462.69610.00439
6-0.355569-2.97490.00201
70.2149991.79880.03818
80.0271130.22680.410602
9-0.151793-1.270.104147
10-0.053994-0.45170.326424
11-0.130106-1.08850.140043
120.5099214.26633.1e-05
13-0.099946-0.83620.202942
14-0.136906-1.14540.127964
15-0.090789-0.75960.225023
16-0.05256-0.43970.330738
170.2921312.44410.008521
18-0.293525-2.45580.008271
190.1767641.47890.071825
20-0.028656-0.23980.405611
21-0.039105-0.32720.372256
22-0.080787-0.67590.250663
23-0.141415-1.18320.120374
240.4623773.86850.000121
25-0.053653-0.44890.327448
26-0.186107-1.55710.061981
27-0.066438-0.55590.29004
28-0.022122-0.18510.426847
290.2486012.07990.020597
30-0.234387-1.9610.026928
310.148121.23930.109695
32-0.093322-0.78080.21878
330.0381270.3190.375341
34-0.055464-0.4640.322028
35-0.118131-0.98840.163192
360.3533052.9560.002123
37-0.11157-0.93350.176895
38-0.044825-0.3750.354385
39-0.110861-0.92750.178418
400.0064250.05380.478643
410.1836691.53670.064439
42-0.156709-1.31110.097051
430.0698290.58420.280472
44-0.033953-0.28410.388597
450.0207610.17370.431302
46-0.030267-0.25320.400414
47-0.101345-0.84790.199689
480.2607242.18140.016258

\begin{tabular}{lllllllll}
\hline
Autocorrelation Function \tabularnewline
Time lag k & ACF(k) & T-STAT & P-value \tabularnewline
1 & -0.379595 & -3.1759 & 0.001111 \tabularnewline
2 & -0.102695 & -0.8592 & 0.196578 \tabularnewline
3 & -0.083519 & -0.6988 & 0.243505 \tabularnewline
4 & -0.056545 & -0.4731 & 0.318812 \tabularnewline
5 & 0.322246 & 2.6961 & 0.00439 \tabularnewline
6 & -0.355569 & -2.9749 & 0.00201 \tabularnewline
7 & 0.214999 & 1.7988 & 0.03818 \tabularnewline
8 & 0.027113 & 0.2268 & 0.410602 \tabularnewline
9 & -0.151793 & -1.27 & 0.104147 \tabularnewline
10 & -0.053994 & -0.4517 & 0.326424 \tabularnewline
11 & -0.130106 & -1.0885 & 0.140043 \tabularnewline
12 & 0.509921 & 4.2663 & 3.1e-05 \tabularnewline
13 & -0.099946 & -0.8362 & 0.202942 \tabularnewline
14 & -0.136906 & -1.1454 & 0.127964 \tabularnewline
15 & -0.090789 & -0.7596 & 0.225023 \tabularnewline
16 & -0.05256 & -0.4397 & 0.330738 \tabularnewline
17 & 0.292131 & 2.4441 & 0.008521 \tabularnewline
18 & -0.293525 & -2.4558 & 0.008271 \tabularnewline
19 & 0.176764 & 1.4789 & 0.071825 \tabularnewline
20 & -0.028656 & -0.2398 & 0.405611 \tabularnewline
21 & -0.039105 & -0.3272 & 0.372256 \tabularnewline
22 & -0.080787 & -0.6759 & 0.250663 \tabularnewline
23 & -0.141415 & -1.1832 & 0.120374 \tabularnewline
24 & 0.462377 & 3.8685 & 0.000121 \tabularnewline
25 & -0.053653 & -0.4489 & 0.327448 \tabularnewline
26 & -0.186107 & -1.5571 & 0.061981 \tabularnewline
27 & -0.066438 & -0.5559 & 0.29004 \tabularnewline
28 & -0.022122 & -0.1851 & 0.426847 \tabularnewline
29 & 0.248601 & 2.0799 & 0.020597 \tabularnewline
30 & -0.234387 & -1.961 & 0.026928 \tabularnewline
31 & 0.14812 & 1.2393 & 0.109695 \tabularnewline
32 & -0.093322 & -0.7808 & 0.21878 \tabularnewline
33 & 0.038127 & 0.319 & 0.375341 \tabularnewline
34 & -0.055464 & -0.464 & 0.322028 \tabularnewline
35 & -0.118131 & -0.9884 & 0.163192 \tabularnewline
36 & 0.353305 & 2.956 & 0.002123 \tabularnewline
37 & -0.11157 & -0.9335 & 0.176895 \tabularnewline
38 & -0.044825 & -0.375 & 0.354385 \tabularnewline
39 & -0.110861 & -0.9275 & 0.178418 \tabularnewline
40 & 0.006425 & 0.0538 & 0.478643 \tabularnewline
41 & 0.183669 & 1.5367 & 0.064439 \tabularnewline
42 & -0.156709 & -1.3111 & 0.097051 \tabularnewline
43 & 0.069829 & 0.5842 & 0.280472 \tabularnewline
44 & -0.033953 & -0.2841 & 0.388597 \tabularnewline
45 & 0.020761 & 0.1737 & 0.431302 \tabularnewline
46 & -0.030267 & -0.2532 & 0.400414 \tabularnewline
47 & -0.101345 & -0.8479 & 0.199689 \tabularnewline
48 & 0.260724 & 2.1814 & 0.016258 \tabularnewline
\hline
\end{tabular}
%Source: https://freestatistics.org/blog/index.php?pk=224667&T=1

[TABLE]
[ROW][C]Autocorrelation Function[/C][/ROW]
[ROW][C]Time lag k[/C][C]ACF(k)[/C][C]T-STAT[/C][C]P-value[/C][/ROW]
[ROW][C]1[/C][C]-0.379595[/C][C]-3.1759[/C][C]0.001111[/C][/ROW]
[ROW][C]2[/C][C]-0.102695[/C][C]-0.8592[/C][C]0.196578[/C][/ROW]
[ROW][C]3[/C][C]-0.083519[/C][C]-0.6988[/C][C]0.243505[/C][/ROW]
[ROW][C]4[/C][C]-0.056545[/C][C]-0.4731[/C][C]0.318812[/C][/ROW]
[ROW][C]5[/C][C]0.322246[/C][C]2.6961[/C][C]0.00439[/C][/ROW]
[ROW][C]6[/C][C]-0.355569[/C][C]-2.9749[/C][C]0.00201[/C][/ROW]
[ROW][C]7[/C][C]0.214999[/C][C]1.7988[/C][C]0.03818[/C][/ROW]
[ROW][C]8[/C][C]0.027113[/C][C]0.2268[/C][C]0.410602[/C][/ROW]
[ROW][C]9[/C][C]-0.151793[/C][C]-1.27[/C][C]0.104147[/C][/ROW]
[ROW][C]10[/C][C]-0.053994[/C][C]-0.4517[/C][C]0.326424[/C][/ROW]
[ROW][C]11[/C][C]-0.130106[/C][C]-1.0885[/C][C]0.140043[/C][/ROW]
[ROW][C]12[/C][C]0.509921[/C][C]4.2663[/C][C]3.1e-05[/C][/ROW]
[ROW][C]13[/C][C]-0.099946[/C][C]-0.8362[/C][C]0.202942[/C][/ROW]
[ROW][C]14[/C][C]-0.136906[/C][C]-1.1454[/C][C]0.127964[/C][/ROW]
[ROW][C]15[/C][C]-0.090789[/C][C]-0.7596[/C][C]0.225023[/C][/ROW]
[ROW][C]16[/C][C]-0.05256[/C][C]-0.4397[/C][C]0.330738[/C][/ROW]
[ROW][C]17[/C][C]0.292131[/C][C]2.4441[/C][C]0.008521[/C][/ROW]
[ROW][C]18[/C][C]-0.293525[/C][C]-2.4558[/C][C]0.008271[/C][/ROW]
[ROW][C]19[/C][C]0.176764[/C][C]1.4789[/C][C]0.071825[/C][/ROW]
[ROW][C]20[/C][C]-0.028656[/C][C]-0.2398[/C][C]0.405611[/C][/ROW]
[ROW][C]21[/C][C]-0.039105[/C][C]-0.3272[/C][C]0.372256[/C][/ROW]
[ROW][C]22[/C][C]-0.080787[/C][C]-0.6759[/C][C]0.250663[/C][/ROW]
[ROW][C]23[/C][C]-0.141415[/C][C]-1.1832[/C][C]0.120374[/C][/ROW]
[ROW][C]24[/C][C]0.462377[/C][C]3.8685[/C][C]0.000121[/C][/ROW]
[ROW][C]25[/C][C]-0.053653[/C][C]-0.4489[/C][C]0.327448[/C][/ROW]
[ROW][C]26[/C][C]-0.186107[/C][C]-1.5571[/C][C]0.061981[/C][/ROW]
[ROW][C]27[/C][C]-0.066438[/C][C]-0.5559[/C][C]0.29004[/C][/ROW]
[ROW][C]28[/C][C]-0.022122[/C][C]-0.1851[/C][C]0.426847[/C][/ROW]
[ROW][C]29[/C][C]0.248601[/C][C]2.0799[/C][C]0.020597[/C][/ROW]
[ROW][C]30[/C][C]-0.234387[/C][C]-1.961[/C][C]0.026928[/C][/ROW]
[ROW][C]31[/C][C]0.14812[/C][C]1.2393[/C][C]0.109695[/C][/ROW]
[ROW][C]32[/C][C]-0.093322[/C][C]-0.7808[/C][C]0.21878[/C][/ROW]
[ROW][C]33[/C][C]0.038127[/C][C]0.319[/C][C]0.375341[/C][/ROW]
[ROW][C]34[/C][C]-0.055464[/C][C]-0.464[/C][C]0.322028[/C][/ROW]
[ROW][C]35[/C][C]-0.118131[/C][C]-0.9884[/C][C]0.163192[/C][/ROW]
[ROW][C]36[/C][C]0.353305[/C][C]2.956[/C][C]0.002123[/C][/ROW]
[ROW][C]37[/C][C]-0.11157[/C][C]-0.9335[/C][C]0.176895[/C][/ROW]
[ROW][C]38[/C][C]-0.044825[/C][C]-0.375[/C][C]0.354385[/C][/ROW]
[ROW][C]39[/C][C]-0.110861[/C][C]-0.9275[/C][C]0.178418[/C][/ROW]
[ROW][C]40[/C][C]0.006425[/C][C]0.0538[/C][C]0.478643[/C][/ROW]
[ROW][C]41[/C][C]0.183669[/C][C]1.5367[/C][C]0.064439[/C][/ROW]
[ROW][C]42[/C][C]-0.156709[/C][C]-1.3111[/C][C]0.097051[/C][/ROW]
[ROW][C]43[/C][C]0.069829[/C][C]0.5842[/C][C]0.280472[/C][/ROW]
[ROW][C]44[/C][C]-0.033953[/C][C]-0.2841[/C][C]0.388597[/C][/ROW]
[ROW][C]45[/C][C]0.020761[/C][C]0.1737[/C][C]0.431302[/C][/ROW]
[ROW][C]46[/C][C]-0.030267[/C][C]-0.2532[/C][C]0.400414[/C][/ROW]
[ROW][C]47[/C][C]-0.101345[/C][C]-0.8479[/C][C]0.199689[/C][/ROW]
[ROW][C]48[/C][C]0.260724[/C][C]2.1814[/C][C]0.016258[/C][/ROW]
[/TABLE]
Source: https://freestatistics.org/blog/index.php?pk=224667&T=1

Globally Unique Identifier (entire table): ba.freestatistics.org/blog/index.php?pk=224667&T=1

As an alternative you can also use a QR Code:  

The GUIDs for individual cells are displayed in the table below:

Autocorrelation Function
Time lag kACF(k)T-STATP-value
1-0.379595-3.17590.001111
2-0.102695-0.85920.196578
3-0.083519-0.69880.243505
4-0.056545-0.47310.318812
50.3222462.69610.00439
6-0.355569-2.97490.00201
70.2149991.79880.03818
80.0271130.22680.410602
9-0.151793-1.270.104147
10-0.053994-0.45170.326424
11-0.130106-1.08850.140043
120.5099214.26633.1e-05
13-0.099946-0.83620.202942
14-0.136906-1.14540.127964
15-0.090789-0.75960.225023
16-0.05256-0.43970.330738
170.2921312.44410.008521
18-0.293525-2.45580.008271
190.1767641.47890.071825
20-0.028656-0.23980.405611
21-0.039105-0.32720.372256
22-0.080787-0.67590.250663
23-0.141415-1.18320.120374
240.4623773.86850.000121
25-0.053653-0.44890.327448
26-0.186107-1.55710.061981
27-0.066438-0.55590.29004
28-0.022122-0.18510.426847
290.2486012.07990.020597
30-0.234387-1.9610.026928
310.148121.23930.109695
32-0.093322-0.78080.21878
330.0381270.3190.375341
34-0.055464-0.4640.322028
35-0.118131-0.98840.163192
360.3533052.9560.002123
37-0.11157-0.93350.176895
38-0.044825-0.3750.354385
39-0.110861-0.92750.178418
400.0064250.05380.478643
410.1836691.53670.064439
42-0.156709-1.31110.097051
430.0698290.58420.280472
44-0.033953-0.28410.388597
450.0207610.17370.431302
46-0.030267-0.25320.400414
47-0.101345-0.84790.199689
480.2607242.18140.016258


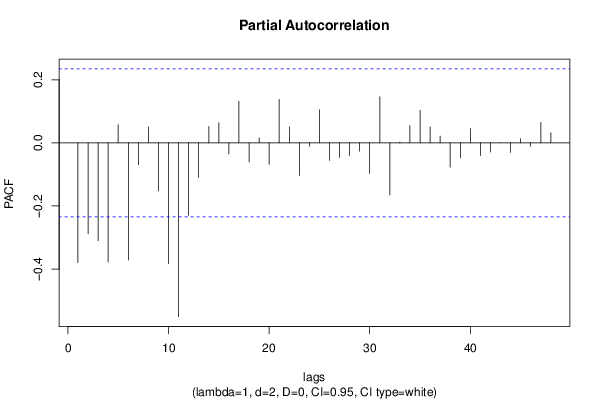
Partial Autocorrelation Function
Time lag kPACF(k)T-STATP-value
1-0.379595-3.17590.001111
2-0.288334-2.41240.009236
3-0.309897-2.59280.005791
4-0.377315-3.15680.001176
50.0573050.47940.316559
6-0.37126-3.10620.001368
7-0.06914-0.57850.282402
80.0505390.42280.336854
9-0.152358-1.27470.103312
10-0.383228-3.20630.001014
11-0.550928-4.60949e-06
12-0.229573-1.92070.029419
13-0.109434-0.91560.181512
140.0516470.43210.333496
150.0636370.53240.298058
16-0.035309-0.29540.384275
170.1316251.10130.137279
18-0.060452-0.50580.307302
190.0155330.130.448485
20-0.068303-0.57150.284759
210.1374891.15030.126965
220.0503160.4210.337531
23-0.103464-0.86560.194821
24-0.01053-0.08810.465024
250.1049190.87780.191524
26-0.055552-0.46480.321765
27-0.045949-0.38440.350911
28-0.039873-0.33360.369839
29-0.026288-0.21990.413279
30-0.096705-0.80910.210602
310.1462421.22350.112613
32-0.165467-1.38440.085318
330.0023370.01960.492228
340.0547830.45830.324061
350.1029210.86110.196062
360.050190.41990.337914
370.0212650.17790.42965
38-0.076908-0.64350.261015
39-0.047279-0.39560.346814
400.0456370.38180.351873
41-0.039877-0.33360.369827
42-0.029075-0.24330.404257
43-8.1e-05-7e-040.499729
44-0.030123-0.2520.400879
450.0131150.10970.456471
46-0.010741-0.08990.464326
470.0645780.54030.295353
480.0320570.26820.394664

\begin{tabular}{lllllllll}
\hline
Partial Autocorrelation Function \tabularnewline
Time lag k & PACF(k) & T-STAT & P-value \tabularnewline
1 & -0.379595 & -3.1759 & 0.001111 \tabularnewline
2 & -0.288334 & -2.4124 & 0.009236 \tabularnewline
3 & -0.309897 & -2.5928 & 0.005791 \tabularnewline
4 & -0.377315 & -3.1568 & 0.001176 \tabularnewline
5 & 0.057305 & 0.4794 & 0.316559 \tabularnewline
6 & -0.37126 & -3.1062 & 0.001368 \tabularnewline
7 & -0.06914 & -0.5785 & 0.282402 \tabularnewline
8 & 0.050539 & 0.4228 & 0.336854 \tabularnewline
9 & -0.152358 & -1.2747 & 0.103312 \tabularnewline
10 & -0.383228 & -3.2063 & 0.001014 \tabularnewline
11 & -0.550928 & -4.6094 & 9e-06 \tabularnewline
12 & -0.229573 & -1.9207 & 0.029419 \tabularnewline
13 & -0.109434 & -0.9156 & 0.181512 \tabularnewline
14 & 0.051647 & 0.4321 & 0.333496 \tabularnewline
15 & 0.063637 & 0.5324 & 0.298058 \tabularnewline
16 & -0.035309 & -0.2954 & 0.384275 \tabularnewline
17 & 0.131625 & 1.1013 & 0.137279 \tabularnewline
18 & -0.060452 & -0.5058 & 0.307302 \tabularnewline
19 & 0.015533 & 0.13 & 0.448485 \tabularnewline
20 & -0.068303 & -0.5715 & 0.284759 \tabularnewline
21 & 0.137489 & 1.1503 & 0.126965 \tabularnewline
22 & 0.050316 & 0.421 & 0.337531 \tabularnewline
23 & -0.103464 & -0.8656 & 0.194821 \tabularnewline
24 & -0.01053 & -0.0881 & 0.465024 \tabularnewline
25 & 0.104919 & 0.8778 & 0.191524 \tabularnewline
26 & -0.055552 & -0.4648 & 0.321765 \tabularnewline
27 & -0.045949 & -0.3844 & 0.350911 \tabularnewline
28 & -0.039873 & -0.3336 & 0.369839 \tabularnewline
29 & -0.026288 & -0.2199 & 0.413279 \tabularnewline
30 & -0.096705 & -0.8091 & 0.210602 \tabularnewline
31 & 0.146242 & 1.2235 & 0.112613 \tabularnewline
32 & -0.165467 & -1.3844 & 0.085318 \tabularnewline
33 & 0.002337 & 0.0196 & 0.492228 \tabularnewline
34 & 0.054783 & 0.4583 & 0.324061 \tabularnewline
35 & 0.102921 & 0.8611 & 0.196062 \tabularnewline
36 & 0.05019 & 0.4199 & 0.337914 \tabularnewline
37 & 0.021265 & 0.1779 & 0.42965 \tabularnewline
38 & -0.076908 & -0.6435 & 0.261015 \tabularnewline
39 & -0.047279 & -0.3956 & 0.346814 \tabularnewline
40 & 0.045637 & 0.3818 & 0.351873 \tabularnewline
41 & -0.039877 & -0.3336 & 0.369827 \tabularnewline
42 & -0.029075 & -0.2433 & 0.404257 \tabularnewline
43 & -8.1e-05 & -7e-04 & 0.499729 \tabularnewline
44 & -0.030123 & -0.252 & 0.400879 \tabularnewline
45 & 0.013115 & 0.1097 & 0.456471 \tabularnewline
46 & -0.010741 & -0.0899 & 0.464326 \tabularnewline
47 & 0.064578 & 0.5403 & 0.295353 \tabularnewline
48 & 0.032057 & 0.2682 & 0.394664 \tabularnewline
\hline
\end{tabular}
%Source: https://freestatistics.org/blog/index.php?pk=224667&T=2

[TABLE]
[ROW][C]Partial Autocorrelation Function[/C][/ROW]
[ROW][C]Time lag k[/C][C]PACF(k)[/C][C]T-STAT[/C][C]P-value[/C][/ROW]
[ROW][C]1[/C][C]-0.379595[/C][C]-3.1759[/C][C]0.001111[/C][/ROW]
[ROW][C]2[/C][C]-0.288334[/C][C]-2.4124[/C][C]0.009236[/C][/ROW]
[ROW][C]3[/C][C]-0.309897[/C][C]-2.5928[/C][C]0.005791[/C][/ROW]
[ROW][C]4[/C][C]-0.377315[/C][C]-3.1568[/C][C]0.001176[/C][/ROW]
[ROW][C]5[/C][C]0.057305[/C][C]0.4794[/C][C]0.316559[/C][/ROW]
[ROW][C]6[/C][C]-0.37126[/C][C]-3.1062[/C][C]0.001368[/C][/ROW]
[ROW][C]7[/C][C]-0.06914[/C][C]-0.5785[/C][C]0.282402[/C][/ROW]
[ROW][C]8[/C][C]0.050539[/C][C]0.4228[/C][C]0.336854[/C][/ROW]
[ROW][C]9[/C][C]-0.152358[/C][C]-1.2747[/C][C]0.103312[/C][/ROW]
[ROW][C]10[/C][C]-0.383228[/C][C]-3.2063[/C][C]0.001014[/C][/ROW]
[ROW][C]11[/C][C]-0.550928[/C][C]-4.6094[/C][C]9e-06[/C][/ROW]
[ROW][C]12[/C][C]-0.229573[/C][C]-1.9207[/C][C]0.029419[/C][/ROW]
[ROW][C]13[/C][C]-0.109434[/C][C]-0.9156[/C][C]0.181512[/C][/ROW]
[ROW][C]14[/C][C]0.051647[/C][C]0.4321[/C][C]0.333496[/C][/ROW]
[ROW][C]15[/C][C]0.063637[/C][C]0.5324[/C][C]0.298058[/C][/ROW]
[ROW][C]16[/C][C]-0.035309[/C][C]-0.2954[/C][C]0.384275[/C][/ROW]
[ROW][C]17[/C][C]0.131625[/C][C]1.1013[/C][C]0.137279[/C][/ROW]
[ROW][C]18[/C][C]-0.060452[/C][C]-0.5058[/C][C]0.307302[/C][/ROW]
[ROW][C]19[/C][C]0.015533[/C][C]0.13[/C][C]0.448485[/C][/ROW]
[ROW][C]20[/C][C]-0.068303[/C][C]-0.5715[/C][C]0.284759[/C][/ROW]
[ROW][C]21[/C][C]0.137489[/C][C]1.1503[/C][C]0.126965[/C][/ROW]
[ROW][C]22[/C][C]0.050316[/C][C]0.421[/C][C]0.337531[/C][/ROW]
[ROW][C]23[/C][C]-0.103464[/C][C]-0.8656[/C][C]0.194821[/C][/ROW]
[ROW][C]24[/C][C]-0.01053[/C][C]-0.0881[/C][C]0.465024[/C][/ROW]
[ROW][C]25[/C][C]0.104919[/C][C]0.8778[/C][C]0.191524[/C][/ROW]
[ROW][C]26[/C][C]-0.055552[/C][C]-0.4648[/C][C]0.321765[/C][/ROW]
[ROW][C]27[/C][C]-0.045949[/C][C]-0.3844[/C][C]0.350911[/C][/ROW]
[ROW][C]28[/C][C]-0.039873[/C][C]-0.3336[/C][C]0.369839[/C][/ROW]
[ROW][C]29[/C][C]-0.026288[/C][C]-0.2199[/C][C]0.413279[/C][/ROW]
[ROW][C]30[/C][C]-0.096705[/C][C]-0.8091[/C][C]0.210602[/C][/ROW]
[ROW][C]31[/C][C]0.146242[/C][C]1.2235[/C][C]0.112613[/C][/ROW]
[ROW][C]32[/C][C]-0.165467[/C][C]-1.3844[/C][C]0.085318[/C][/ROW]
[ROW][C]33[/C][C]0.002337[/C][C]0.0196[/C][C]0.492228[/C][/ROW]
[ROW][C]34[/C][C]0.054783[/C][C]0.4583[/C][C]0.324061[/C][/ROW]
[ROW][C]35[/C][C]0.102921[/C][C]0.8611[/C][C]0.196062[/C][/ROW]
[ROW][C]36[/C][C]0.05019[/C][C]0.4199[/C][C]0.337914[/C][/ROW]
[ROW][C]37[/C][C]0.021265[/C][C]0.1779[/C][C]0.42965[/C][/ROW]
[ROW][C]38[/C][C]-0.076908[/C][C]-0.6435[/C][C]0.261015[/C][/ROW]
[ROW][C]39[/C][C]-0.047279[/C][C]-0.3956[/C][C]0.346814[/C][/ROW]
[ROW][C]40[/C][C]0.045637[/C][C]0.3818[/C][C]0.351873[/C][/ROW]
[ROW][C]41[/C][C]-0.039877[/C][C]-0.3336[/C][C]0.369827[/C][/ROW]
[ROW][C]42[/C][C]-0.029075[/C][C]-0.2433[/C][C]0.404257[/C][/ROW]
[ROW][C]43[/C][C]-8.1e-05[/C][C]-7e-04[/C][C]0.499729[/C][/ROW]
[ROW][C]44[/C][C]-0.030123[/C][C]-0.252[/C][C]0.400879[/C][/ROW]
[ROW][C]45[/C][C]0.013115[/C][C]0.1097[/C][C]0.456471[/C][/ROW]
[ROW][C]46[/C][C]-0.010741[/C][C]-0.0899[/C][C]0.464326[/C][/ROW]
[ROW][C]47[/C][C]0.064578[/C][C]0.5403[/C][C]0.295353[/C][/ROW]
[ROW][C]48[/C][C]0.032057[/C][C]0.2682[/C][C]0.394664[/C][/ROW]
[/TABLE]
Source: https://freestatistics.org/blog/index.php?pk=224667&T=2

Globally Unique Identifier (entire table): ba.freestatistics.org/blog/index.php?pk=224667&T=2

As an alternative you can also use a QR Code:  

The GUIDs for individual cells are displayed in the table below:

Partial Autocorrelation Function
Time lag kPACF(k)T-STATP-value
1-0.379595-3.17590.001111
2-0.288334-2.41240.009236
3-0.309897-2.59280.005791
4-0.377315-3.15680.001176
50.0573050.47940.316559
6-0.37126-3.10620.001368
7-0.06914-0.57850.282402
80.0505390.42280.336854
9-0.152358-1.27470.103312
10-0.383228-3.20630.001014
11-0.550928-4.60949e-06
12-0.229573-1.92070.029419
13-0.109434-0.91560.181512
140.0516470.43210.333496
150.0636370.53240.298058
16-0.035309-0.29540.384275
170.1316251.10130.137279
18-0.060452-0.50580.307302
190.0155330.130.448485
20-0.068303-0.57150.284759
210.1374891.15030.126965
220.0503160.4210.337531
23-0.103464-0.86560.194821
24-0.01053-0.08810.465024
250.1049190.87780.191524
26-0.055552-0.46480.321765
27-0.045949-0.38440.350911
28-0.039873-0.33360.369839
29-0.026288-0.21990.413279
30-0.096705-0.80910.210602
310.1462421.22350.112613
32-0.165467-1.38440.085318
330.0023370.01960.492228
340.0547830.45830.324061
350.1029210.86110.196062
360.050190.41990.337914
370.0212650.17790.42965
38-0.076908-0.64350.261015
39-0.047279-0.39560.346814
400.0456370.38180.351873
41-0.039877-0.33360.369827
42-0.029075-0.24330.404257
43-8.1e-05-7e-040.499729
44-0.030123-0.2520.400879
450.0131150.10970.456471
46-0.010741-0.08990.464326
470.0645780.54030.295353
480.0320570.26820.394664


Parameters (Session):
par1 = 48 ; par2 = 1 ; par3 = 2 ; par4 = 0 ; par5 = 12 ; par6 = White Noise ; par7 = 0.95 ;
Parameters (R input):
par1 = 48 ; par2 = 1 ; par3 = 2 ; par4 = 0 ; par5 = 12 ; par6 = White Noise ; par7 = 0.95 ; par8 = ;
R code (references can be found in the software module):
if (par1 == 'Default') {
par1 = 10*log10(length(x))
} else {
par1 <- as.numeric(par1)
}
par2 <- as.numeric(par2)
par3 <- as.numeric(par3)
par4 <- as.numeric(par4)
par5 <- as.numeric(par5)
if (par6 == 'White Noise') par6 <- 'white' else par6 <- 'ma'
par7 <- as.numeric(par7)
if (par8 != '') par8 <- as.numeric(par8)
ox <- x
if (par8 == '') {
if (par2 == 0) {
x <- log(x)
} else {
x <- (x ^ par2 - 1) / par2
}
} else {
x <- log(x,base=par8)
}
if (par3 > 0) x <- diff(x,lag=1,difference=par3)
if (par4 > 0) x <- diff(x,lag=par5,difference=par4)
bitmap(file='picts.png')
op <- par(mfrow=c(2,1))
plot(ox,type='l',main='Original Time Series',xlab='time',ylab='value')
if (par8=='') {
mytitle <- paste('Working Time Series (lambda=',par2,', d=',par3,', D=',par4,')',sep='')
mysub <- paste('(lambda=',par2,', d=',par3,', D=',par4,', CI=', par7, ', CI type=',par6,')',sep='')
} else {
mytitle <- paste('Working Time Series (base=',par8,', d=',par3,', D=',par4,')',sep='')
mysub <- paste('(base=',par8,', d=',par3,', D=',par4,', CI=', par7, ', CI type=',par6,')',sep='')
}
plot(x,type='l', main=mytitle,xlab='time',ylab='value')
par(op)
dev.off()
bitmap(file='pic1.png')
racf <- acf(x, par1, main='Autocorrelation', xlab='time lag', ylab='ACF', ci.type=par6, ci=par7, sub=mysub)
dev.off()
bitmap(file='pic2.png')
rpacf <- pacf(x,par1,main='Partial Autocorrelation',xlab='lags',ylab='PACF',sub=mysub)
dev.off()
(myacf <- c(racf$acf))
(mypacf <- c(rpacf$acf))
lengthx <- length(x)
sqrtn <- sqrt(lengthx)
load(file='createtable')
a<-table.start()
a<-table.row.start(a)
a<-table.element(a,'Autocorrelation Function',4,TRUE)
a<-table.row.end(a)
a<-table.row.start(a)
a<-table.element(a,'Time lag k',header=TRUE)
a<-table.element(a,hyperlink('basics.htm','ACF(k)','click here for more information about the Autocorrelation Function'),header=TRUE)
a<-table.element(a,'T-STAT',header=TRUE)
a<-table.element(a,'P-value',header=TRUE)
a<-table.row.end(a)
for (i in 2:(par1+1)) {
a<-table.row.start(a)
a<-table.element(a,i-1,header=TRUE)
a<-table.element(a,round(myacf[i],6))
mytstat <- myacf[i]*sqrtn
a<-table.element(a,round(mytstat,4))
a<-table.element(a,round(1-pt(abs(mytstat),lengthx),6))
a<-table.row.end(a)
}
a<-table.end(a)
table.save(a,file='mytable.tab')
a<-table.start()
a<-table.row.start(a)
a<-table.element(a,'Partial Autocorrelation Function',4,TRUE)
a<-table.row.end(a)
a<-table.row.start(a)
a<-table.element(a,'Time lag k',header=TRUE)
a<-table.element(a,hyperlink('basics.htm','PACF(k)','click here for more information about the Partial Autocorrelation Function'),header=TRUE)
a<-table.element(a,'T-STAT',header=TRUE)
a<-table.element(a,'P-value',header=TRUE)
a<-table.row.end(a)
for (i in 1:par1) {
a<-table.row.start(a)
a<-table.element(a,i,header=TRUE)
a<-table.element(a,round(mypacf[i],6))
mytstat <- mypacf[i]*sqrtn
a<-table.element(a,round(mytstat,4))
a<-table.element(a,round(1-pt(abs(mytstat),lengthx),6))
a<-table.row.end(a)
}
a<-table.end(a)
table.save(a,file='mytable1.tab')