Free Statistics

of Irreproducible Research!

Author's title

Author*Unverified author*
R Software Modulerwasp_autocorrelation.wasp
Title produced by software(Partial) Autocorrelation Function
Date of computationWed, 13 Nov 2013 04:12:56 -0500
Cite this page as followsStatistical Computations at FreeStatistics.org, Office for Research Development and Education, URL https://freestatistics.org/blog/index.php?v=date/2013/Nov/13/t1384333992zcmdcxx4n5m4749.htm/, Retrieved Mon, 29 Apr 2024 03:35:59 +0000
Statistical Computations at FreeStatistics.org, Office for Research Development and Education, URL https://freestatistics.org/blog/index.php?pk=224665, Retrieved Mon, 29 Apr 2024 03:35:59 +0000
QR Codes:

Original text written by user:
IsPrivate?No (this computation is public)
User-defined keywords
Estimated Impact58
Family? (F = Feedback message, R = changed R code, M = changed R Module, P = changed Parameters, D = changed Data)
-       [(Partial) Autocorrelation Function] [] [2013-11-13 09:12:56] [17b6b1d507219cce54aa3edb43843a55] [Current]
Feedback Forum

Post a new message
Dataseries X:
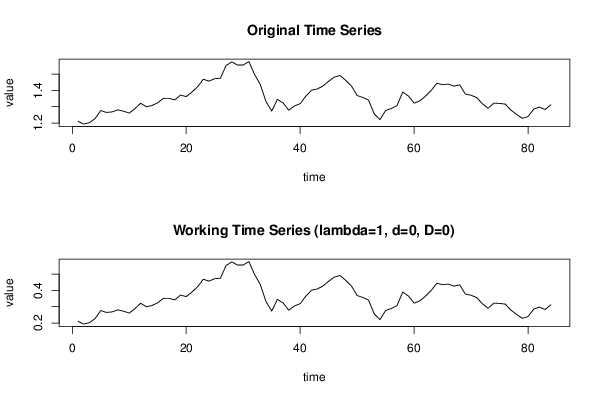
1,2103
1,1938
1,202
1,2271
1,277
1,265
1,2684
1,2811
1,2727
1,2611
1,2881
1,3213
1,2999
1,3074
1,3242
1,3516
1,3511
1,3419
1,3716
1,3622
1,3896
1,4227
1,4684
1,457
1,4718
1,4748
1,5527
1,5751
1,5557
1,5553
1,577
1,4975
1,4369
1,3322
1,2732
1,3449
1,3239
1,2785
1,305
1,319
1,365
1,4016
1,4088
1,4268
1,4562
1,4816
1,4914
1,4614
1,4272
1,3686
1,3569
1,3406
1,2565
1,2209
1,277
1,2894
1,3067
1,3898
1,3661
1,322
1,336
1,3649
1,3999
1,4442
1,4349
1,4388
1,4264
1,4343
1,377
1,3706
1,3556
1,3179
1,2905
1,3224
1,3201
1,3162
1,2789
1,2526
1,2288
1,24
1,2856
1,2974
1,2828
1,3119


Summary of computational transaction
Raw Inputview raw input (R code)
Raw Outputview raw output of R engine
Computing time3 seconds
R Server'Gwilym Jenkins' @ jenkins.wessa.net

\begin{tabular}{lllllllll}
\hline
Summary of computational transaction \tabularnewline
Raw Input & view raw input (R code)  \tabularnewline
Raw Output & view raw output of R engine  \tabularnewline
Computing time & 3 seconds \tabularnewline
R Server & 'Gwilym Jenkins' @ jenkins.wessa.net \tabularnewline
\hline
\end{tabular}
%Source: https://freestatistics.org/blog/index.php?pk=224665&T=0

[TABLE]
[ROW][C]Summary of computational transaction[/C][/ROW]
[ROW][C]Raw Input[/C][C]view raw input (R code) [/C][/ROW]
[ROW][C]Raw Output[/C][C]view raw output of R engine [/C][/ROW]
[ROW][C]Computing time[/C][C]3 seconds[/C][/ROW]
[ROW][C]R Server[/C][C]'Gwilym Jenkins' @ jenkins.wessa.net[/C][/ROW]
[/TABLE]
Source: https://freestatistics.org/blog/index.php?pk=224665&T=0

Globally Unique Identifier (entire table): ba.freestatistics.org/blog/index.php?pk=224665&T=0

As an alternative you can also use a QR Code:  

The GUIDs for individual cells are displayed in the table below:

Summary of computational transaction
Raw Inputview raw input (R code)
Raw Outputview raw output of R engine
Computing time3 seconds
R Server'Gwilym Jenkins' @ jenkins.wessa.net


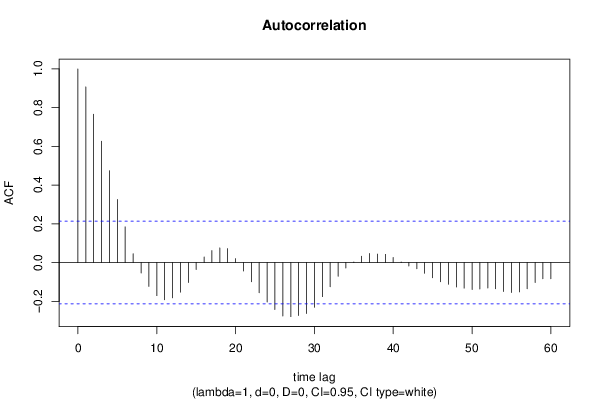
Autocorrelation Function
Time lag kACF(k)T-STATP-value
10.9072618.31520
20.7657827.01850
30.626945.7460
40.4742124.34621.9e-05
50.3254192.98250.001871
60.1843451.68960.047411
70.0453510.41570.339362
8-0.054053-0.49540.310804
9-0.123155-1.12870.131112
10-0.170792-1.56530.060633
11-0.191753-1.75740.041243
12-0.18226-1.67040.049277
13-0.152934-1.40170.082349
14-0.102806-0.94220.174387
15-0.035618-0.32640.37245
160.0290710.26640.395275
170.0618830.56720.286056
180.0757140.69390.244822
190.0718820.65880.25591
200.0202670.18570.426545
21-0.043586-0.39950.345278
22-0.099013-0.90750.183378
23-0.155754-1.42750.07857
24-0.204077-1.87040.032456
25-0.242722-2.22460.014395
26-0.276478-2.5340.006567
27-0.279373-2.56050.00612
28-0.27317-2.50360.007114
29-0.262887-2.40940.009082
30-0.230441-2.1120.018827
31-0.175874-1.61190.055366
32-0.125049-1.14610.127506
33-0.070831-0.64920.258998
34-0.027973-0.25640.399145
350.0031010.02840.488695
360.0328550.30110.382032
370.0471770.43240.333284
380.0436260.39980.345144
390.042370.38830.349379
400.0266060.24380.403972
410.0033510.03070.487785
42-0.017563-0.1610.436254
43-0.032141-0.29460.384523
44-0.055023-0.50430.307686
45-0.078369-0.71830.237294
46-0.099095-0.90820.18318
47-0.112192-1.02830.15339
48-0.125992-1.15470.125736
49-0.132159-1.21130.114597
50-0.139572-1.27920.102174
51-0.136635-1.25230.106972
52-0.131011-1.20070.116615
53-0.135448-1.24140.108956
54-0.149459-1.36980.087198
55-0.155001-1.42060.079566
56-0.151386-1.38750.084484
57-0.135495-1.24180.108877
58-0.102706-0.94130.174621
59-0.083328-0.76370.223589
60-0.083573-0.7660.222925

\begin{tabular}{lllllllll}
\hline
Autocorrelation Function \tabularnewline
Time lag k & ACF(k) & T-STAT & P-value \tabularnewline
1 & 0.907261 & 8.3152 & 0 \tabularnewline
2 & 0.765782 & 7.0185 & 0 \tabularnewline
3 & 0.62694 & 5.746 & 0 \tabularnewline
4 & 0.474212 & 4.3462 & 1.9e-05 \tabularnewline
5 & 0.325419 & 2.9825 & 0.001871 \tabularnewline
6 & 0.184345 & 1.6896 & 0.047411 \tabularnewline
7 & 0.045351 & 0.4157 & 0.339362 \tabularnewline
8 & -0.054053 & -0.4954 & 0.310804 \tabularnewline
9 & -0.123155 & -1.1287 & 0.131112 \tabularnewline
10 & -0.170792 & -1.5653 & 0.060633 \tabularnewline
11 & -0.191753 & -1.7574 & 0.041243 \tabularnewline
12 & -0.18226 & -1.6704 & 0.049277 \tabularnewline
13 & -0.152934 & -1.4017 & 0.082349 \tabularnewline
14 & -0.102806 & -0.9422 & 0.174387 \tabularnewline
15 & -0.035618 & -0.3264 & 0.37245 \tabularnewline
16 & 0.029071 & 0.2664 & 0.395275 \tabularnewline
17 & 0.061883 & 0.5672 & 0.286056 \tabularnewline
18 & 0.075714 & 0.6939 & 0.244822 \tabularnewline
19 & 0.071882 & 0.6588 & 0.25591 \tabularnewline
20 & 0.020267 & 0.1857 & 0.426545 \tabularnewline
21 & -0.043586 & -0.3995 & 0.345278 \tabularnewline
22 & -0.099013 & -0.9075 & 0.183378 \tabularnewline
23 & -0.155754 & -1.4275 & 0.07857 \tabularnewline
24 & -0.204077 & -1.8704 & 0.032456 \tabularnewline
25 & -0.242722 & -2.2246 & 0.014395 \tabularnewline
26 & -0.276478 & -2.534 & 0.006567 \tabularnewline
27 & -0.279373 & -2.5605 & 0.00612 \tabularnewline
28 & -0.27317 & -2.5036 & 0.007114 \tabularnewline
29 & -0.262887 & -2.4094 & 0.009082 \tabularnewline
30 & -0.230441 & -2.112 & 0.018827 \tabularnewline
31 & -0.175874 & -1.6119 & 0.055366 \tabularnewline
32 & -0.125049 & -1.1461 & 0.127506 \tabularnewline
33 & -0.070831 & -0.6492 & 0.258998 \tabularnewline
34 & -0.027973 & -0.2564 & 0.399145 \tabularnewline
35 & 0.003101 & 0.0284 & 0.488695 \tabularnewline
36 & 0.032855 & 0.3011 & 0.382032 \tabularnewline
37 & 0.047177 & 0.4324 & 0.333284 \tabularnewline
38 & 0.043626 & 0.3998 & 0.345144 \tabularnewline
39 & 0.04237 & 0.3883 & 0.349379 \tabularnewline
40 & 0.026606 & 0.2438 & 0.403972 \tabularnewline
41 & 0.003351 & 0.0307 & 0.487785 \tabularnewline
42 & -0.017563 & -0.161 & 0.436254 \tabularnewline
43 & -0.032141 & -0.2946 & 0.384523 \tabularnewline
44 & -0.055023 & -0.5043 & 0.307686 \tabularnewline
45 & -0.078369 & -0.7183 & 0.237294 \tabularnewline
46 & -0.099095 & -0.9082 & 0.18318 \tabularnewline
47 & -0.112192 & -1.0283 & 0.15339 \tabularnewline
48 & -0.125992 & -1.1547 & 0.125736 \tabularnewline
49 & -0.132159 & -1.2113 & 0.114597 \tabularnewline
50 & -0.139572 & -1.2792 & 0.102174 \tabularnewline
51 & -0.136635 & -1.2523 & 0.106972 \tabularnewline
52 & -0.131011 & -1.2007 & 0.116615 \tabularnewline
53 & -0.135448 & -1.2414 & 0.108956 \tabularnewline
54 & -0.149459 & -1.3698 & 0.087198 \tabularnewline
55 & -0.155001 & -1.4206 & 0.079566 \tabularnewline
56 & -0.151386 & -1.3875 & 0.084484 \tabularnewline
57 & -0.135495 & -1.2418 & 0.108877 \tabularnewline
58 & -0.102706 & -0.9413 & 0.174621 \tabularnewline
59 & -0.083328 & -0.7637 & 0.223589 \tabularnewline
60 & -0.083573 & -0.766 & 0.222925 \tabularnewline
\hline
\end{tabular}
%Source: https://freestatistics.org/blog/index.php?pk=224665&T=1

[TABLE]
[ROW][C]Autocorrelation Function[/C][/ROW]
[ROW][C]Time lag k[/C][C]ACF(k)[/C][C]T-STAT[/C][C]P-value[/C][/ROW]
[ROW][C]1[/C][C]0.907261[/C][C]8.3152[/C][C]0[/C][/ROW]
[ROW][C]2[/C][C]0.765782[/C][C]7.0185[/C][C]0[/C][/ROW]
[ROW][C]3[/C][C]0.62694[/C][C]5.746[/C][C]0[/C][/ROW]
[ROW][C]4[/C][C]0.474212[/C][C]4.3462[/C][C]1.9e-05[/C][/ROW]
[ROW][C]5[/C][C]0.325419[/C][C]2.9825[/C][C]0.001871[/C][/ROW]
[ROW][C]6[/C][C]0.184345[/C][C]1.6896[/C][C]0.047411[/C][/ROW]
[ROW][C]7[/C][C]0.045351[/C][C]0.4157[/C][C]0.339362[/C][/ROW]
[ROW][C]8[/C][C]-0.054053[/C][C]-0.4954[/C][C]0.310804[/C][/ROW]
[ROW][C]9[/C][C]-0.123155[/C][C]-1.1287[/C][C]0.131112[/C][/ROW]
[ROW][C]10[/C][C]-0.170792[/C][C]-1.5653[/C][C]0.060633[/C][/ROW]
[ROW][C]11[/C][C]-0.191753[/C][C]-1.7574[/C][C]0.041243[/C][/ROW]
[ROW][C]12[/C][C]-0.18226[/C][C]-1.6704[/C][C]0.049277[/C][/ROW]
[ROW][C]13[/C][C]-0.152934[/C][C]-1.4017[/C][C]0.082349[/C][/ROW]
[ROW][C]14[/C][C]-0.102806[/C][C]-0.9422[/C][C]0.174387[/C][/ROW]
[ROW][C]15[/C][C]-0.035618[/C][C]-0.3264[/C][C]0.37245[/C][/ROW]
[ROW][C]16[/C][C]0.029071[/C][C]0.2664[/C][C]0.395275[/C][/ROW]
[ROW][C]17[/C][C]0.061883[/C][C]0.5672[/C][C]0.286056[/C][/ROW]
[ROW][C]18[/C][C]0.075714[/C][C]0.6939[/C][C]0.244822[/C][/ROW]
[ROW][C]19[/C][C]0.071882[/C][C]0.6588[/C][C]0.25591[/C][/ROW]
[ROW][C]20[/C][C]0.020267[/C][C]0.1857[/C][C]0.426545[/C][/ROW]
[ROW][C]21[/C][C]-0.043586[/C][C]-0.3995[/C][C]0.345278[/C][/ROW]
[ROW][C]22[/C][C]-0.099013[/C][C]-0.9075[/C][C]0.183378[/C][/ROW]
[ROW][C]23[/C][C]-0.155754[/C][C]-1.4275[/C][C]0.07857[/C][/ROW]
[ROW][C]24[/C][C]-0.204077[/C][C]-1.8704[/C][C]0.032456[/C][/ROW]
[ROW][C]25[/C][C]-0.242722[/C][C]-2.2246[/C][C]0.014395[/C][/ROW]
[ROW][C]26[/C][C]-0.276478[/C][C]-2.534[/C][C]0.006567[/C][/ROW]
[ROW][C]27[/C][C]-0.279373[/C][C]-2.5605[/C][C]0.00612[/C][/ROW]
[ROW][C]28[/C][C]-0.27317[/C][C]-2.5036[/C][C]0.007114[/C][/ROW]
[ROW][C]29[/C][C]-0.262887[/C][C]-2.4094[/C][C]0.009082[/C][/ROW]
[ROW][C]30[/C][C]-0.230441[/C][C]-2.112[/C][C]0.018827[/C][/ROW]
[ROW][C]31[/C][C]-0.175874[/C][C]-1.6119[/C][C]0.055366[/C][/ROW]
[ROW][C]32[/C][C]-0.125049[/C][C]-1.1461[/C][C]0.127506[/C][/ROW]
[ROW][C]33[/C][C]-0.070831[/C][C]-0.6492[/C][C]0.258998[/C][/ROW]
[ROW][C]34[/C][C]-0.027973[/C][C]-0.2564[/C][C]0.399145[/C][/ROW]
[ROW][C]35[/C][C]0.003101[/C][C]0.0284[/C][C]0.488695[/C][/ROW]
[ROW][C]36[/C][C]0.032855[/C][C]0.3011[/C][C]0.382032[/C][/ROW]
[ROW][C]37[/C][C]0.047177[/C][C]0.4324[/C][C]0.333284[/C][/ROW]
[ROW][C]38[/C][C]0.043626[/C][C]0.3998[/C][C]0.345144[/C][/ROW]
[ROW][C]39[/C][C]0.04237[/C][C]0.3883[/C][C]0.349379[/C][/ROW]
[ROW][C]40[/C][C]0.026606[/C][C]0.2438[/C][C]0.403972[/C][/ROW]
[ROW][C]41[/C][C]0.003351[/C][C]0.0307[/C][C]0.487785[/C][/ROW]
[ROW][C]42[/C][C]-0.017563[/C][C]-0.161[/C][C]0.436254[/C][/ROW]
[ROW][C]43[/C][C]-0.032141[/C][C]-0.2946[/C][C]0.384523[/C][/ROW]
[ROW][C]44[/C][C]-0.055023[/C][C]-0.5043[/C][C]0.307686[/C][/ROW]
[ROW][C]45[/C][C]-0.078369[/C][C]-0.7183[/C][C]0.237294[/C][/ROW]
[ROW][C]46[/C][C]-0.099095[/C][C]-0.9082[/C][C]0.18318[/C][/ROW]
[ROW][C]47[/C][C]-0.112192[/C][C]-1.0283[/C][C]0.15339[/C][/ROW]
[ROW][C]48[/C][C]-0.125992[/C][C]-1.1547[/C][C]0.125736[/C][/ROW]
[ROW][C]49[/C][C]-0.132159[/C][C]-1.2113[/C][C]0.114597[/C][/ROW]
[ROW][C]50[/C][C]-0.139572[/C][C]-1.2792[/C][C]0.102174[/C][/ROW]
[ROW][C]51[/C][C]-0.136635[/C][C]-1.2523[/C][C]0.106972[/C][/ROW]
[ROW][C]52[/C][C]-0.131011[/C][C]-1.2007[/C][C]0.116615[/C][/ROW]
[ROW][C]53[/C][C]-0.135448[/C][C]-1.2414[/C][C]0.108956[/C][/ROW]
[ROW][C]54[/C][C]-0.149459[/C][C]-1.3698[/C][C]0.087198[/C][/ROW]
[ROW][C]55[/C][C]-0.155001[/C][C]-1.4206[/C][C]0.079566[/C][/ROW]
[ROW][C]56[/C][C]-0.151386[/C][C]-1.3875[/C][C]0.084484[/C][/ROW]
[ROW][C]57[/C][C]-0.135495[/C][C]-1.2418[/C][C]0.108877[/C][/ROW]
[ROW][C]58[/C][C]-0.102706[/C][C]-0.9413[/C][C]0.174621[/C][/ROW]
[ROW][C]59[/C][C]-0.083328[/C][C]-0.7637[/C][C]0.223589[/C][/ROW]
[ROW][C]60[/C][C]-0.083573[/C][C]-0.766[/C][C]0.222925[/C][/ROW]
[/TABLE]
Source: https://freestatistics.org/blog/index.php?pk=224665&T=1

Globally Unique Identifier (entire table): ba.freestatistics.org/blog/index.php?pk=224665&T=1

As an alternative you can also use a QR Code:  

The GUIDs for individual cells are displayed in the table below:

Autocorrelation Function
Time lag kACF(k)T-STATP-value
10.9072618.31520
20.7657827.01850
30.626945.7460
40.4742124.34621.9e-05
50.3254192.98250.001871
60.1843451.68960.047411
70.0453510.41570.339362
8-0.054053-0.49540.310804
9-0.123155-1.12870.131112
10-0.170792-1.56530.060633
11-0.191753-1.75740.041243
12-0.18226-1.67040.049277
13-0.152934-1.40170.082349
14-0.102806-0.94220.174387
15-0.035618-0.32640.37245
160.0290710.26640.395275
170.0618830.56720.286056
180.0757140.69390.244822
190.0718820.65880.25591
200.0202670.18570.426545
21-0.043586-0.39950.345278
22-0.099013-0.90750.183378
23-0.155754-1.42750.07857
24-0.204077-1.87040.032456
25-0.242722-2.22460.014395
26-0.276478-2.5340.006567
27-0.279373-2.56050.00612
28-0.27317-2.50360.007114
29-0.262887-2.40940.009082
30-0.230441-2.1120.018827
31-0.175874-1.61190.055366
32-0.125049-1.14610.127506
33-0.070831-0.64920.258998
34-0.027973-0.25640.399145
350.0031010.02840.488695
360.0328550.30110.382032
370.0471770.43240.333284
380.0436260.39980.345144
390.042370.38830.349379
400.0266060.24380.403972
410.0033510.03070.487785
42-0.017563-0.1610.436254
43-0.032141-0.29460.384523
44-0.055023-0.50430.307686
45-0.078369-0.71830.237294
46-0.099095-0.90820.18318
47-0.112192-1.02830.15339
48-0.125992-1.15470.125736
49-0.132159-1.21130.114597
50-0.139572-1.27920.102174
51-0.136635-1.25230.106972
52-0.131011-1.20070.116615
53-0.135448-1.24140.108956
54-0.149459-1.36980.087198
55-0.155001-1.42060.079566
56-0.151386-1.38750.084484
57-0.135495-1.24180.108877
58-0.102706-0.94130.174621
59-0.083328-0.76370.223589
60-0.083573-0.7660.222925


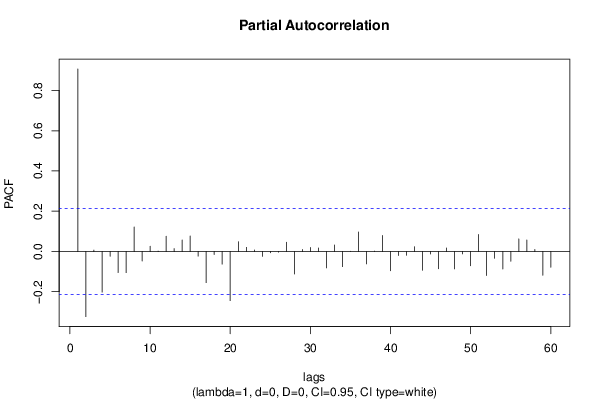
Partial Autocorrelation Function
Time lag kPACF(k)T-STATP-value
10.9072618.31520
2-0.324188-2.97120.001934
30.0067290.06170.475484
4-0.202227-1.85340.033665
5-0.023698-0.21720.414292
6-0.105199-0.96420.168866
7-0.1053-0.96510.168634
80.1212821.11160.134749
9-0.047459-0.4350.332349
100.0258990.23740.406474
110.0017630.01620.493573
120.0757050.69380.244846
130.0142470.13060.448211
140.0566080.51880.302624
150.0765340.70140.242483
16-0.023366-0.21420.415472
17-0.154965-1.42030.079614
18-0.01503-0.13780.445383
19-0.063004-0.57740.282594
20-0.244645-2.24220.013791
210.0479540.43950.330711
220.0203710.18670.426172
230.0075660.06930.472439
24-0.024577-0.22530.411164
25-0.006367-0.05840.476803
26-0.003346-0.03070.487805
270.0457460.41930.338044
28-0.112535-1.03140.152657
290.0094810.08690.465481
300.0196730.18030.428674
310.0172960.15850.437212
32-0.081836-0.750.227662
330.0321680.29480.384427
34-0.075411-0.69120.245688
350.0005730.00530.497911
360.096720.88650.188952
37-0.061864-0.5670.286114
380.0007970.00730.497093
390.0790420.72440.235407
40-0.096453-0.8840.189607
41-0.020585-0.18870.425406
42-0.018882-0.17310.431511
430.0233990.21450.415357
44-0.093257-0.85470.197571
45-0.012853-0.11780.453253
46-0.085903-0.78730.216658
470.0175560.16090.436279
48-0.086676-0.79440.214602
49-0.012089-0.11080.456021
50-0.070816-0.6490.259041
510.0839610.76950.221873
52-0.119786-1.09790.137702
53-0.034294-0.31430.377034
54-0.087497-0.80190.21243
55-0.048542-0.44490.328771
560.0623670.57160.284558
570.0567010.51970.302328
580.0096230.08820.464967
59-0.118689-1.08780.139896
60-0.078957-0.72370.235643

\begin{tabular}{lllllllll}
\hline
Partial Autocorrelation Function \tabularnewline
Time lag k & PACF(k) & T-STAT & P-value \tabularnewline
1 & 0.907261 & 8.3152 & 0 \tabularnewline
2 & -0.324188 & -2.9712 & 0.001934 \tabularnewline
3 & 0.006729 & 0.0617 & 0.475484 \tabularnewline
4 & -0.202227 & -1.8534 & 0.033665 \tabularnewline
5 & -0.023698 & -0.2172 & 0.414292 \tabularnewline
6 & -0.105199 & -0.9642 & 0.168866 \tabularnewline
7 & -0.1053 & -0.9651 & 0.168634 \tabularnewline
8 & 0.121282 & 1.1116 & 0.134749 \tabularnewline
9 & -0.047459 & -0.435 & 0.332349 \tabularnewline
10 & 0.025899 & 0.2374 & 0.406474 \tabularnewline
11 & 0.001763 & 0.0162 & 0.493573 \tabularnewline
12 & 0.075705 & 0.6938 & 0.244846 \tabularnewline
13 & 0.014247 & 0.1306 & 0.448211 \tabularnewline
14 & 0.056608 & 0.5188 & 0.302624 \tabularnewline
15 & 0.076534 & 0.7014 & 0.242483 \tabularnewline
16 & -0.023366 & -0.2142 & 0.415472 \tabularnewline
17 & -0.154965 & -1.4203 & 0.079614 \tabularnewline
18 & -0.01503 & -0.1378 & 0.445383 \tabularnewline
19 & -0.063004 & -0.5774 & 0.282594 \tabularnewline
20 & -0.244645 & -2.2422 & 0.013791 \tabularnewline
21 & 0.047954 & 0.4395 & 0.330711 \tabularnewline
22 & 0.020371 & 0.1867 & 0.426172 \tabularnewline
23 & 0.007566 & 0.0693 & 0.472439 \tabularnewline
24 & -0.024577 & -0.2253 & 0.411164 \tabularnewline
25 & -0.006367 & -0.0584 & 0.476803 \tabularnewline
26 & -0.003346 & -0.0307 & 0.487805 \tabularnewline
27 & 0.045746 & 0.4193 & 0.338044 \tabularnewline
28 & -0.112535 & -1.0314 & 0.152657 \tabularnewline
29 & 0.009481 & 0.0869 & 0.465481 \tabularnewline
30 & 0.019673 & 0.1803 & 0.428674 \tabularnewline
31 & 0.017296 & 0.1585 & 0.437212 \tabularnewline
32 & -0.081836 & -0.75 & 0.227662 \tabularnewline
33 & 0.032168 & 0.2948 & 0.384427 \tabularnewline
34 & -0.075411 & -0.6912 & 0.245688 \tabularnewline
35 & 0.000573 & 0.0053 & 0.497911 \tabularnewline
36 & 0.09672 & 0.8865 & 0.188952 \tabularnewline
37 & -0.061864 & -0.567 & 0.286114 \tabularnewline
38 & 0.000797 & 0.0073 & 0.497093 \tabularnewline
39 & 0.079042 & 0.7244 & 0.235407 \tabularnewline
40 & -0.096453 & -0.884 & 0.189607 \tabularnewline
41 & -0.020585 & -0.1887 & 0.425406 \tabularnewline
42 & -0.018882 & -0.1731 & 0.431511 \tabularnewline
43 & 0.023399 & 0.2145 & 0.415357 \tabularnewline
44 & -0.093257 & -0.8547 & 0.197571 \tabularnewline
45 & -0.012853 & -0.1178 & 0.453253 \tabularnewline
46 & -0.085903 & -0.7873 & 0.216658 \tabularnewline
47 & 0.017556 & 0.1609 & 0.436279 \tabularnewline
48 & -0.086676 & -0.7944 & 0.214602 \tabularnewline
49 & -0.012089 & -0.1108 & 0.456021 \tabularnewline
50 & -0.070816 & -0.649 & 0.259041 \tabularnewline
51 & 0.083961 & 0.7695 & 0.221873 \tabularnewline
52 & -0.119786 & -1.0979 & 0.137702 \tabularnewline
53 & -0.034294 & -0.3143 & 0.377034 \tabularnewline
54 & -0.087497 & -0.8019 & 0.21243 \tabularnewline
55 & -0.048542 & -0.4449 & 0.328771 \tabularnewline
56 & 0.062367 & 0.5716 & 0.284558 \tabularnewline
57 & 0.056701 & 0.5197 & 0.302328 \tabularnewline
58 & 0.009623 & 0.0882 & 0.464967 \tabularnewline
59 & -0.118689 & -1.0878 & 0.139896 \tabularnewline
60 & -0.078957 & -0.7237 & 0.235643 \tabularnewline
\hline
\end{tabular}
%Source: https://freestatistics.org/blog/index.php?pk=224665&T=2

[TABLE]
[ROW][C]Partial Autocorrelation Function[/C][/ROW]
[ROW][C]Time lag k[/C][C]PACF(k)[/C][C]T-STAT[/C][C]P-value[/C][/ROW]
[ROW][C]1[/C][C]0.907261[/C][C]8.3152[/C][C]0[/C][/ROW]
[ROW][C]2[/C][C]-0.324188[/C][C]-2.9712[/C][C]0.001934[/C][/ROW]
[ROW][C]3[/C][C]0.006729[/C][C]0.0617[/C][C]0.475484[/C][/ROW]
[ROW][C]4[/C][C]-0.202227[/C][C]-1.8534[/C][C]0.033665[/C][/ROW]
[ROW][C]5[/C][C]-0.023698[/C][C]-0.2172[/C][C]0.414292[/C][/ROW]
[ROW][C]6[/C][C]-0.105199[/C][C]-0.9642[/C][C]0.168866[/C][/ROW]
[ROW][C]7[/C][C]-0.1053[/C][C]-0.9651[/C][C]0.168634[/C][/ROW]
[ROW][C]8[/C][C]0.121282[/C][C]1.1116[/C][C]0.134749[/C][/ROW]
[ROW][C]9[/C][C]-0.047459[/C][C]-0.435[/C][C]0.332349[/C][/ROW]
[ROW][C]10[/C][C]0.025899[/C][C]0.2374[/C][C]0.406474[/C][/ROW]
[ROW][C]11[/C][C]0.001763[/C][C]0.0162[/C][C]0.493573[/C][/ROW]
[ROW][C]12[/C][C]0.075705[/C][C]0.6938[/C][C]0.244846[/C][/ROW]
[ROW][C]13[/C][C]0.014247[/C][C]0.1306[/C][C]0.448211[/C][/ROW]
[ROW][C]14[/C][C]0.056608[/C][C]0.5188[/C][C]0.302624[/C][/ROW]
[ROW][C]15[/C][C]0.076534[/C][C]0.7014[/C][C]0.242483[/C][/ROW]
[ROW][C]16[/C][C]-0.023366[/C][C]-0.2142[/C][C]0.415472[/C][/ROW]
[ROW][C]17[/C][C]-0.154965[/C][C]-1.4203[/C][C]0.079614[/C][/ROW]
[ROW][C]18[/C][C]-0.01503[/C][C]-0.1378[/C][C]0.445383[/C][/ROW]
[ROW][C]19[/C][C]-0.063004[/C][C]-0.5774[/C][C]0.282594[/C][/ROW]
[ROW][C]20[/C][C]-0.244645[/C][C]-2.2422[/C][C]0.013791[/C][/ROW]
[ROW][C]21[/C][C]0.047954[/C][C]0.4395[/C][C]0.330711[/C][/ROW]
[ROW][C]22[/C][C]0.020371[/C][C]0.1867[/C][C]0.426172[/C][/ROW]
[ROW][C]23[/C][C]0.007566[/C][C]0.0693[/C][C]0.472439[/C][/ROW]
[ROW][C]24[/C][C]-0.024577[/C][C]-0.2253[/C][C]0.411164[/C][/ROW]
[ROW][C]25[/C][C]-0.006367[/C][C]-0.0584[/C][C]0.476803[/C][/ROW]
[ROW][C]26[/C][C]-0.003346[/C][C]-0.0307[/C][C]0.487805[/C][/ROW]
[ROW][C]27[/C][C]0.045746[/C][C]0.4193[/C][C]0.338044[/C][/ROW]
[ROW][C]28[/C][C]-0.112535[/C][C]-1.0314[/C][C]0.152657[/C][/ROW]
[ROW][C]29[/C][C]0.009481[/C][C]0.0869[/C][C]0.465481[/C][/ROW]
[ROW][C]30[/C][C]0.019673[/C][C]0.1803[/C][C]0.428674[/C][/ROW]
[ROW][C]31[/C][C]0.017296[/C][C]0.1585[/C][C]0.437212[/C][/ROW]
[ROW][C]32[/C][C]-0.081836[/C][C]-0.75[/C][C]0.227662[/C][/ROW]
[ROW][C]33[/C][C]0.032168[/C][C]0.2948[/C][C]0.384427[/C][/ROW]
[ROW][C]34[/C][C]-0.075411[/C][C]-0.6912[/C][C]0.245688[/C][/ROW]
[ROW][C]35[/C][C]0.000573[/C][C]0.0053[/C][C]0.497911[/C][/ROW]
[ROW][C]36[/C][C]0.09672[/C][C]0.8865[/C][C]0.188952[/C][/ROW]
[ROW][C]37[/C][C]-0.061864[/C][C]-0.567[/C][C]0.286114[/C][/ROW]
[ROW][C]38[/C][C]0.000797[/C][C]0.0073[/C][C]0.497093[/C][/ROW]
[ROW][C]39[/C][C]0.079042[/C][C]0.7244[/C][C]0.235407[/C][/ROW]
[ROW][C]40[/C][C]-0.096453[/C][C]-0.884[/C][C]0.189607[/C][/ROW]
[ROW][C]41[/C][C]-0.020585[/C][C]-0.1887[/C][C]0.425406[/C][/ROW]
[ROW][C]42[/C][C]-0.018882[/C][C]-0.1731[/C][C]0.431511[/C][/ROW]
[ROW][C]43[/C][C]0.023399[/C][C]0.2145[/C][C]0.415357[/C][/ROW]
[ROW][C]44[/C][C]-0.093257[/C][C]-0.8547[/C][C]0.197571[/C][/ROW]
[ROW][C]45[/C][C]-0.012853[/C][C]-0.1178[/C][C]0.453253[/C][/ROW]
[ROW][C]46[/C][C]-0.085903[/C][C]-0.7873[/C][C]0.216658[/C][/ROW]
[ROW][C]47[/C][C]0.017556[/C][C]0.1609[/C][C]0.436279[/C][/ROW]
[ROW][C]48[/C][C]-0.086676[/C][C]-0.7944[/C][C]0.214602[/C][/ROW]
[ROW][C]49[/C][C]-0.012089[/C][C]-0.1108[/C][C]0.456021[/C][/ROW]
[ROW][C]50[/C][C]-0.070816[/C][C]-0.649[/C][C]0.259041[/C][/ROW]
[ROW][C]51[/C][C]0.083961[/C][C]0.7695[/C][C]0.221873[/C][/ROW]
[ROW][C]52[/C][C]-0.119786[/C][C]-1.0979[/C][C]0.137702[/C][/ROW]
[ROW][C]53[/C][C]-0.034294[/C][C]-0.3143[/C][C]0.377034[/C][/ROW]
[ROW][C]54[/C][C]-0.087497[/C][C]-0.8019[/C][C]0.21243[/C][/ROW]
[ROW][C]55[/C][C]-0.048542[/C][C]-0.4449[/C][C]0.328771[/C][/ROW]
[ROW][C]56[/C][C]0.062367[/C][C]0.5716[/C][C]0.284558[/C][/ROW]
[ROW][C]57[/C][C]0.056701[/C][C]0.5197[/C][C]0.302328[/C][/ROW]
[ROW][C]58[/C][C]0.009623[/C][C]0.0882[/C][C]0.464967[/C][/ROW]
[ROW][C]59[/C][C]-0.118689[/C][C]-1.0878[/C][C]0.139896[/C][/ROW]
[ROW][C]60[/C][C]-0.078957[/C][C]-0.7237[/C][C]0.235643[/C][/ROW]
[/TABLE]
Source: https://freestatistics.org/blog/index.php?pk=224665&T=2

Globally Unique Identifier (entire table): ba.freestatistics.org/blog/index.php?pk=224665&T=2

As an alternative you can also use a QR Code:  

The GUIDs for individual cells are displayed in the table below:

Partial Autocorrelation Function
Time lag kPACF(k)T-STATP-value
10.9072618.31520
2-0.324188-2.97120.001934
30.0067290.06170.475484
4-0.202227-1.85340.033665
5-0.023698-0.21720.414292
6-0.105199-0.96420.168866
7-0.1053-0.96510.168634
80.1212821.11160.134749
9-0.047459-0.4350.332349
100.0258990.23740.406474
110.0017630.01620.493573
120.0757050.69380.244846
130.0142470.13060.448211
140.0566080.51880.302624
150.0765340.70140.242483
16-0.023366-0.21420.415472
17-0.154965-1.42030.079614
18-0.01503-0.13780.445383
19-0.063004-0.57740.282594
20-0.244645-2.24220.013791
210.0479540.43950.330711
220.0203710.18670.426172
230.0075660.06930.472439
24-0.024577-0.22530.411164
25-0.006367-0.05840.476803
26-0.003346-0.03070.487805
270.0457460.41930.338044
28-0.112535-1.03140.152657
290.0094810.08690.465481
300.0196730.18030.428674
310.0172960.15850.437212
32-0.081836-0.750.227662
330.0321680.29480.384427
34-0.075411-0.69120.245688
350.0005730.00530.497911
360.096720.88650.188952
37-0.061864-0.5670.286114
380.0007970.00730.497093
390.0790420.72440.235407
40-0.096453-0.8840.189607
41-0.020585-0.18870.425406
42-0.018882-0.17310.431511
430.0233990.21450.415357
44-0.093257-0.85470.197571
45-0.012853-0.11780.453253
46-0.085903-0.78730.216658
470.0175560.16090.436279
48-0.086676-0.79440.214602
49-0.012089-0.11080.456021
50-0.070816-0.6490.259041
510.0839610.76950.221873
52-0.119786-1.09790.137702
53-0.034294-0.31430.377034
54-0.087497-0.80190.21243
55-0.048542-0.44490.328771
560.0623670.57160.284558
570.0567010.51970.302328
580.0096230.08820.464967
59-0.118689-1.08780.139896
60-0.078957-0.72370.235643


Parameters (Session):
par1 = 60 ; par2 = 1 ; par3 = 0 ; par4 = 0 ; par5 = 12 ; par6 = White Noise ; par7 = 0.95 ;
Parameters (R input):
par1 = 60 ; par2 = 1 ; par3 = 0 ; par4 = 0 ; par5 = 12 ; par6 = White Noise ; par7 = 0.95 ; par8 = ;
R code (references can be found in the software module):
if (par1 == 'Default') {
par1 = 10*log10(length(x))
} else {
par1 <- as.numeric(par1)
}
par2 <- as.numeric(par2)
par3 <- as.numeric(par3)
par4 <- as.numeric(par4)
par5 <- as.numeric(par5)
if (par6 == 'White Noise') par6 <- 'white' else par6 <- 'ma'
par7 <- as.numeric(par7)
if (par8 != '') par8 <- as.numeric(par8)
ox <- x
if (par8 == '') {
if (par2 == 0) {
x <- log(x)
} else {
x <- (x ^ par2 - 1) / par2
}
} else {
x <- log(x,base=par8)
}
if (par3 > 0) x <- diff(x,lag=1,difference=par3)
if (par4 > 0) x <- diff(x,lag=par5,difference=par4)
bitmap(file='picts.png')
op <- par(mfrow=c(2,1))
plot(ox,type='l',main='Original Time Series',xlab='time',ylab='value')
if (par8=='') {
mytitle <- paste('Working Time Series (lambda=',par2,', d=',par3,', D=',par4,')',sep='')
mysub <- paste('(lambda=',par2,', d=',par3,', D=',par4,', CI=', par7, ', CI type=',par6,')',sep='')
} else {
mytitle <- paste('Working Time Series (base=',par8,', d=',par3,', D=',par4,')',sep='')
mysub <- paste('(base=',par8,', d=',par3,', D=',par4,', CI=', par7, ', CI type=',par6,')',sep='')
}
plot(x,type='l', main=mytitle,xlab='time',ylab='value')
par(op)
dev.off()
bitmap(file='pic1.png')
racf <- acf(x, par1, main='Autocorrelation', xlab='time lag', ylab='ACF', ci.type=par6, ci=par7, sub=mysub)
dev.off()
bitmap(file='pic2.png')
rpacf <- pacf(x,par1,main='Partial Autocorrelation',xlab='lags',ylab='PACF',sub=mysub)
dev.off()
(myacf <- c(racf$acf))
(mypacf <- c(rpacf$acf))
lengthx <- length(x)
sqrtn <- sqrt(lengthx)
load(file='createtable')
a<-table.start()
a<-table.row.start(a)
a<-table.element(a,'Autocorrelation Function',4,TRUE)
a<-table.row.end(a)
a<-table.row.start(a)
a<-table.element(a,'Time lag k',header=TRUE)
a<-table.element(a,hyperlink('basics.htm','ACF(k)','click here for more information about the Autocorrelation Function'),header=TRUE)
a<-table.element(a,'T-STAT',header=TRUE)
a<-table.element(a,'P-value',header=TRUE)
a<-table.row.end(a)
for (i in 2:(par1+1)) {
a<-table.row.start(a)
a<-table.element(a,i-1,header=TRUE)
a<-table.element(a,round(myacf[i],6))
mytstat <- myacf[i]*sqrtn
a<-table.element(a,round(mytstat,4))
a<-table.element(a,round(1-pt(abs(mytstat),lengthx),6))
a<-table.row.end(a)
}
a<-table.end(a)
table.save(a,file='mytable.tab')
a<-table.start()
a<-table.row.start(a)
a<-table.element(a,'Partial Autocorrelation Function',4,TRUE)
a<-table.row.end(a)
a<-table.row.start(a)
a<-table.element(a,'Time lag k',header=TRUE)
a<-table.element(a,hyperlink('basics.htm','PACF(k)','click here for more information about the Partial Autocorrelation Function'),header=TRUE)
a<-table.element(a,'T-STAT',header=TRUE)
a<-table.element(a,'P-value',header=TRUE)
a<-table.row.end(a)
for (i in 1:par1) {
a<-table.row.start(a)
a<-table.element(a,i,header=TRUE)
a<-table.element(a,round(mypacf[i],6))
mytstat <- mypacf[i]*sqrtn
a<-table.element(a,round(mytstat,4))
a<-table.element(a,round(1-pt(abs(mytstat),lengthx),6))
a<-table.row.end(a)
}
a<-table.end(a)
table.save(a,file='mytable1.tab')