Free Statistics

of Irreproducible Research!

Author's title

Author*Unverified author*
R Software Modulerwasp_autocorrelation.wasp
Title produced by software(Partial) Autocorrelation Function
Date of computationWed, 13 Nov 2013 04:08:53 -0500
Cite this page as followsStatistical Computations at FreeStatistics.org, Office for Research Development and Education, URL https://freestatistics.org/blog/index.php?v=date/2013/Nov/13/t1384333769t1vu6j968ym26wf.htm/, Retrieved Sun, 28 Apr 2024 22:06:47 +0000
Statistical Computations at FreeStatistics.org, Office for Research Development and Education, URL https://freestatistics.org/blog/index.php?pk=224659, Retrieved Sun, 28 Apr 2024 22:06:47 +0000
QR Codes:

Original text written by user:
IsPrivate?No (this computation is public)
User-defined keywords
Estimated Impact59
Family? (F = Feedback message, R = changed R code, M = changed R Module, P = changed Parameters, D = changed Data)
-       [(Partial) Autocorrelation Function] [] [2013-11-13 09:08:53] [bc709afd059270defb36fb1011c3ea57] [Current]
Feedback Forum

Post a new message
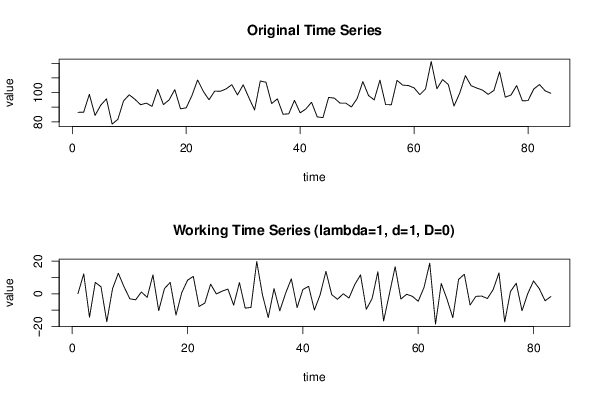
Dataseries X:
86.5
86.6
98.8
84.4
91.4
95.7
78.5
81.7
94.3
98.5
95.4
91.7
92.8
90.6
102.2
91.8
95
102
88.9
89.6
97.9
108.6
100.8
95.1
101
100.9
102.5
105.4
98.4
105.3
96.5
88.1
107.9
107.1
92.5
95.7
85.2
85.5
94.7
86.2
88.8
93.4
83.4
82.9
96.7
96.2
92.8
92.8
90.2
95.9
107.5
98
95
108.5
91.8
91.7
108.3
105.1
104.8
103.2
98.6
102.4
121.2
102.6
108.9
105.5
90.8
99.6
111.6
104.7
103.1
101.7
98.8
101.4
114.2
96.9
98.3
104.8
94.4
94.5
102.4
105.5
101.2
99.5


Summary of computational transaction
Raw Inputview raw input (R code)
Raw Outputview raw output of R engine
Computing time2 seconds
R Server'Gwilym Jenkins' @ jenkins.wessa.net

\begin{tabular}{lllllllll}
\hline
Summary of computational transaction \tabularnewline
Raw Input & view raw input (R code)  \tabularnewline
Raw Output & view raw output of R engine  \tabularnewline
Computing time & 2 seconds \tabularnewline
R Server & 'Gwilym Jenkins' @ jenkins.wessa.net \tabularnewline
\hline
\end{tabular}
%Source: https://freestatistics.org/blog/index.php?pk=224659&T=0

[TABLE]
[ROW][C]Summary of computational transaction[/C][/ROW]
[ROW][C]Raw Input[/C][C]view raw input (R code) [/C][/ROW]
[ROW][C]Raw Output[/C][C]view raw output of R engine [/C][/ROW]
[ROW][C]Computing time[/C][C]2 seconds[/C][/ROW]
[ROW][C]R Server[/C][C]'Gwilym Jenkins' @ jenkins.wessa.net[/C][/ROW]
[/TABLE]
Source: https://freestatistics.org/blog/index.php?pk=224659&T=0

Globally Unique Identifier (entire table): ba.freestatistics.org/blog/index.php?pk=224659&T=0

As an alternative you can also use a QR Code:  

The GUIDs for individual cells are displayed in the table below:

Summary of computational transaction
Raw Inputview raw input (R code)
Raw Outputview raw output of R engine
Computing time2 seconds
R Server'Gwilym Jenkins' @ jenkins.wessa.net


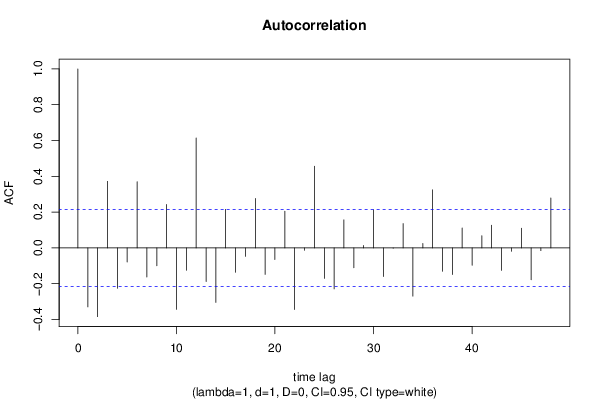
Autocorrelation Function
Time lag kACF(k)T-STATP-value
1-0.329373-3.00070.001778
2-0.384067-3.4990.000377
30.3720663.38970.000536
4-0.225055-2.05030.021743
5-0.078706-0.7170.237678
60.3697793.36880.000573
7-0.162116-1.4770.071737
8-0.099823-0.90940.182879
90.2430692.21450.014769
10-0.343421-3.12870.001211
11-0.124506-1.13430.129966
120.6140185.5940
13-0.188182-1.71440.045092
14-0.304257-2.77190.003439
150.2154711.9630.026496
16-0.136028-1.23930.109369
17-0.047432-0.43210.333385
180.2763192.51740.006873
19-0.147999-1.34830.090609
20-0.064995-0.59210.277686
210.204941.86710.03271
22-0.343928-3.13330.001194
23-0.013088-0.11920.452686
240.4564154.15813.9e-05
25-0.170188-1.55050.062415
26-0.228771-2.08420.020108
270.156621.42690.078683
28-0.110615-1.00780.158251
290.0132250.12050.452194
300.2137441.94730.02744
31-0.159753-1.45540.074663
32-0.002324-0.02120.491579
330.1357671.23690.109806
34-0.269587-2.45610.008067
350.0244840.22310.412018
360.3242572.95410.002039
37-0.130745-1.19110.118497
38-0.148572-1.35360.089776
390.1116771.01740.155954
40-0.096605-0.88010.19067
410.0683720.62290.26753
420.126291.15060.126609
43-0.125401-1.14250.128275
44-0.019118-0.17420.431076
450.1103071.00490.158922
46-0.177897-1.62070.054436
47-0.015202-0.13850.44509
480.2789812.54160.006447

\begin{tabular}{lllllllll}
\hline
Autocorrelation Function \tabularnewline
Time lag k & ACF(k) & T-STAT & P-value \tabularnewline
1 & -0.329373 & -3.0007 & 0.001778 \tabularnewline
2 & -0.384067 & -3.499 & 0.000377 \tabularnewline
3 & 0.372066 & 3.3897 & 0.000536 \tabularnewline
4 & -0.225055 & -2.0503 & 0.021743 \tabularnewline
5 & -0.078706 & -0.717 & 0.237678 \tabularnewline
6 & 0.369779 & 3.3688 & 0.000573 \tabularnewline
7 & -0.162116 & -1.477 & 0.071737 \tabularnewline
8 & -0.099823 & -0.9094 & 0.182879 \tabularnewline
9 & 0.243069 & 2.2145 & 0.014769 \tabularnewline
10 & -0.343421 & -3.1287 & 0.001211 \tabularnewline
11 & -0.124506 & -1.1343 & 0.129966 \tabularnewline
12 & 0.614018 & 5.594 & 0 \tabularnewline
13 & -0.188182 & -1.7144 & 0.045092 \tabularnewline
14 & -0.304257 & -2.7719 & 0.003439 \tabularnewline
15 & 0.215471 & 1.963 & 0.026496 \tabularnewline
16 & -0.136028 & -1.2393 & 0.109369 \tabularnewline
17 & -0.047432 & -0.4321 & 0.333385 \tabularnewline
18 & 0.276319 & 2.5174 & 0.006873 \tabularnewline
19 & -0.147999 & -1.3483 & 0.090609 \tabularnewline
20 & -0.064995 & -0.5921 & 0.277686 \tabularnewline
21 & 0.20494 & 1.8671 & 0.03271 \tabularnewline
22 & -0.343928 & -3.1333 & 0.001194 \tabularnewline
23 & -0.013088 & -0.1192 & 0.452686 \tabularnewline
24 & 0.456415 & 4.1581 & 3.9e-05 \tabularnewline
25 & -0.170188 & -1.5505 & 0.062415 \tabularnewline
26 & -0.228771 & -2.0842 & 0.020108 \tabularnewline
27 & 0.15662 & 1.4269 & 0.078683 \tabularnewline
28 & -0.110615 & -1.0078 & 0.158251 \tabularnewline
29 & 0.013225 & 0.1205 & 0.452194 \tabularnewline
30 & 0.213744 & 1.9473 & 0.02744 \tabularnewline
31 & -0.159753 & -1.4554 & 0.074663 \tabularnewline
32 & -0.002324 & -0.0212 & 0.491579 \tabularnewline
33 & 0.135767 & 1.2369 & 0.109806 \tabularnewline
34 & -0.269587 & -2.4561 & 0.008067 \tabularnewline
35 & 0.024484 & 0.2231 & 0.412018 \tabularnewline
36 & 0.324257 & 2.9541 & 0.002039 \tabularnewline
37 & -0.130745 & -1.1911 & 0.118497 \tabularnewline
38 & -0.148572 & -1.3536 & 0.089776 \tabularnewline
39 & 0.111677 & 1.0174 & 0.155954 \tabularnewline
40 & -0.096605 & -0.8801 & 0.19067 \tabularnewline
41 & 0.068372 & 0.6229 & 0.26753 \tabularnewline
42 & 0.12629 & 1.1506 & 0.126609 \tabularnewline
43 & -0.125401 & -1.1425 & 0.128275 \tabularnewline
44 & -0.019118 & -0.1742 & 0.431076 \tabularnewline
45 & 0.110307 & 1.0049 & 0.158922 \tabularnewline
46 & -0.177897 & -1.6207 & 0.054436 \tabularnewline
47 & -0.015202 & -0.1385 & 0.44509 \tabularnewline
48 & 0.278981 & 2.5416 & 0.006447 \tabularnewline
\hline
\end{tabular}
%Source: https://freestatistics.org/blog/index.php?pk=224659&T=1

[TABLE]
[ROW][C]Autocorrelation Function[/C][/ROW]
[ROW][C]Time lag k[/C][C]ACF(k)[/C][C]T-STAT[/C][C]P-value[/C][/ROW]
[ROW][C]1[/C][C]-0.329373[/C][C]-3.0007[/C][C]0.001778[/C][/ROW]
[ROW][C]2[/C][C]-0.384067[/C][C]-3.499[/C][C]0.000377[/C][/ROW]
[ROW][C]3[/C][C]0.372066[/C][C]3.3897[/C][C]0.000536[/C][/ROW]
[ROW][C]4[/C][C]-0.225055[/C][C]-2.0503[/C][C]0.021743[/C][/ROW]
[ROW][C]5[/C][C]-0.078706[/C][C]-0.717[/C][C]0.237678[/C][/ROW]
[ROW][C]6[/C][C]0.369779[/C][C]3.3688[/C][C]0.000573[/C][/ROW]
[ROW][C]7[/C][C]-0.162116[/C][C]-1.477[/C][C]0.071737[/C][/ROW]
[ROW][C]8[/C][C]-0.099823[/C][C]-0.9094[/C][C]0.182879[/C][/ROW]
[ROW][C]9[/C][C]0.243069[/C][C]2.2145[/C][C]0.014769[/C][/ROW]
[ROW][C]10[/C][C]-0.343421[/C][C]-3.1287[/C][C]0.001211[/C][/ROW]
[ROW][C]11[/C][C]-0.124506[/C][C]-1.1343[/C][C]0.129966[/C][/ROW]
[ROW][C]12[/C][C]0.614018[/C][C]5.594[/C][C]0[/C][/ROW]
[ROW][C]13[/C][C]-0.188182[/C][C]-1.7144[/C][C]0.045092[/C][/ROW]
[ROW][C]14[/C][C]-0.304257[/C][C]-2.7719[/C][C]0.003439[/C][/ROW]
[ROW][C]15[/C][C]0.215471[/C][C]1.963[/C][C]0.026496[/C][/ROW]
[ROW][C]16[/C][C]-0.136028[/C][C]-1.2393[/C][C]0.109369[/C][/ROW]
[ROW][C]17[/C][C]-0.047432[/C][C]-0.4321[/C][C]0.333385[/C][/ROW]
[ROW][C]18[/C][C]0.276319[/C][C]2.5174[/C][C]0.006873[/C][/ROW]
[ROW][C]19[/C][C]-0.147999[/C][C]-1.3483[/C][C]0.090609[/C][/ROW]
[ROW][C]20[/C][C]-0.064995[/C][C]-0.5921[/C][C]0.277686[/C][/ROW]
[ROW][C]21[/C][C]0.20494[/C][C]1.8671[/C][C]0.03271[/C][/ROW]
[ROW][C]22[/C][C]-0.343928[/C][C]-3.1333[/C][C]0.001194[/C][/ROW]
[ROW][C]23[/C][C]-0.013088[/C][C]-0.1192[/C][C]0.452686[/C][/ROW]
[ROW][C]24[/C][C]0.456415[/C][C]4.1581[/C][C]3.9e-05[/C][/ROW]
[ROW][C]25[/C][C]-0.170188[/C][C]-1.5505[/C][C]0.062415[/C][/ROW]
[ROW][C]26[/C][C]-0.228771[/C][C]-2.0842[/C][C]0.020108[/C][/ROW]
[ROW][C]27[/C][C]0.15662[/C][C]1.4269[/C][C]0.078683[/C][/ROW]
[ROW][C]28[/C][C]-0.110615[/C][C]-1.0078[/C][C]0.158251[/C][/ROW]
[ROW][C]29[/C][C]0.013225[/C][C]0.1205[/C][C]0.452194[/C][/ROW]
[ROW][C]30[/C][C]0.213744[/C][C]1.9473[/C][C]0.02744[/C][/ROW]
[ROW][C]31[/C][C]-0.159753[/C][C]-1.4554[/C][C]0.074663[/C][/ROW]
[ROW][C]32[/C][C]-0.002324[/C][C]-0.0212[/C][C]0.491579[/C][/ROW]
[ROW][C]33[/C][C]0.135767[/C][C]1.2369[/C][C]0.109806[/C][/ROW]
[ROW][C]34[/C][C]-0.269587[/C][C]-2.4561[/C][C]0.008067[/C][/ROW]
[ROW][C]35[/C][C]0.024484[/C][C]0.2231[/C][C]0.412018[/C][/ROW]
[ROW][C]36[/C][C]0.324257[/C][C]2.9541[/C][C]0.002039[/C][/ROW]
[ROW][C]37[/C][C]-0.130745[/C][C]-1.1911[/C][C]0.118497[/C][/ROW]
[ROW][C]38[/C][C]-0.148572[/C][C]-1.3536[/C][C]0.089776[/C][/ROW]
[ROW][C]39[/C][C]0.111677[/C][C]1.0174[/C][C]0.155954[/C][/ROW]
[ROW][C]40[/C][C]-0.096605[/C][C]-0.8801[/C][C]0.19067[/C][/ROW]
[ROW][C]41[/C][C]0.068372[/C][C]0.6229[/C][C]0.26753[/C][/ROW]
[ROW][C]42[/C][C]0.12629[/C][C]1.1506[/C][C]0.126609[/C][/ROW]
[ROW][C]43[/C][C]-0.125401[/C][C]-1.1425[/C][C]0.128275[/C][/ROW]
[ROW][C]44[/C][C]-0.019118[/C][C]-0.1742[/C][C]0.431076[/C][/ROW]
[ROW][C]45[/C][C]0.110307[/C][C]1.0049[/C][C]0.158922[/C][/ROW]
[ROW][C]46[/C][C]-0.177897[/C][C]-1.6207[/C][C]0.054436[/C][/ROW]
[ROW][C]47[/C][C]-0.015202[/C][C]-0.1385[/C][C]0.44509[/C][/ROW]
[ROW][C]48[/C][C]0.278981[/C][C]2.5416[/C][C]0.006447[/C][/ROW]
[/TABLE]
Source: https://freestatistics.org/blog/index.php?pk=224659&T=1

Globally Unique Identifier (entire table): ba.freestatistics.org/blog/index.php?pk=224659&T=1

As an alternative you can also use a QR Code:  

The GUIDs for individual cells are displayed in the table below:

Autocorrelation Function
Time lag kACF(k)T-STATP-value
1-0.329373-3.00070.001778
2-0.384067-3.4990.000377
30.3720663.38970.000536
4-0.225055-2.05030.021743
5-0.078706-0.7170.237678
60.3697793.36880.000573
7-0.162116-1.4770.071737
8-0.099823-0.90940.182879
90.2430692.21450.014769
10-0.343421-3.12870.001211
11-0.124506-1.13430.129966
120.6140185.5940
13-0.188182-1.71440.045092
14-0.304257-2.77190.003439
150.2154711.9630.026496
16-0.136028-1.23930.109369
17-0.047432-0.43210.333385
180.2763192.51740.006873
19-0.147999-1.34830.090609
20-0.064995-0.59210.277686
210.204941.86710.03271
22-0.343928-3.13330.001194
23-0.013088-0.11920.452686
240.4564154.15813.9e-05
25-0.170188-1.55050.062415
26-0.228771-2.08420.020108
270.156621.42690.078683
28-0.110615-1.00780.158251
290.0132250.12050.452194
300.2137441.94730.02744
31-0.159753-1.45540.074663
32-0.002324-0.02120.491579
330.1357671.23690.109806
34-0.269587-2.45610.008067
350.0244840.22310.412018
360.3242572.95410.002039
37-0.130745-1.19110.118497
38-0.148572-1.35360.089776
390.1116771.01740.155954
40-0.096605-0.88010.19067
410.0683720.62290.26753
420.126291.15060.126609
43-0.125401-1.14250.128275
44-0.019118-0.17420.431076
450.1103071.00490.158922
46-0.177897-1.62070.054436
47-0.015202-0.13850.44509
480.2789812.54160.006447


Partial Autocorrelation Function
Time lag kPACF(k)T-STATP-value
1-0.329373-3.00070.001778
2-0.552492-5.03341e-06
3-0.010176-0.09270.46318
4-0.404076-3.68130.000206
5-0.235169-2.14250.017542
60.0077080.07020.472092
70.0351580.32030.374773
80.1194521.08830.139816
90.2971422.70710.004119
10-0.120715-1.09980.137307
11-0.392023-3.57150.000297
120.1617921.4740.072133
130.1991181.8140.036642
140.0777310.70820.240415
15-0.158346-1.44260.076448
16-0.109907-1.00130.159796
17-0.096787-0.88180.190223
18-0.067297-0.61310.270743
19-0.123399-1.12420.13208
20-0.103663-0.94440.173849
210.0539260.49130.31226
22-0.10229-0.93190.177043
23-0.037356-0.34030.367234
24-0.028731-0.26170.397082
250.0381040.34710.364679
26-0.085965-0.78320.217876
27-0.071605-0.65240.257989
28-0.090916-0.82830.204942
29-0.028768-0.26210.39695
30-0.014891-0.13570.446208
31-0.056021-0.51040.305573
32-0.008559-0.0780.469019
33-0.032873-0.29950.382658
340.0403680.36780.356992
35-0.016658-0.15180.439871
36-0.066161-0.60280.274156
37-0.100787-0.91820.180584
38-0.041166-0.3750.354295
390.0326070.29710.383578
40-0.013796-0.12570.45014
410.0618910.56390.287188
42-0.018086-0.16480.434761
430.0954030.86920.193632
44-0.134676-1.2270.111655
45-0.047109-0.42920.334451
46-0.049781-0.45350.325677
47-0.065713-0.59870.275511
48-0.020864-0.19010.424857

\begin{tabular}{lllllllll}
\hline
Partial Autocorrelation Function \tabularnewline
Time lag k & PACF(k) & T-STAT & P-value \tabularnewline
1 & -0.329373 & -3.0007 & 0.001778 \tabularnewline
2 & -0.552492 & -5.0334 & 1e-06 \tabularnewline
3 & -0.010176 & -0.0927 & 0.46318 \tabularnewline
4 & -0.404076 & -3.6813 & 0.000206 \tabularnewline
5 & -0.235169 & -2.1425 & 0.017542 \tabularnewline
6 & 0.007708 & 0.0702 & 0.472092 \tabularnewline
7 & 0.035158 & 0.3203 & 0.374773 \tabularnewline
8 & 0.119452 & 1.0883 & 0.139816 \tabularnewline
9 & 0.297142 & 2.7071 & 0.004119 \tabularnewline
10 & -0.120715 & -1.0998 & 0.137307 \tabularnewline
11 & -0.392023 & -3.5715 & 0.000297 \tabularnewline
12 & 0.161792 & 1.474 & 0.072133 \tabularnewline
13 & 0.199118 & 1.814 & 0.036642 \tabularnewline
14 & 0.077731 & 0.7082 & 0.240415 \tabularnewline
15 & -0.158346 & -1.4426 & 0.076448 \tabularnewline
16 & -0.109907 & -1.0013 & 0.159796 \tabularnewline
17 & -0.096787 & -0.8818 & 0.190223 \tabularnewline
18 & -0.067297 & -0.6131 & 0.270743 \tabularnewline
19 & -0.123399 & -1.1242 & 0.13208 \tabularnewline
20 & -0.103663 & -0.9444 & 0.173849 \tabularnewline
21 & 0.053926 & 0.4913 & 0.31226 \tabularnewline
22 & -0.10229 & -0.9319 & 0.177043 \tabularnewline
23 & -0.037356 & -0.3403 & 0.367234 \tabularnewline
24 & -0.028731 & -0.2617 & 0.397082 \tabularnewline
25 & 0.038104 & 0.3471 & 0.364679 \tabularnewline
26 & -0.085965 & -0.7832 & 0.217876 \tabularnewline
27 & -0.071605 & -0.6524 & 0.257989 \tabularnewline
28 & -0.090916 & -0.8283 & 0.204942 \tabularnewline
29 & -0.028768 & -0.2621 & 0.39695 \tabularnewline
30 & -0.014891 & -0.1357 & 0.446208 \tabularnewline
31 & -0.056021 & -0.5104 & 0.305573 \tabularnewline
32 & -0.008559 & -0.078 & 0.469019 \tabularnewline
33 & -0.032873 & -0.2995 & 0.382658 \tabularnewline
34 & 0.040368 & 0.3678 & 0.356992 \tabularnewline
35 & -0.016658 & -0.1518 & 0.439871 \tabularnewline
36 & -0.066161 & -0.6028 & 0.274156 \tabularnewline
37 & -0.100787 & -0.9182 & 0.180584 \tabularnewline
38 & -0.041166 & -0.375 & 0.354295 \tabularnewline
39 & 0.032607 & 0.2971 & 0.383578 \tabularnewline
40 & -0.013796 & -0.1257 & 0.45014 \tabularnewline
41 & 0.061891 & 0.5639 & 0.287188 \tabularnewline
42 & -0.018086 & -0.1648 & 0.434761 \tabularnewline
43 & 0.095403 & 0.8692 & 0.193632 \tabularnewline
44 & -0.134676 & -1.227 & 0.111655 \tabularnewline
45 & -0.047109 & -0.4292 & 0.334451 \tabularnewline
46 & -0.049781 & -0.4535 & 0.325677 \tabularnewline
47 & -0.065713 & -0.5987 & 0.275511 \tabularnewline
48 & -0.020864 & -0.1901 & 0.424857 \tabularnewline
\hline
\end{tabular}
%Source: https://freestatistics.org/blog/index.php?pk=224659&T=2

[TABLE]
[ROW][C]Partial Autocorrelation Function[/C][/ROW]
[ROW][C]Time lag k[/C][C]PACF(k)[/C][C]T-STAT[/C][C]P-value[/C][/ROW]
[ROW][C]1[/C][C]-0.329373[/C][C]-3.0007[/C][C]0.001778[/C][/ROW]
[ROW][C]2[/C][C]-0.552492[/C][C]-5.0334[/C][C]1e-06[/C][/ROW]
[ROW][C]3[/C][C]-0.010176[/C][C]-0.0927[/C][C]0.46318[/C][/ROW]
[ROW][C]4[/C][C]-0.404076[/C][C]-3.6813[/C][C]0.000206[/C][/ROW]
[ROW][C]5[/C][C]-0.235169[/C][C]-2.1425[/C][C]0.017542[/C][/ROW]
[ROW][C]6[/C][C]0.007708[/C][C]0.0702[/C][C]0.472092[/C][/ROW]
[ROW][C]7[/C][C]0.035158[/C][C]0.3203[/C][C]0.374773[/C][/ROW]
[ROW][C]8[/C][C]0.119452[/C][C]1.0883[/C][C]0.139816[/C][/ROW]
[ROW][C]9[/C][C]0.297142[/C][C]2.7071[/C][C]0.004119[/C][/ROW]
[ROW][C]10[/C][C]-0.120715[/C][C]-1.0998[/C][C]0.137307[/C][/ROW]
[ROW][C]11[/C][C]-0.392023[/C][C]-3.5715[/C][C]0.000297[/C][/ROW]
[ROW][C]12[/C][C]0.161792[/C][C]1.474[/C][C]0.072133[/C][/ROW]
[ROW][C]13[/C][C]0.199118[/C][C]1.814[/C][C]0.036642[/C][/ROW]
[ROW][C]14[/C][C]0.077731[/C][C]0.7082[/C][C]0.240415[/C][/ROW]
[ROW][C]15[/C][C]-0.158346[/C][C]-1.4426[/C][C]0.076448[/C][/ROW]
[ROW][C]16[/C][C]-0.109907[/C][C]-1.0013[/C][C]0.159796[/C][/ROW]
[ROW][C]17[/C][C]-0.096787[/C][C]-0.8818[/C][C]0.190223[/C][/ROW]
[ROW][C]18[/C][C]-0.067297[/C][C]-0.6131[/C][C]0.270743[/C][/ROW]
[ROW][C]19[/C][C]-0.123399[/C][C]-1.1242[/C][C]0.13208[/C][/ROW]
[ROW][C]20[/C][C]-0.103663[/C][C]-0.9444[/C][C]0.173849[/C][/ROW]
[ROW][C]21[/C][C]0.053926[/C][C]0.4913[/C][C]0.31226[/C][/ROW]
[ROW][C]22[/C][C]-0.10229[/C][C]-0.9319[/C][C]0.177043[/C][/ROW]
[ROW][C]23[/C][C]-0.037356[/C][C]-0.3403[/C][C]0.367234[/C][/ROW]
[ROW][C]24[/C][C]-0.028731[/C][C]-0.2617[/C][C]0.397082[/C][/ROW]
[ROW][C]25[/C][C]0.038104[/C][C]0.3471[/C][C]0.364679[/C][/ROW]
[ROW][C]26[/C][C]-0.085965[/C][C]-0.7832[/C][C]0.217876[/C][/ROW]
[ROW][C]27[/C][C]-0.071605[/C][C]-0.6524[/C][C]0.257989[/C][/ROW]
[ROW][C]28[/C][C]-0.090916[/C][C]-0.8283[/C][C]0.204942[/C][/ROW]
[ROW][C]29[/C][C]-0.028768[/C][C]-0.2621[/C][C]0.39695[/C][/ROW]
[ROW][C]30[/C][C]-0.014891[/C][C]-0.1357[/C][C]0.446208[/C][/ROW]
[ROW][C]31[/C][C]-0.056021[/C][C]-0.5104[/C][C]0.305573[/C][/ROW]
[ROW][C]32[/C][C]-0.008559[/C][C]-0.078[/C][C]0.469019[/C][/ROW]
[ROW][C]33[/C][C]-0.032873[/C][C]-0.2995[/C][C]0.382658[/C][/ROW]
[ROW][C]34[/C][C]0.040368[/C][C]0.3678[/C][C]0.356992[/C][/ROW]
[ROW][C]35[/C][C]-0.016658[/C][C]-0.1518[/C][C]0.439871[/C][/ROW]
[ROW][C]36[/C][C]-0.066161[/C][C]-0.6028[/C][C]0.274156[/C][/ROW]
[ROW][C]37[/C][C]-0.100787[/C][C]-0.9182[/C][C]0.180584[/C][/ROW]
[ROW][C]38[/C][C]-0.041166[/C][C]-0.375[/C][C]0.354295[/C][/ROW]
[ROW][C]39[/C][C]0.032607[/C][C]0.2971[/C][C]0.383578[/C][/ROW]
[ROW][C]40[/C][C]-0.013796[/C][C]-0.1257[/C][C]0.45014[/C][/ROW]
[ROW][C]41[/C][C]0.061891[/C][C]0.5639[/C][C]0.287188[/C][/ROW]
[ROW][C]42[/C][C]-0.018086[/C][C]-0.1648[/C][C]0.434761[/C][/ROW]
[ROW][C]43[/C][C]0.095403[/C][C]0.8692[/C][C]0.193632[/C][/ROW]
[ROW][C]44[/C][C]-0.134676[/C][C]-1.227[/C][C]0.111655[/C][/ROW]
[ROW][C]45[/C][C]-0.047109[/C][C]-0.4292[/C][C]0.334451[/C][/ROW]
[ROW][C]46[/C][C]-0.049781[/C][C]-0.4535[/C][C]0.325677[/C][/ROW]
[ROW][C]47[/C][C]-0.065713[/C][C]-0.5987[/C][C]0.275511[/C][/ROW]
[ROW][C]48[/C][C]-0.020864[/C][C]-0.1901[/C][C]0.424857[/C][/ROW]
[/TABLE]
Source: https://freestatistics.org/blog/index.php?pk=224659&T=2

Globally Unique Identifier (entire table): ba.freestatistics.org/blog/index.php?pk=224659&T=2

As an alternative you can also use a QR Code:  

The GUIDs for individual cells are displayed in the table below:

Partial Autocorrelation Function
Time lag kPACF(k)T-STATP-value
1-0.329373-3.00070.001778
2-0.552492-5.03341e-06
3-0.010176-0.09270.46318
4-0.404076-3.68130.000206
5-0.235169-2.14250.017542
60.0077080.07020.472092
70.0351580.32030.374773
80.1194521.08830.139816
90.2971422.70710.004119
10-0.120715-1.09980.137307
11-0.392023-3.57150.000297
120.1617921.4740.072133
130.1991181.8140.036642
140.0777310.70820.240415
15-0.158346-1.44260.076448
16-0.109907-1.00130.159796
17-0.096787-0.88180.190223
18-0.067297-0.61310.270743
19-0.123399-1.12420.13208
20-0.103663-0.94440.173849
210.0539260.49130.31226
22-0.10229-0.93190.177043
23-0.037356-0.34030.367234
24-0.028731-0.26170.397082
250.0381040.34710.364679
26-0.085965-0.78320.217876
27-0.071605-0.65240.257989
28-0.090916-0.82830.204942
29-0.028768-0.26210.39695
30-0.014891-0.13570.446208
31-0.056021-0.51040.305573
32-0.008559-0.0780.469019
33-0.032873-0.29950.382658
340.0403680.36780.356992
35-0.016658-0.15180.439871
36-0.066161-0.60280.274156
37-0.100787-0.91820.180584
38-0.041166-0.3750.354295
390.0326070.29710.383578
40-0.013796-0.12570.45014
410.0618910.56390.287188
42-0.018086-0.16480.434761
430.0954030.86920.193632
44-0.134676-1.2270.111655
45-0.047109-0.42920.334451
46-0.049781-0.45350.325677
47-0.065713-0.59870.275511
48-0.020864-0.19010.424857


Parameters (Session):
par1 = 48 ; par2 = 1 ; par3 = 1 ; par4 = 0 ; par5 = 12 ; par6 = White Noise ; par7 = 0.95 ;
Parameters (R input):
par1 = 48 ; par2 = 1 ; par3 = 1 ; par4 = 0 ; par5 = 12 ; par6 = White Noise ; par7 = 0.95 ; par8 = ;
R code (references can be found in the software module):
par8 <- ''
par7 <- '0.95'
par6 <- 'White Noise'
par5 <- '12'
par4 <- '0'
par3 <- '0'
par2 <- '1'
par1 <- '48'
if (par1 == 'Default') {
par1 = 10*log10(length(x))
} else {
par1 <- as.numeric(par1)
}
par2 <- as.numeric(par2)
par3 <- as.numeric(par3)
par4 <- as.numeric(par4)
par5 <- as.numeric(par5)
if (par6 == 'White Noise') par6 <- 'white' else par6 <- 'ma'
par7 <- as.numeric(par7)
if (par8 != '') par8 <- as.numeric(par8)
ox <- x
if (par8 == '') {
if (par2 == 0) {
x <- log(x)
} else {
x <- (x ^ par2 - 1) / par2
}
} else {
x <- log(x,base=par8)
}
if (par3 > 0) x <- diff(x,lag=1,difference=par3)
if (par4 > 0) x <- diff(x,lag=par5,difference=par4)
bitmap(file='picts.png')
op <- par(mfrow=c(2,1))
plot(ox,type='l',main='Original Time Series',xlab='time',ylab='value')
if (par8=='') {
mytitle <- paste('Working Time Series (lambda=',par2,', d=',par3,', D=',par4,')',sep='')
mysub <- paste('(lambda=',par2,', d=',par3,', D=',par4,', CI=', par7, ', CI type=',par6,')',sep='')
} else {
mytitle <- paste('Working Time Series (base=',par8,', d=',par3,', D=',par4,')',sep='')
mysub <- paste('(base=',par8,', d=',par3,', D=',par4,', CI=', par7, ', CI type=',par6,')',sep='')
}
plot(x,type='l', main=mytitle,xlab='time',ylab='value')
par(op)
dev.off()
bitmap(file='pic1.png')
racf <- acf(x, par1, main='Autocorrelation', xlab='time lag', ylab='ACF', ci.type=par6, ci=par7, sub=mysub)
dev.off()
bitmap(file='pic2.png')
rpacf <- pacf(x,par1,main='Partial Autocorrelation',xlab='lags',ylab='PACF',sub=mysub)
dev.off()
(myacf <- c(racf$acf))
(mypacf <- c(rpacf$acf))
lengthx <- length(x)
sqrtn <- sqrt(lengthx)
load(file='createtable')
a<-table.start()
a<-table.row.start(a)
a<-table.element(a,'Autocorrelation Function',4,TRUE)
a<-table.row.end(a)
a<-table.row.start(a)
a<-table.element(a,'Time lag k',header=TRUE)
a<-table.element(a,hyperlink('basics.htm','ACF(k)','click here for more information about the Autocorrelation Function'),header=TRUE)
a<-table.element(a,'T-STAT',header=TRUE)
a<-table.element(a,'P-value',header=TRUE)
a<-table.row.end(a)
for (i in 2:(par1+1)) {
a<-table.row.start(a)
a<-table.element(a,i-1,header=TRUE)
a<-table.element(a,round(myacf[i],6))
mytstat <- myacf[i]*sqrtn
a<-table.element(a,round(mytstat,4))
a<-table.element(a,round(1-pt(abs(mytstat),lengthx),6))
a<-table.row.end(a)
}
a<-table.end(a)
table.save(a,file='mytable.tab')
a<-table.start()
a<-table.row.start(a)
a<-table.element(a,'Partial Autocorrelation Function',4,TRUE)
a<-table.row.end(a)
a<-table.row.start(a)
a<-table.element(a,'Time lag k',header=TRUE)
a<-table.element(a,hyperlink('basics.htm','PACF(k)','click here for more information about the Partial Autocorrelation Function'),header=TRUE)
a<-table.element(a,'T-STAT',header=TRUE)
a<-table.element(a,'P-value',header=TRUE)
a<-table.row.end(a)
for (i in 1:par1) {
a<-table.row.start(a)
a<-table.element(a,i,header=TRUE)
a<-table.element(a,round(mypacf[i],6))
mytstat <- mypacf[i]*sqrtn
a<-table.element(a,round(mytstat,4))
a<-table.element(a,round(1-pt(abs(mytstat),lengthx),6))
a<-table.row.end(a)
}
a<-table.end(a)
table.save(a,file='mytable1.tab')