Free Statistics

of Irreproducible Research!

Author's title

Author*Unverified author*
R Software Modulerwasp_autocorrelation.wasp
Title produced by software(Partial) Autocorrelation Function
Date of computationWed, 13 Nov 2013 04:08:35 -0500
Cite this page as followsStatistical Computations at FreeStatistics.org, Office for Research Development and Education, URL https://freestatistics.org/blog/index.php?v=date/2013/Nov/13/t1384333750eqlu402txg59dpv.htm/, Retrieved Mon, 29 Apr 2024 05:24:59 +0000
Statistical Computations at FreeStatistics.org, Office for Research Development and Education, URL https://freestatistics.org/blog/index.php?pk=224656, Retrieved Mon, 29 Apr 2024 05:24:59 +0000
QR Codes:

Original text written by user:
IsPrivate?No (this computation is public)
User-defined keywords
Estimated Impact70
Family? (F = Feedback message, R = changed R code, M = changed R Module, P = changed Parameters, D = changed Data)
-       [(Partial) Autocorrelation Function] [] [2013-11-13 09:08:35] [3050d341fa02a6066b7b273abfa2c28b] [Current]
Feedback Forum

Post a new message
Dataseries X:
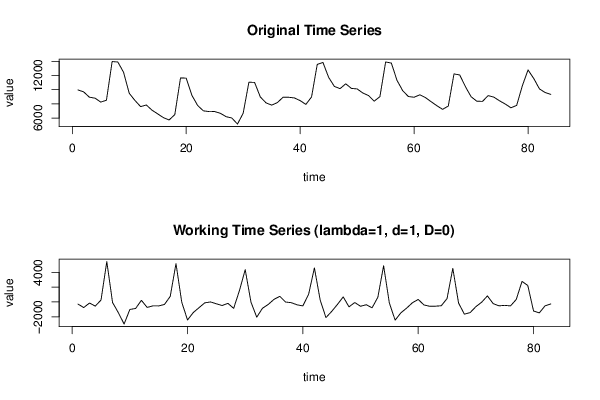
9969
9692
8943
8802
8250
8515
13973
13905
12467
9490
8483
7610
7839
7107
6584
6053
5725
6480
11663
11628
9203
7781
7020
6908
6912
6668
6189
6007
5148
6685
11044
11034
8986
8146
7818
8176
8935
8929
8835
8455
7924
8973
13575
13844
11738
10467
10145
10833
10179
10107
9533
9165
8382
9018
13911
13761
11316
9855
9034
8932
9278
8876
8298
7733
7226
7688
12226
12081
10439
9008
8377
8346
9167
8945
8428
7973
7446
7785
10561
12791
11583
10112
9597
9332


Summary of computational transaction
Raw Inputview raw input (R code)
Raw Outputview raw output of R engine
Computing time2 seconds
R Server'Gwilym Jenkins' @ jenkins.wessa.net

\begin{tabular}{lllllllll}
\hline
Summary of computational transaction \tabularnewline
Raw Input & view raw input (R code)  \tabularnewline
Raw Output & view raw output of R engine  \tabularnewline
Computing time & 2 seconds \tabularnewline
R Server & 'Gwilym Jenkins' @ jenkins.wessa.net \tabularnewline
\hline
\end{tabular}
%Source: https://freestatistics.org/blog/index.php?pk=224656&T=0

[TABLE]
[ROW][C]Summary of computational transaction[/C][/ROW]
[ROW][C]Raw Input[/C][C]view raw input (R code) [/C][/ROW]
[ROW][C]Raw Output[/C][C]view raw output of R engine [/C][/ROW]
[ROW][C]Computing time[/C][C]2 seconds[/C][/ROW]
[ROW][C]R Server[/C][C]'Gwilym Jenkins' @ jenkins.wessa.net[/C][/ROW]
[/TABLE]
Source: https://freestatistics.org/blog/index.php?pk=224656&T=0

Globally Unique Identifier (entire table): ba.freestatistics.org/blog/index.php?pk=224656&T=0

As an alternative you can also use a QR Code:  

The GUIDs for individual cells are displayed in the table below:

Summary of computational transaction
Raw Inputview raw input (R code)
Raw Outputview raw output of R engine
Computing time2 seconds
R Server'Gwilym Jenkins' @ jenkins.wessa.net


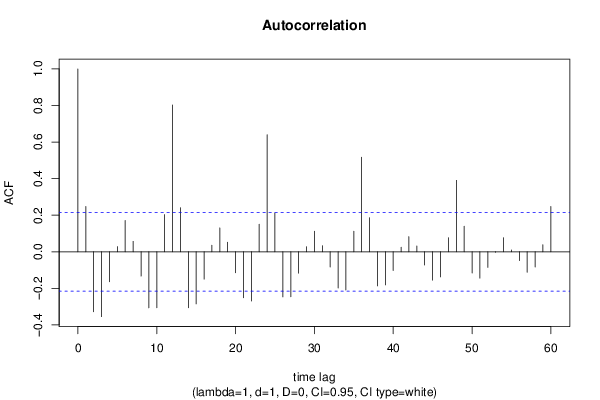
Autocorrelation Function
Time lag kACF(k)T-STATP-value
10.2476572.25630.013342
2-0.328247-2.99050.001833
3-0.354678-3.23130.000884
4-0.164047-1.49450.069413
50.028490.25960.397924
60.171341.5610.061166
70.0570330.51960.302365
8-0.13292-1.2110.114673
9-0.306525-2.79260.003245
10-0.306145-2.78910.003276
110.2032071.85130.033841
120.802627.31220
130.2409392.19510.015476
14-0.306103-2.78870.00328
15-0.285064-2.59710.00556
16-0.149514-1.36210.08842
170.0355010.32340.373591
180.1307131.19090.118553
190.0522150.47570.317769
20-0.114881-1.04660.149158
21-0.251717-2.29330.012181
22-0.269129-2.45190.008154
230.150321.36950.087272
240.6398355.82920
250.2124161.93520.028186
26-0.246682-2.24740.013635
27-0.246033-2.24150.013833
28-0.116579-1.06210.145638
290.0276020.25150.401039
300.1123321.02340.154547
310.0332310.30270.381419
32-0.083642-0.7620.224106
33-0.198128-1.8050.037348
34-0.208919-1.90330.030231
350.1124341.02430.15433
360.5171664.71165e-06
370.186321.69750.046678
38-0.186534-1.69940.046494
39-0.18109-1.64980.051381
40-0.101871-0.92810.178027
410.0248190.22610.410836
420.0828590.75490.226228
430.0318330.290.386266
44-0.072586-0.66130.255128
45-0.154895-1.41120.080968
46-0.137338-1.25120.107187
470.0770220.70170.242415
480.3908033.56040.000308
490.1402421.27770.102466
50-0.116011-1.05690.146809
51-0.144053-1.31240.096504
52-0.085278-0.77690.219708
53-0.002566-0.02340.490704
540.0769740.70130.242549
550.0094780.08630.465699
56-0.048155-0.43870.331006
57-0.111664-1.01730.155982
58-0.08301-0.75630.225819
590.0385980.35160.363
600.2478442.2580.013286

\begin{tabular}{lllllllll}
\hline
Autocorrelation Function \tabularnewline
Time lag k & ACF(k) & T-STAT & P-value \tabularnewline
1 & 0.247657 & 2.2563 & 0.013342 \tabularnewline
2 & -0.328247 & -2.9905 & 0.001833 \tabularnewline
3 & -0.354678 & -3.2313 & 0.000884 \tabularnewline
4 & -0.164047 & -1.4945 & 0.069413 \tabularnewline
5 & 0.02849 & 0.2596 & 0.397924 \tabularnewline
6 & 0.17134 & 1.561 & 0.061166 \tabularnewline
7 & 0.057033 & 0.5196 & 0.302365 \tabularnewline
8 & -0.13292 & -1.211 & 0.114673 \tabularnewline
9 & -0.306525 & -2.7926 & 0.003245 \tabularnewline
10 & -0.306145 & -2.7891 & 0.003276 \tabularnewline
11 & 0.203207 & 1.8513 & 0.033841 \tabularnewline
12 & 0.80262 & 7.3122 & 0 \tabularnewline
13 & 0.240939 & 2.1951 & 0.015476 \tabularnewline
14 & -0.306103 & -2.7887 & 0.00328 \tabularnewline
15 & -0.285064 & -2.5971 & 0.00556 \tabularnewline
16 & -0.149514 & -1.3621 & 0.08842 \tabularnewline
17 & 0.035501 & 0.3234 & 0.373591 \tabularnewline
18 & 0.130713 & 1.1909 & 0.118553 \tabularnewline
19 & 0.052215 & 0.4757 & 0.317769 \tabularnewline
20 & -0.114881 & -1.0466 & 0.149158 \tabularnewline
21 & -0.251717 & -2.2933 & 0.012181 \tabularnewline
22 & -0.269129 & -2.4519 & 0.008154 \tabularnewline
23 & 0.15032 & 1.3695 & 0.087272 \tabularnewline
24 & 0.639835 & 5.8292 & 0 \tabularnewline
25 & 0.212416 & 1.9352 & 0.028186 \tabularnewline
26 & -0.246682 & -2.2474 & 0.013635 \tabularnewline
27 & -0.246033 & -2.2415 & 0.013833 \tabularnewline
28 & -0.116579 & -1.0621 & 0.145638 \tabularnewline
29 & 0.027602 & 0.2515 & 0.401039 \tabularnewline
30 & 0.112332 & 1.0234 & 0.154547 \tabularnewline
31 & 0.033231 & 0.3027 & 0.381419 \tabularnewline
32 & -0.083642 & -0.762 & 0.224106 \tabularnewline
33 & -0.198128 & -1.805 & 0.037348 \tabularnewline
34 & -0.208919 & -1.9033 & 0.030231 \tabularnewline
35 & 0.112434 & 1.0243 & 0.15433 \tabularnewline
36 & 0.517166 & 4.7116 & 5e-06 \tabularnewline
37 & 0.18632 & 1.6975 & 0.046678 \tabularnewline
38 & -0.186534 & -1.6994 & 0.046494 \tabularnewline
39 & -0.18109 & -1.6498 & 0.051381 \tabularnewline
40 & -0.101871 & -0.9281 & 0.178027 \tabularnewline
41 & 0.024819 & 0.2261 & 0.410836 \tabularnewline
42 & 0.082859 & 0.7549 & 0.226228 \tabularnewline
43 & 0.031833 & 0.29 & 0.386266 \tabularnewline
44 & -0.072586 & -0.6613 & 0.255128 \tabularnewline
45 & -0.154895 & -1.4112 & 0.080968 \tabularnewline
46 & -0.137338 & -1.2512 & 0.107187 \tabularnewline
47 & 0.077022 & 0.7017 & 0.242415 \tabularnewline
48 & 0.390803 & 3.5604 & 0.000308 \tabularnewline
49 & 0.140242 & 1.2777 & 0.102466 \tabularnewline
50 & -0.116011 & -1.0569 & 0.146809 \tabularnewline
51 & -0.144053 & -1.3124 & 0.096504 \tabularnewline
52 & -0.085278 & -0.7769 & 0.219708 \tabularnewline
53 & -0.002566 & -0.0234 & 0.490704 \tabularnewline
54 & 0.076974 & 0.7013 & 0.242549 \tabularnewline
55 & 0.009478 & 0.0863 & 0.465699 \tabularnewline
56 & -0.048155 & -0.4387 & 0.331006 \tabularnewline
57 & -0.111664 & -1.0173 & 0.155982 \tabularnewline
58 & -0.08301 & -0.7563 & 0.225819 \tabularnewline
59 & 0.038598 & 0.3516 & 0.363 \tabularnewline
60 & 0.247844 & 2.258 & 0.013286 \tabularnewline
\hline
\end{tabular}
%Source: https://freestatistics.org/blog/index.php?pk=224656&T=1

[TABLE]
[ROW][C]Autocorrelation Function[/C][/ROW]
[ROW][C]Time lag k[/C][C]ACF(k)[/C][C]T-STAT[/C][C]P-value[/C][/ROW]
[ROW][C]1[/C][C]0.247657[/C][C]2.2563[/C][C]0.013342[/C][/ROW]
[ROW][C]2[/C][C]-0.328247[/C][C]-2.9905[/C][C]0.001833[/C][/ROW]
[ROW][C]3[/C][C]-0.354678[/C][C]-3.2313[/C][C]0.000884[/C][/ROW]
[ROW][C]4[/C][C]-0.164047[/C][C]-1.4945[/C][C]0.069413[/C][/ROW]
[ROW][C]5[/C][C]0.02849[/C][C]0.2596[/C][C]0.397924[/C][/ROW]
[ROW][C]6[/C][C]0.17134[/C][C]1.561[/C][C]0.061166[/C][/ROW]
[ROW][C]7[/C][C]0.057033[/C][C]0.5196[/C][C]0.302365[/C][/ROW]
[ROW][C]8[/C][C]-0.13292[/C][C]-1.211[/C][C]0.114673[/C][/ROW]
[ROW][C]9[/C][C]-0.306525[/C][C]-2.7926[/C][C]0.003245[/C][/ROW]
[ROW][C]10[/C][C]-0.306145[/C][C]-2.7891[/C][C]0.003276[/C][/ROW]
[ROW][C]11[/C][C]0.203207[/C][C]1.8513[/C][C]0.033841[/C][/ROW]
[ROW][C]12[/C][C]0.80262[/C][C]7.3122[/C][C]0[/C][/ROW]
[ROW][C]13[/C][C]0.240939[/C][C]2.1951[/C][C]0.015476[/C][/ROW]
[ROW][C]14[/C][C]-0.306103[/C][C]-2.7887[/C][C]0.00328[/C][/ROW]
[ROW][C]15[/C][C]-0.285064[/C][C]-2.5971[/C][C]0.00556[/C][/ROW]
[ROW][C]16[/C][C]-0.149514[/C][C]-1.3621[/C][C]0.08842[/C][/ROW]
[ROW][C]17[/C][C]0.035501[/C][C]0.3234[/C][C]0.373591[/C][/ROW]
[ROW][C]18[/C][C]0.130713[/C][C]1.1909[/C][C]0.118553[/C][/ROW]
[ROW][C]19[/C][C]0.052215[/C][C]0.4757[/C][C]0.317769[/C][/ROW]
[ROW][C]20[/C][C]-0.114881[/C][C]-1.0466[/C][C]0.149158[/C][/ROW]
[ROW][C]21[/C][C]-0.251717[/C][C]-2.2933[/C][C]0.012181[/C][/ROW]
[ROW][C]22[/C][C]-0.269129[/C][C]-2.4519[/C][C]0.008154[/C][/ROW]
[ROW][C]23[/C][C]0.15032[/C][C]1.3695[/C][C]0.087272[/C][/ROW]
[ROW][C]24[/C][C]0.639835[/C][C]5.8292[/C][C]0[/C][/ROW]
[ROW][C]25[/C][C]0.212416[/C][C]1.9352[/C][C]0.028186[/C][/ROW]
[ROW][C]26[/C][C]-0.246682[/C][C]-2.2474[/C][C]0.013635[/C][/ROW]
[ROW][C]27[/C][C]-0.246033[/C][C]-2.2415[/C][C]0.013833[/C][/ROW]
[ROW][C]28[/C][C]-0.116579[/C][C]-1.0621[/C][C]0.145638[/C][/ROW]
[ROW][C]29[/C][C]0.027602[/C][C]0.2515[/C][C]0.401039[/C][/ROW]
[ROW][C]30[/C][C]0.112332[/C][C]1.0234[/C][C]0.154547[/C][/ROW]
[ROW][C]31[/C][C]0.033231[/C][C]0.3027[/C][C]0.381419[/C][/ROW]
[ROW][C]32[/C][C]-0.083642[/C][C]-0.762[/C][C]0.224106[/C][/ROW]
[ROW][C]33[/C][C]-0.198128[/C][C]-1.805[/C][C]0.037348[/C][/ROW]
[ROW][C]34[/C][C]-0.208919[/C][C]-1.9033[/C][C]0.030231[/C][/ROW]
[ROW][C]35[/C][C]0.112434[/C][C]1.0243[/C][C]0.15433[/C][/ROW]
[ROW][C]36[/C][C]0.517166[/C][C]4.7116[/C][C]5e-06[/C][/ROW]
[ROW][C]37[/C][C]0.18632[/C][C]1.6975[/C][C]0.046678[/C][/ROW]
[ROW][C]38[/C][C]-0.186534[/C][C]-1.6994[/C][C]0.046494[/C][/ROW]
[ROW][C]39[/C][C]-0.18109[/C][C]-1.6498[/C][C]0.051381[/C][/ROW]
[ROW][C]40[/C][C]-0.101871[/C][C]-0.9281[/C][C]0.178027[/C][/ROW]
[ROW][C]41[/C][C]0.024819[/C][C]0.2261[/C][C]0.410836[/C][/ROW]
[ROW][C]42[/C][C]0.082859[/C][C]0.7549[/C][C]0.226228[/C][/ROW]
[ROW][C]43[/C][C]0.031833[/C][C]0.29[/C][C]0.386266[/C][/ROW]
[ROW][C]44[/C][C]-0.072586[/C][C]-0.6613[/C][C]0.255128[/C][/ROW]
[ROW][C]45[/C][C]-0.154895[/C][C]-1.4112[/C][C]0.080968[/C][/ROW]
[ROW][C]46[/C][C]-0.137338[/C][C]-1.2512[/C][C]0.107187[/C][/ROW]
[ROW][C]47[/C][C]0.077022[/C][C]0.7017[/C][C]0.242415[/C][/ROW]
[ROW][C]48[/C][C]0.390803[/C][C]3.5604[/C][C]0.000308[/C][/ROW]
[ROW][C]49[/C][C]0.140242[/C][C]1.2777[/C][C]0.102466[/C][/ROW]
[ROW][C]50[/C][C]-0.116011[/C][C]-1.0569[/C][C]0.146809[/C][/ROW]
[ROW][C]51[/C][C]-0.144053[/C][C]-1.3124[/C][C]0.096504[/C][/ROW]
[ROW][C]52[/C][C]-0.085278[/C][C]-0.7769[/C][C]0.219708[/C][/ROW]
[ROW][C]53[/C][C]-0.002566[/C][C]-0.0234[/C][C]0.490704[/C][/ROW]
[ROW][C]54[/C][C]0.076974[/C][C]0.7013[/C][C]0.242549[/C][/ROW]
[ROW][C]55[/C][C]0.009478[/C][C]0.0863[/C][C]0.465699[/C][/ROW]
[ROW][C]56[/C][C]-0.048155[/C][C]-0.4387[/C][C]0.331006[/C][/ROW]
[ROW][C]57[/C][C]-0.111664[/C][C]-1.0173[/C][C]0.155982[/C][/ROW]
[ROW][C]58[/C][C]-0.08301[/C][C]-0.7563[/C][C]0.225819[/C][/ROW]
[ROW][C]59[/C][C]0.038598[/C][C]0.3516[/C][C]0.363[/C][/ROW]
[ROW][C]60[/C][C]0.247844[/C][C]2.258[/C][C]0.013286[/C][/ROW]
[/TABLE]
Source: https://freestatistics.org/blog/index.php?pk=224656&T=1

Globally Unique Identifier (entire table): ba.freestatistics.org/blog/index.php?pk=224656&T=1

As an alternative you can also use a QR Code:  

The GUIDs for individual cells are displayed in the table below:

Autocorrelation Function
Time lag kACF(k)T-STATP-value
10.2476572.25630.013342
2-0.328247-2.99050.001833
3-0.354678-3.23130.000884
4-0.164047-1.49450.069413
50.028490.25960.397924
60.171341.5610.061166
70.0570330.51960.302365
8-0.13292-1.2110.114673
9-0.306525-2.79260.003245
10-0.306145-2.78910.003276
110.2032071.85130.033841
120.802627.31220
130.2409392.19510.015476
14-0.306103-2.78870.00328
15-0.285064-2.59710.00556
16-0.149514-1.36210.08842
170.0355010.32340.373591
180.1307131.19090.118553
190.0522150.47570.317769
20-0.114881-1.04660.149158
21-0.251717-2.29330.012181
22-0.269129-2.45190.008154
230.150321.36950.087272
240.6398355.82920
250.2124161.93520.028186
26-0.246682-2.24740.013635
27-0.246033-2.24150.013833
28-0.116579-1.06210.145638
290.0276020.25150.401039
300.1123321.02340.154547
310.0332310.30270.381419
32-0.083642-0.7620.224106
33-0.198128-1.8050.037348
34-0.208919-1.90330.030231
350.1124341.02430.15433
360.5171664.71165e-06
370.186321.69750.046678
38-0.186534-1.69940.046494
39-0.18109-1.64980.051381
40-0.101871-0.92810.178027
410.0248190.22610.410836
420.0828590.75490.226228
430.0318330.290.386266
44-0.072586-0.66130.255128
45-0.154895-1.41120.080968
46-0.137338-1.25120.107187
470.0770220.70170.242415
480.3908033.56040.000308
490.1402421.27770.102466
50-0.116011-1.05690.146809
51-0.144053-1.31240.096504
52-0.085278-0.77690.219708
53-0.002566-0.02340.490704
540.0769740.70130.242549
550.0094780.08630.465699
56-0.048155-0.43870.331006
57-0.111664-1.01730.155982
58-0.08301-0.75630.225819
590.0385980.35160.363
600.2478442.2580.013286


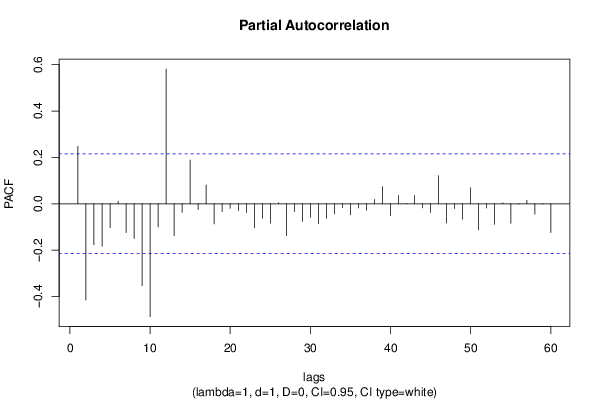
Partial Autocorrelation Function
Time lag kPACF(k)T-STATP-value
10.2476572.25630.013342
2-0.415037-3.78120.000147
3-0.176143-1.60470.056174
4-0.183341-1.67030.049312
5-0.103523-0.94310.174173
60.0113640.10350.458895
7-0.12359-1.1260.131714
8-0.149935-1.3660.087819
9-0.352967-3.21570.000928
10-0.486657-4.43371.4e-05
11-0.099479-0.90630.183701
120.5815975.29860
13-0.137519-1.25290.106888
14-0.036188-0.32970.371233
150.1887451.71960.04462
16-0.024728-0.22530.411157
170.0810050.7380.231302
18-0.086655-0.78950.216046
19-0.033381-0.30410.3809
20-0.018986-0.1730.431546
21-0.029532-0.2690.39428
22-0.037344-0.34020.367274
23-0.10342-0.94220.174412
24-0.062605-0.57040.284986
25-0.083225-0.75820.225234
260.0040630.0370.485279
27-0.137372-1.25150.107131
28-0.033154-0.3020.381687
29-0.076621-0.69810.243548
30-0.058496-0.53290.297754
31-0.086284-0.78610.217029
32-0.062079-0.56560.286609
33-0.043568-0.39690.346222
34-0.016693-0.15210.439746
35-0.047439-0.43220.333364
36-0.017687-0.16110.436189
37-0.027333-0.2490.401982
380.0184860.16840.433335
390.0732450.66730.253218
40-0.051344-0.46780.320589
410.0359480.32750.372056
420.0008620.00790.496875
430.0358260.32640.372476
44-0.017447-0.15890.437049
45-0.036357-0.33120.370655
460.1210061.10240.136733
47-0.083038-0.75650.225741
48-0.020052-0.18270.427745
49-0.06601-0.60140.274614
500.0686290.62520.266765
51-0.112035-1.02070.155184
52-0.017854-0.16270.43559
53-0.088469-0.8060.211275
540.0042290.03850.484679
55-0.084296-0.7680.222342
56-0.001254-0.01140.495455
570.0153930.14020.444406
58-0.044677-0.4070.342517
59-0.001282-0.01170.495356
60-0.124123-1.13080.130695

\begin{tabular}{lllllllll}
\hline
Partial Autocorrelation Function \tabularnewline
Time lag k & PACF(k) & T-STAT & P-value \tabularnewline
1 & 0.247657 & 2.2563 & 0.013342 \tabularnewline
2 & -0.415037 & -3.7812 & 0.000147 \tabularnewline
3 & -0.176143 & -1.6047 & 0.056174 \tabularnewline
4 & -0.183341 & -1.6703 & 0.049312 \tabularnewline
5 & -0.103523 & -0.9431 & 0.174173 \tabularnewline
6 & 0.011364 & 0.1035 & 0.458895 \tabularnewline
7 & -0.12359 & -1.126 & 0.131714 \tabularnewline
8 & -0.149935 & -1.366 & 0.087819 \tabularnewline
9 & -0.352967 & -3.2157 & 0.000928 \tabularnewline
10 & -0.486657 & -4.4337 & 1.4e-05 \tabularnewline
11 & -0.099479 & -0.9063 & 0.183701 \tabularnewline
12 & 0.581597 & 5.2986 & 0 \tabularnewline
13 & -0.137519 & -1.2529 & 0.106888 \tabularnewline
14 & -0.036188 & -0.3297 & 0.371233 \tabularnewline
15 & 0.188745 & 1.7196 & 0.04462 \tabularnewline
16 & -0.024728 & -0.2253 & 0.411157 \tabularnewline
17 & 0.081005 & 0.738 & 0.231302 \tabularnewline
18 & -0.086655 & -0.7895 & 0.216046 \tabularnewline
19 & -0.033381 & -0.3041 & 0.3809 \tabularnewline
20 & -0.018986 & -0.173 & 0.431546 \tabularnewline
21 & -0.029532 & -0.269 & 0.39428 \tabularnewline
22 & -0.037344 & -0.3402 & 0.367274 \tabularnewline
23 & -0.10342 & -0.9422 & 0.174412 \tabularnewline
24 & -0.062605 & -0.5704 & 0.284986 \tabularnewline
25 & -0.083225 & -0.7582 & 0.225234 \tabularnewline
26 & 0.004063 & 0.037 & 0.485279 \tabularnewline
27 & -0.137372 & -1.2515 & 0.107131 \tabularnewline
28 & -0.033154 & -0.302 & 0.381687 \tabularnewline
29 & -0.076621 & -0.6981 & 0.243548 \tabularnewline
30 & -0.058496 & -0.5329 & 0.297754 \tabularnewline
31 & -0.086284 & -0.7861 & 0.217029 \tabularnewline
32 & -0.062079 & -0.5656 & 0.286609 \tabularnewline
33 & -0.043568 & -0.3969 & 0.346222 \tabularnewline
34 & -0.016693 & -0.1521 & 0.439746 \tabularnewline
35 & -0.047439 & -0.4322 & 0.333364 \tabularnewline
36 & -0.017687 & -0.1611 & 0.436189 \tabularnewline
37 & -0.027333 & -0.249 & 0.401982 \tabularnewline
38 & 0.018486 & 0.1684 & 0.433335 \tabularnewline
39 & 0.073245 & 0.6673 & 0.253218 \tabularnewline
40 & -0.051344 & -0.4678 & 0.320589 \tabularnewline
41 & 0.035948 & 0.3275 & 0.372056 \tabularnewline
42 & 0.000862 & 0.0079 & 0.496875 \tabularnewline
43 & 0.035826 & 0.3264 & 0.372476 \tabularnewline
44 & -0.017447 & -0.1589 & 0.437049 \tabularnewline
45 & -0.036357 & -0.3312 & 0.370655 \tabularnewline
46 & 0.121006 & 1.1024 & 0.136733 \tabularnewline
47 & -0.083038 & -0.7565 & 0.225741 \tabularnewline
48 & -0.020052 & -0.1827 & 0.427745 \tabularnewline
49 & -0.06601 & -0.6014 & 0.274614 \tabularnewline
50 & 0.068629 & 0.6252 & 0.266765 \tabularnewline
51 & -0.112035 & -1.0207 & 0.155184 \tabularnewline
52 & -0.017854 & -0.1627 & 0.43559 \tabularnewline
53 & -0.088469 & -0.806 & 0.211275 \tabularnewline
54 & 0.004229 & 0.0385 & 0.484679 \tabularnewline
55 & -0.084296 & -0.768 & 0.222342 \tabularnewline
56 & -0.001254 & -0.0114 & 0.495455 \tabularnewline
57 & 0.015393 & 0.1402 & 0.444406 \tabularnewline
58 & -0.044677 & -0.407 & 0.342517 \tabularnewline
59 & -0.001282 & -0.0117 & 0.495356 \tabularnewline
60 & -0.124123 & -1.1308 & 0.130695 \tabularnewline
\hline
\end{tabular}
%Source: https://freestatistics.org/blog/index.php?pk=224656&T=2

[TABLE]
[ROW][C]Partial Autocorrelation Function[/C][/ROW]
[ROW][C]Time lag k[/C][C]PACF(k)[/C][C]T-STAT[/C][C]P-value[/C][/ROW]
[ROW][C]1[/C][C]0.247657[/C][C]2.2563[/C][C]0.013342[/C][/ROW]
[ROW][C]2[/C][C]-0.415037[/C][C]-3.7812[/C][C]0.000147[/C][/ROW]
[ROW][C]3[/C][C]-0.176143[/C][C]-1.6047[/C][C]0.056174[/C][/ROW]
[ROW][C]4[/C][C]-0.183341[/C][C]-1.6703[/C][C]0.049312[/C][/ROW]
[ROW][C]5[/C][C]-0.103523[/C][C]-0.9431[/C][C]0.174173[/C][/ROW]
[ROW][C]6[/C][C]0.011364[/C][C]0.1035[/C][C]0.458895[/C][/ROW]
[ROW][C]7[/C][C]-0.12359[/C][C]-1.126[/C][C]0.131714[/C][/ROW]
[ROW][C]8[/C][C]-0.149935[/C][C]-1.366[/C][C]0.087819[/C][/ROW]
[ROW][C]9[/C][C]-0.352967[/C][C]-3.2157[/C][C]0.000928[/C][/ROW]
[ROW][C]10[/C][C]-0.486657[/C][C]-4.4337[/C][C]1.4e-05[/C][/ROW]
[ROW][C]11[/C][C]-0.099479[/C][C]-0.9063[/C][C]0.183701[/C][/ROW]
[ROW][C]12[/C][C]0.581597[/C][C]5.2986[/C][C]0[/C][/ROW]
[ROW][C]13[/C][C]-0.137519[/C][C]-1.2529[/C][C]0.106888[/C][/ROW]
[ROW][C]14[/C][C]-0.036188[/C][C]-0.3297[/C][C]0.371233[/C][/ROW]
[ROW][C]15[/C][C]0.188745[/C][C]1.7196[/C][C]0.04462[/C][/ROW]
[ROW][C]16[/C][C]-0.024728[/C][C]-0.2253[/C][C]0.411157[/C][/ROW]
[ROW][C]17[/C][C]0.081005[/C][C]0.738[/C][C]0.231302[/C][/ROW]
[ROW][C]18[/C][C]-0.086655[/C][C]-0.7895[/C][C]0.216046[/C][/ROW]
[ROW][C]19[/C][C]-0.033381[/C][C]-0.3041[/C][C]0.3809[/C][/ROW]
[ROW][C]20[/C][C]-0.018986[/C][C]-0.173[/C][C]0.431546[/C][/ROW]
[ROW][C]21[/C][C]-0.029532[/C][C]-0.269[/C][C]0.39428[/C][/ROW]
[ROW][C]22[/C][C]-0.037344[/C][C]-0.3402[/C][C]0.367274[/C][/ROW]
[ROW][C]23[/C][C]-0.10342[/C][C]-0.9422[/C][C]0.174412[/C][/ROW]
[ROW][C]24[/C][C]-0.062605[/C][C]-0.5704[/C][C]0.284986[/C][/ROW]
[ROW][C]25[/C][C]-0.083225[/C][C]-0.7582[/C][C]0.225234[/C][/ROW]
[ROW][C]26[/C][C]0.004063[/C][C]0.037[/C][C]0.485279[/C][/ROW]
[ROW][C]27[/C][C]-0.137372[/C][C]-1.2515[/C][C]0.107131[/C][/ROW]
[ROW][C]28[/C][C]-0.033154[/C][C]-0.302[/C][C]0.381687[/C][/ROW]
[ROW][C]29[/C][C]-0.076621[/C][C]-0.6981[/C][C]0.243548[/C][/ROW]
[ROW][C]30[/C][C]-0.058496[/C][C]-0.5329[/C][C]0.297754[/C][/ROW]
[ROW][C]31[/C][C]-0.086284[/C][C]-0.7861[/C][C]0.217029[/C][/ROW]
[ROW][C]32[/C][C]-0.062079[/C][C]-0.5656[/C][C]0.286609[/C][/ROW]
[ROW][C]33[/C][C]-0.043568[/C][C]-0.3969[/C][C]0.346222[/C][/ROW]
[ROW][C]34[/C][C]-0.016693[/C][C]-0.1521[/C][C]0.439746[/C][/ROW]
[ROW][C]35[/C][C]-0.047439[/C][C]-0.4322[/C][C]0.333364[/C][/ROW]
[ROW][C]36[/C][C]-0.017687[/C][C]-0.1611[/C][C]0.436189[/C][/ROW]
[ROW][C]37[/C][C]-0.027333[/C][C]-0.249[/C][C]0.401982[/C][/ROW]
[ROW][C]38[/C][C]0.018486[/C][C]0.1684[/C][C]0.433335[/C][/ROW]
[ROW][C]39[/C][C]0.073245[/C][C]0.6673[/C][C]0.253218[/C][/ROW]
[ROW][C]40[/C][C]-0.051344[/C][C]-0.4678[/C][C]0.320589[/C][/ROW]
[ROW][C]41[/C][C]0.035948[/C][C]0.3275[/C][C]0.372056[/C][/ROW]
[ROW][C]42[/C][C]0.000862[/C][C]0.0079[/C][C]0.496875[/C][/ROW]
[ROW][C]43[/C][C]0.035826[/C][C]0.3264[/C][C]0.372476[/C][/ROW]
[ROW][C]44[/C][C]-0.017447[/C][C]-0.1589[/C][C]0.437049[/C][/ROW]
[ROW][C]45[/C][C]-0.036357[/C][C]-0.3312[/C][C]0.370655[/C][/ROW]
[ROW][C]46[/C][C]0.121006[/C][C]1.1024[/C][C]0.136733[/C][/ROW]
[ROW][C]47[/C][C]-0.083038[/C][C]-0.7565[/C][C]0.225741[/C][/ROW]
[ROW][C]48[/C][C]-0.020052[/C][C]-0.1827[/C][C]0.427745[/C][/ROW]
[ROW][C]49[/C][C]-0.06601[/C][C]-0.6014[/C][C]0.274614[/C][/ROW]
[ROW][C]50[/C][C]0.068629[/C][C]0.6252[/C][C]0.266765[/C][/ROW]
[ROW][C]51[/C][C]-0.112035[/C][C]-1.0207[/C][C]0.155184[/C][/ROW]
[ROW][C]52[/C][C]-0.017854[/C][C]-0.1627[/C][C]0.43559[/C][/ROW]
[ROW][C]53[/C][C]-0.088469[/C][C]-0.806[/C][C]0.211275[/C][/ROW]
[ROW][C]54[/C][C]0.004229[/C][C]0.0385[/C][C]0.484679[/C][/ROW]
[ROW][C]55[/C][C]-0.084296[/C][C]-0.768[/C][C]0.222342[/C][/ROW]
[ROW][C]56[/C][C]-0.001254[/C][C]-0.0114[/C][C]0.495455[/C][/ROW]
[ROW][C]57[/C][C]0.015393[/C][C]0.1402[/C][C]0.444406[/C][/ROW]
[ROW][C]58[/C][C]-0.044677[/C][C]-0.407[/C][C]0.342517[/C][/ROW]
[ROW][C]59[/C][C]-0.001282[/C][C]-0.0117[/C][C]0.495356[/C][/ROW]
[ROW][C]60[/C][C]-0.124123[/C][C]-1.1308[/C][C]0.130695[/C][/ROW]
[/TABLE]
Source: https://freestatistics.org/blog/index.php?pk=224656&T=2

Globally Unique Identifier (entire table): ba.freestatistics.org/blog/index.php?pk=224656&T=2

As an alternative you can also use a QR Code:  

The GUIDs for individual cells are displayed in the table below:

Partial Autocorrelation Function
Time lag kPACF(k)T-STATP-value
10.2476572.25630.013342
2-0.415037-3.78120.000147
3-0.176143-1.60470.056174
4-0.183341-1.67030.049312
5-0.103523-0.94310.174173
60.0113640.10350.458895
7-0.12359-1.1260.131714
8-0.149935-1.3660.087819
9-0.352967-3.21570.000928
10-0.486657-4.43371.4e-05
11-0.099479-0.90630.183701
120.5815975.29860
13-0.137519-1.25290.106888
14-0.036188-0.32970.371233
150.1887451.71960.04462
16-0.024728-0.22530.411157
170.0810050.7380.231302
18-0.086655-0.78950.216046
19-0.033381-0.30410.3809
20-0.018986-0.1730.431546
21-0.029532-0.2690.39428
22-0.037344-0.34020.367274
23-0.10342-0.94220.174412
24-0.062605-0.57040.284986
25-0.083225-0.75820.225234
260.0040630.0370.485279
27-0.137372-1.25150.107131
28-0.033154-0.3020.381687
29-0.076621-0.69810.243548
30-0.058496-0.53290.297754
31-0.086284-0.78610.217029
32-0.062079-0.56560.286609
33-0.043568-0.39690.346222
34-0.016693-0.15210.439746
35-0.047439-0.43220.333364
36-0.017687-0.16110.436189
37-0.027333-0.2490.401982
380.0184860.16840.433335
390.0732450.66730.253218
40-0.051344-0.46780.320589
410.0359480.32750.372056
420.0008620.00790.496875
430.0358260.32640.372476
44-0.017447-0.15890.437049
45-0.036357-0.33120.370655
460.1210061.10240.136733
47-0.083038-0.75650.225741
48-0.020052-0.18270.427745
49-0.06601-0.60140.274614
500.0686290.62520.266765
51-0.112035-1.02070.155184
52-0.017854-0.16270.43559
53-0.088469-0.8060.211275
540.0042290.03850.484679
55-0.084296-0.7680.222342
56-0.001254-0.01140.495455
570.0153930.14020.444406
58-0.044677-0.4070.342517
59-0.001282-0.01170.495356
60-0.124123-1.13080.130695


Parameters (Session):
par1 = 60 ; par2 = 1 ; par3 = 1 ; par4 = 0 ; par5 = 12 ; par6 = White Noise ; par7 = 0.95 ;
Parameters (R input):
par1 = 60 ; par2 = 1 ; par3 = 1 ; par4 = 0 ; par5 = 12 ; par6 = White Noise ; par7 = 0.95 ; par8 = ;
R code (references can be found in the software module):
par8 <- ''
par7 <- '0.95'
par6 <- 'White Noise'
par5 <- '12'
par4 <- '0'
par3 <- '1'
par2 <- '1'
par1 <- '60'
if (par1 == 'Default') {
par1 = 10*log10(length(x))
} else {
par1 <- as.numeric(par1)
}
par2 <- as.numeric(par2)
par3 <- as.numeric(par3)
par4 <- as.numeric(par4)
par5 <- as.numeric(par5)
if (par6 == 'White Noise') par6 <- 'white' else par6 <- 'ma'
par7 <- as.numeric(par7)
if (par8 != '') par8 <- as.numeric(par8)
ox <- x
if (par8 == '') {
if (par2 == 0) {
x <- log(x)
} else {
x <- (x ^ par2 - 1) / par2
}
} else {
x <- log(x,base=par8)
}
if (par3 > 0) x <- diff(x,lag=1,difference=par3)
if (par4 > 0) x <- diff(x,lag=par5,difference=par4)
bitmap(file='picts.png')
op <- par(mfrow=c(2,1))
plot(ox,type='l',main='Original Time Series',xlab='time',ylab='value')
if (par8=='') {
mytitle <- paste('Working Time Series (lambda=',par2,', d=',par3,', D=',par4,')',sep='')
mysub <- paste('(lambda=',par2,', d=',par3,', D=',par4,', CI=', par7, ', CI type=',par6,')',sep='')
} else {
mytitle <- paste('Working Time Series (base=',par8,', d=',par3,', D=',par4,')',sep='')
mysub <- paste('(base=',par8,', d=',par3,', D=',par4,', CI=', par7, ', CI type=',par6,')',sep='')
}
plot(x,type='l', main=mytitle,xlab='time',ylab='value')
par(op)
dev.off()
bitmap(file='pic1.png')
racf <- acf(x, par1, main='Autocorrelation', xlab='time lag', ylab='ACF', ci.type=par6, ci=par7, sub=mysub)
dev.off()
bitmap(file='pic2.png')
rpacf <- pacf(x,par1,main='Partial Autocorrelation',xlab='lags',ylab='PACF',sub=mysub)
dev.off()
(myacf <- c(racf$acf))
(mypacf <- c(rpacf$acf))
lengthx <- length(x)
sqrtn <- sqrt(lengthx)
load(file='createtable')
a<-table.start()
a<-table.row.start(a)
a<-table.element(a,'Autocorrelation Function',4,TRUE)
a<-table.row.end(a)
a<-table.row.start(a)
a<-table.element(a,'Time lag k',header=TRUE)
a<-table.element(a,hyperlink('basics.htm','ACF(k)','click here for more information about the Autocorrelation Function'),header=TRUE)
a<-table.element(a,'T-STAT',header=TRUE)
a<-table.element(a,'P-value',header=TRUE)
a<-table.row.end(a)
for (i in 2:(par1+1)) {
a<-table.row.start(a)
a<-table.element(a,i-1,header=TRUE)
a<-table.element(a,round(myacf[i],6))
mytstat <- myacf[i]*sqrtn
a<-table.element(a,round(mytstat,4))
a<-table.element(a,round(1-pt(abs(mytstat),lengthx),6))
a<-table.row.end(a)
}
a<-table.end(a)
table.save(a,file='mytable.tab')
a<-table.start()
a<-table.row.start(a)
a<-table.element(a,'Partial Autocorrelation Function',4,TRUE)
a<-table.row.end(a)
a<-table.row.start(a)
a<-table.element(a,'Time lag k',header=TRUE)
a<-table.element(a,hyperlink('basics.htm','PACF(k)','click here for more information about the Partial Autocorrelation Function'),header=TRUE)
a<-table.element(a,'T-STAT',header=TRUE)
a<-table.element(a,'P-value',header=TRUE)
a<-table.row.end(a)
for (i in 1:par1) {
a<-table.row.start(a)
a<-table.element(a,i,header=TRUE)
a<-table.element(a,round(mypacf[i],6))
mytstat <- mypacf[i]*sqrtn
a<-table.element(a,round(mytstat,4))
a<-table.element(a,round(1-pt(abs(mytstat),lengthx),6))
a<-table.row.end(a)
}
a<-table.end(a)
table.save(a,file='mytable1.tab')