Free Statistics

of Irreproducible Research!

Author's title

Author*Unverified author*
R Software Modulerwasp_autocorrelation.wasp
Title produced by software(Partial) Autocorrelation Function
Date of computationWed, 13 Nov 2013 04:06:12 -0500
Cite this page as followsStatistical Computations at FreeStatistics.org, Office for Research Development and Education, URL https://freestatistics.org/blog/index.php?v=date/2013/Nov/13/t1384333616219qcj0xa38oacn.htm/, Retrieved Sun, 28 Apr 2024 19:32:31 +0000
Statistical Computations at FreeStatistics.org, Office for Research Development and Education, URL https://freestatistics.org/blog/index.php?pk=224649, Retrieved Sun, 28 Apr 2024 19:32:31 +0000
QR Codes:

Original text written by user:
IsPrivate?No (this computation is public)
User-defined keywords
Estimated Impact62
Family? (F = Feedback message, R = changed R code, M = changed R Module, P = changed Parameters, D = changed Data)
-       [(Partial) Autocorrelation Function] [] [2013-11-13 09:06:12] [bc709afd059270defb36fb1011c3ea57] [Current]
Feedback Forum

Post a new message
Dataseries X:
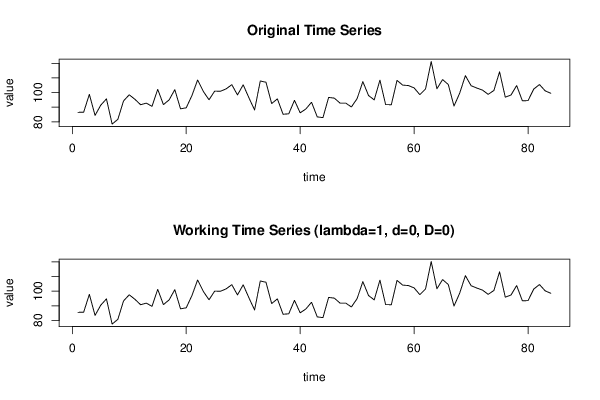
86,5
86,6
98,8
84,4
91,4
95,7
78,5
81,7
94,3
98,5
95,4
91,7
92,8
90,6
102,2
91,8
95
102
88,9
89,6
97,9
108,6
100,8
95,1
101
100,9
102,5
105,4
98,4
105,3
96,5
88,1
107,9
107,1
92,5
95,7
85,2
85,5
94,7
86,2
88,8
93,4
83,4
82,9
96,7
96,2
92,8
92,8
90,2
95,9
107,5
98
95
108,5
91,8
91,7
108,3
105,1
104,8
103,2
98,6
102,4
121,2
102,6
108,9
105,5
90,8
99,6
111,6
104,7
103,1
101,7
98,8
101,4
114,2
96,9
98,3
104,8
94,4
94,5
102,4
105,5
101,2
99,5


Summary of computational transaction
Raw Inputview raw input (R code)
Raw Outputview raw output of R engine
Computing time3 seconds
R Server'Gwilym Jenkins' @ jenkins.wessa.net

\begin{tabular}{lllllllll}
\hline
Summary of computational transaction \tabularnewline
Raw Input & view raw input (R code)  \tabularnewline
Raw Output & view raw output of R engine  \tabularnewline
Computing time & 3 seconds \tabularnewline
R Server & 'Gwilym Jenkins' @ jenkins.wessa.net \tabularnewline
\hline
\end{tabular}
%Source: https://freestatistics.org/blog/index.php?pk=224649&T=0

[TABLE]
[ROW][C]Summary of computational transaction[/C][/ROW]
[ROW][C]Raw Input[/C][C]view raw input (R code) [/C][/ROW]
[ROW][C]Raw Output[/C][C]view raw output of R engine [/C][/ROW]
[ROW][C]Computing time[/C][C]3 seconds[/C][/ROW]
[ROW][C]R Server[/C][C]'Gwilym Jenkins' @ jenkins.wessa.net[/C][/ROW]
[/TABLE]
Source: https://freestatistics.org/blog/index.php?pk=224649&T=0

Globally Unique Identifier (entire table): ba.freestatistics.org/blog/index.php?pk=224649&T=0

As an alternative you can also use a QR Code:  

The GUIDs for individual cells are displayed in the table below:

Summary of computational transaction
Raw Inputview raw input (R code)
Raw Outputview raw output of R engine
Computing time3 seconds
R Server'Gwilym Jenkins' @ jenkins.wessa.net


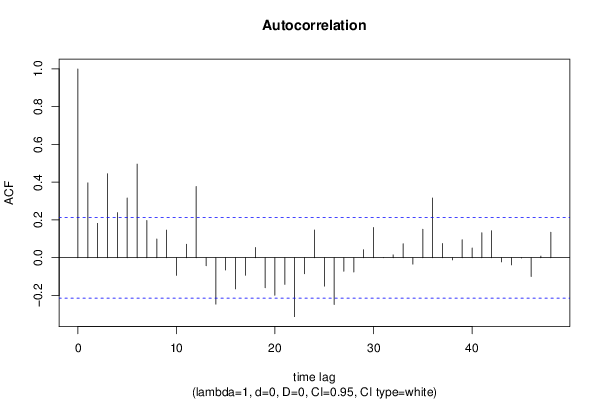
Autocorrelation Function
Time lag kACF(k)T-STATP-value
10.3968053.63680.000238
20.1821981.66990.049334
30.445154.07995.1e-05
40.2389312.18980.015654
50.3164262.90010.00238
60.4959724.54579e-06
70.1975731.81080.036874
80.09960.91280.181967
90.1462591.34050.091851
10-0.09325-0.85460.197589
110.0718260.65830.256075
120.3772383.45740.000429
13-0.04266-0.3910.348399
14-0.245581-2.25080.013506
15-0.065416-0.59950.275211
16-0.165057-1.51280.067045
17-0.092606-0.84870.199216
180.0542380.49710.31021
19-0.159325-1.46020.073978
20-0.198444-1.81880.036255
21-0.141194-1.29410.099595
22-0.312022-2.85970.002674
23-0.084939-0.77850.219237
240.1471061.34820.090601
25-0.150364-1.37810.085914
26-0.24766-2.26980.012889
27-0.071422-0.65460.25726
28-0.075873-0.69540.244367
290.042680.39120.348331
300.1601351.46770.072965
31-0.000617-0.00570.497752
320.0151770.13910.444852
330.0737410.67580.250498
34-0.033878-0.31050.378475
350.15141.38760.084464
360.3166462.90210.002366
370.0752210.68940.246232
38-0.01136-0.10410.458664
390.0952570.8730.192564
400.051480.47180.31914
410.1328531.21760.113389
420.1428231.3090.097053
43-0.021798-0.19980.421068
44-0.037697-0.34550.365291
45-0.001209-0.01110.495592
46-0.099772-0.91440.181554
470.0086710.07950.468424
480.1352191.23930.109342

\begin{tabular}{lllllllll}
\hline
Autocorrelation Function \tabularnewline
Time lag k & ACF(k) & T-STAT & P-value \tabularnewline
1 & 0.396805 & 3.6368 & 0.000238 \tabularnewline
2 & 0.182198 & 1.6699 & 0.049334 \tabularnewline
3 & 0.44515 & 4.0799 & 5.1e-05 \tabularnewline
4 & 0.238931 & 2.1898 & 0.015654 \tabularnewline
5 & 0.316426 & 2.9001 & 0.00238 \tabularnewline
6 & 0.495972 & 4.5457 & 9e-06 \tabularnewline
7 & 0.197573 & 1.8108 & 0.036874 \tabularnewline
8 & 0.0996 & 0.9128 & 0.181967 \tabularnewline
9 & 0.146259 & 1.3405 & 0.091851 \tabularnewline
10 & -0.09325 & -0.8546 & 0.197589 \tabularnewline
11 & 0.071826 & 0.6583 & 0.256075 \tabularnewline
12 & 0.377238 & 3.4574 & 0.000429 \tabularnewline
13 & -0.04266 & -0.391 & 0.348399 \tabularnewline
14 & -0.245581 & -2.2508 & 0.013506 \tabularnewline
15 & -0.065416 & -0.5995 & 0.275211 \tabularnewline
16 & -0.165057 & -1.5128 & 0.067045 \tabularnewline
17 & -0.092606 & -0.8487 & 0.199216 \tabularnewline
18 & 0.054238 & 0.4971 & 0.31021 \tabularnewline
19 & -0.159325 & -1.4602 & 0.073978 \tabularnewline
20 & -0.198444 & -1.8188 & 0.036255 \tabularnewline
21 & -0.141194 & -1.2941 & 0.099595 \tabularnewline
22 & -0.312022 & -2.8597 & 0.002674 \tabularnewline
23 & -0.084939 & -0.7785 & 0.219237 \tabularnewline
24 & 0.147106 & 1.3482 & 0.090601 \tabularnewline
25 & -0.150364 & -1.3781 & 0.085914 \tabularnewline
26 & -0.24766 & -2.2698 & 0.012889 \tabularnewline
27 & -0.071422 & -0.6546 & 0.25726 \tabularnewline
28 & -0.075873 & -0.6954 & 0.244367 \tabularnewline
29 & 0.04268 & 0.3912 & 0.348331 \tabularnewline
30 & 0.160135 & 1.4677 & 0.072965 \tabularnewline
31 & -0.000617 & -0.0057 & 0.497752 \tabularnewline
32 & 0.015177 & 0.1391 & 0.444852 \tabularnewline
33 & 0.073741 & 0.6758 & 0.250498 \tabularnewline
34 & -0.033878 & -0.3105 & 0.378475 \tabularnewline
35 & 0.1514 & 1.3876 & 0.084464 \tabularnewline
36 & 0.316646 & 2.9021 & 0.002366 \tabularnewline
37 & 0.075221 & 0.6894 & 0.246232 \tabularnewline
38 & -0.01136 & -0.1041 & 0.458664 \tabularnewline
39 & 0.095257 & 0.873 & 0.192564 \tabularnewline
40 & 0.05148 & 0.4718 & 0.31914 \tabularnewline
41 & 0.132853 & 1.2176 & 0.113389 \tabularnewline
42 & 0.142823 & 1.309 & 0.097053 \tabularnewline
43 & -0.021798 & -0.1998 & 0.421068 \tabularnewline
44 & -0.037697 & -0.3455 & 0.365291 \tabularnewline
45 & -0.001209 & -0.0111 & 0.495592 \tabularnewline
46 & -0.099772 & -0.9144 & 0.181554 \tabularnewline
47 & 0.008671 & 0.0795 & 0.468424 \tabularnewline
48 & 0.135219 & 1.2393 & 0.109342 \tabularnewline
\hline
\end{tabular}
%Source: https://freestatistics.org/blog/index.php?pk=224649&T=1

[TABLE]
[ROW][C]Autocorrelation Function[/C][/ROW]
[ROW][C]Time lag k[/C][C]ACF(k)[/C][C]T-STAT[/C][C]P-value[/C][/ROW]
[ROW][C]1[/C][C]0.396805[/C][C]3.6368[/C][C]0.000238[/C][/ROW]
[ROW][C]2[/C][C]0.182198[/C][C]1.6699[/C][C]0.049334[/C][/ROW]
[ROW][C]3[/C][C]0.44515[/C][C]4.0799[/C][C]5.1e-05[/C][/ROW]
[ROW][C]4[/C][C]0.238931[/C][C]2.1898[/C][C]0.015654[/C][/ROW]
[ROW][C]5[/C][C]0.316426[/C][C]2.9001[/C][C]0.00238[/C][/ROW]
[ROW][C]6[/C][C]0.495972[/C][C]4.5457[/C][C]9e-06[/C][/ROW]
[ROW][C]7[/C][C]0.197573[/C][C]1.8108[/C][C]0.036874[/C][/ROW]
[ROW][C]8[/C][C]0.0996[/C][C]0.9128[/C][C]0.181967[/C][/ROW]
[ROW][C]9[/C][C]0.146259[/C][C]1.3405[/C][C]0.091851[/C][/ROW]
[ROW][C]10[/C][C]-0.09325[/C][C]-0.8546[/C][C]0.197589[/C][/ROW]
[ROW][C]11[/C][C]0.071826[/C][C]0.6583[/C][C]0.256075[/C][/ROW]
[ROW][C]12[/C][C]0.377238[/C][C]3.4574[/C][C]0.000429[/C][/ROW]
[ROW][C]13[/C][C]-0.04266[/C][C]-0.391[/C][C]0.348399[/C][/ROW]
[ROW][C]14[/C][C]-0.245581[/C][C]-2.2508[/C][C]0.013506[/C][/ROW]
[ROW][C]15[/C][C]-0.065416[/C][C]-0.5995[/C][C]0.275211[/C][/ROW]
[ROW][C]16[/C][C]-0.165057[/C][C]-1.5128[/C][C]0.067045[/C][/ROW]
[ROW][C]17[/C][C]-0.092606[/C][C]-0.8487[/C][C]0.199216[/C][/ROW]
[ROW][C]18[/C][C]0.054238[/C][C]0.4971[/C][C]0.31021[/C][/ROW]
[ROW][C]19[/C][C]-0.159325[/C][C]-1.4602[/C][C]0.073978[/C][/ROW]
[ROW][C]20[/C][C]-0.198444[/C][C]-1.8188[/C][C]0.036255[/C][/ROW]
[ROW][C]21[/C][C]-0.141194[/C][C]-1.2941[/C][C]0.099595[/C][/ROW]
[ROW][C]22[/C][C]-0.312022[/C][C]-2.8597[/C][C]0.002674[/C][/ROW]
[ROW][C]23[/C][C]-0.084939[/C][C]-0.7785[/C][C]0.219237[/C][/ROW]
[ROW][C]24[/C][C]0.147106[/C][C]1.3482[/C][C]0.090601[/C][/ROW]
[ROW][C]25[/C][C]-0.150364[/C][C]-1.3781[/C][C]0.085914[/C][/ROW]
[ROW][C]26[/C][C]-0.24766[/C][C]-2.2698[/C][C]0.012889[/C][/ROW]
[ROW][C]27[/C][C]-0.071422[/C][C]-0.6546[/C][C]0.25726[/C][/ROW]
[ROW][C]28[/C][C]-0.075873[/C][C]-0.6954[/C][C]0.244367[/C][/ROW]
[ROW][C]29[/C][C]0.04268[/C][C]0.3912[/C][C]0.348331[/C][/ROW]
[ROW][C]30[/C][C]0.160135[/C][C]1.4677[/C][C]0.072965[/C][/ROW]
[ROW][C]31[/C][C]-0.000617[/C][C]-0.0057[/C][C]0.497752[/C][/ROW]
[ROW][C]32[/C][C]0.015177[/C][C]0.1391[/C][C]0.444852[/C][/ROW]
[ROW][C]33[/C][C]0.073741[/C][C]0.6758[/C][C]0.250498[/C][/ROW]
[ROW][C]34[/C][C]-0.033878[/C][C]-0.3105[/C][C]0.378475[/C][/ROW]
[ROW][C]35[/C][C]0.1514[/C][C]1.3876[/C][C]0.084464[/C][/ROW]
[ROW][C]36[/C][C]0.316646[/C][C]2.9021[/C][C]0.002366[/C][/ROW]
[ROW][C]37[/C][C]0.075221[/C][C]0.6894[/C][C]0.246232[/C][/ROW]
[ROW][C]38[/C][C]-0.01136[/C][C]-0.1041[/C][C]0.458664[/C][/ROW]
[ROW][C]39[/C][C]0.095257[/C][C]0.873[/C][C]0.192564[/C][/ROW]
[ROW][C]40[/C][C]0.05148[/C][C]0.4718[/C][C]0.31914[/C][/ROW]
[ROW][C]41[/C][C]0.132853[/C][C]1.2176[/C][C]0.113389[/C][/ROW]
[ROW][C]42[/C][C]0.142823[/C][C]1.309[/C][C]0.097053[/C][/ROW]
[ROW][C]43[/C][C]-0.021798[/C][C]-0.1998[/C][C]0.421068[/C][/ROW]
[ROW][C]44[/C][C]-0.037697[/C][C]-0.3455[/C][C]0.365291[/C][/ROW]
[ROW][C]45[/C][C]-0.001209[/C][C]-0.0111[/C][C]0.495592[/C][/ROW]
[ROW][C]46[/C][C]-0.099772[/C][C]-0.9144[/C][C]0.181554[/C][/ROW]
[ROW][C]47[/C][C]0.008671[/C][C]0.0795[/C][C]0.468424[/C][/ROW]
[ROW][C]48[/C][C]0.135219[/C][C]1.2393[/C][C]0.109342[/C][/ROW]
[/TABLE]
Source: https://freestatistics.org/blog/index.php?pk=224649&T=1

Globally Unique Identifier (entire table): ba.freestatistics.org/blog/index.php?pk=224649&T=1

As an alternative you can also use a QR Code:  

The GUIDs for individual cells are displayed in the table below:

Autocorrelation Function
Time lag kACF(k)T-STATP-value
10.3968053.63680.000238
20.1821981.66990.049334
30.445154.07995.1e-05
40.2389312.18980.015654
50.3164262.90010.00238
60.4959724.54579e-06
70.1975731.81080.036874
80.09960.91280.181967
90.1462591.34050.091851
10-0.09325-0.85460.197589
110.0718260.65830.256075
120.3772383.45740.000429
13-0.04266-0.3910.348399
14-0.245581-2.25080.013506
15-0.065416-0.59950.275211
16-0.165057-1.51280.067045
17-0.092606-0.84870.199216
180.0542380.49710.31021
19-0.159325-1.46020.073978
20-0.198444-1.81880.036255
21-0.141194-1.29410.099595
22-0.312022-2.85970.002674
23-0.084939-0.77850.219237
240.1471061.34820.090601
25-0.150364-1.37810.085914
26-0.24766-2.26980.012889
27-0.071422-0.65460.25726
28-0.075873-0.69540.244367
290.042680.39120.348331
300.1601351.46770.072965
31-0.000617-0.00570.497752
320.0151770.13910.444852
330.0737410.67580.250498
34-0.033878-0.31050.378475
350.15141.38760.084464
360.3166462.90210.002366
370.0752210.68940.246232
38-0.01136-0.10410.458664
390.0952570.8730.192564
400.051480.47180.31914
410.1328531.21760.113389
420.1428231.3090.097053
43-0.021798-0.19980.421068
44-0.037697-0.34550.365291
45-0.001209-0.01110.495592
46-0.099772-0.91440.181554
470.0086710.07950.468424
480.1352191.23930.109342


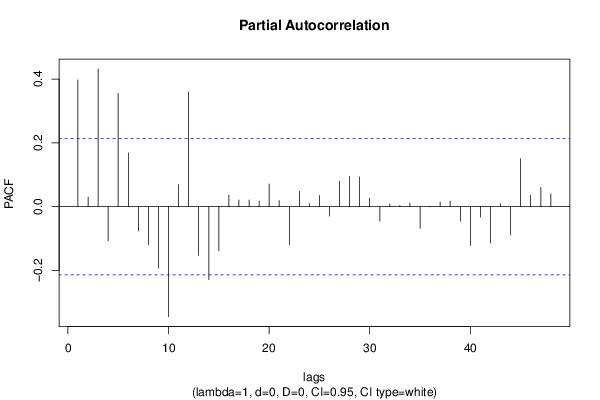
Partial Autocorrelation Function
Time lag kPACF(k)T-STATP-value
10.3968053.63680.000238
20.0293680.26920.394233
30.4315933.95567.9e-05
4-0.106859-0.97940.165103
50.3549363.2530.000823
60.1682951.54240.063362
7-0.076398-0.70020.24287
8-0.119736-1.09740.137802
9-0.192399-1.76340.040737
10-0.344929-3.16130.001092
110.0691410.63370.264003
120.3590953.29120.00073
13-0.152579-1.39840.082835
14-0.228531-2.09450.019613
15-0.138399-1.26840.104072
160.0363340.3330.369978
170.020920.19170.424205
180.020390.18690.426102
190.017790.1630.435435
200.0709380.65020.258682
210.0188390.17270.431666
22-0.118737-1.08820.1398
230.0480150.44010.33051
240.0093120.08530.466093
250.0350840.32150.374297
26-0.029588-0.27120.39346
270.0795950.72950.233862
280.0952010.87250.192702
290.0928660.85110.198559
300.0261180.23940.405697
31-0.045347-0.41560.339376
320.0079530.07290.471034
330.0034660.03180.487368
340.0114590.1050.458305
35-0.067963-0.62290.267521
36-0.000913-0.00840.496673
370.0143270.13130.447922
380.0178220.16330.435319
39-0.045784-0.41960.337918
40-0.121726-1.11560.133879
41-0.032566-0.29850.383039
42-0.114318-1.04770.148882
430.0095390.08740.465271
44-0.08925-0.8180.20784
450.149961.37440.086486
460.0354290.32470.373104
470.0606450.55580.289906
480.0393430.36060.359656

\begin{tabular}{lllllllll}
\hline
Partial Autocorrelation Function \tabularnewline
Time lag k & PACF(k) & T-STAT & P-value \tabularnewline
1 & 0.396805 & 3.6368 & 0.000238 \tabularnewline
2 & 0.029368 & 0.2692 & 0.394233 \tabularnewline
3 & 0.431593 & 3.9556 & 7.9e-05 \tabularnewline
4 & -0.106859 & -0.9794 & 0.165103 \tabularnewline
5 & 0.354936 & 3.253 & 0.000823 \tabularnewline
6 & 0.168295 & 1.5424 & 0.063362 \tabularnewline
7 & -0.076398 & -0.7002 & 0.24287 \tabularnewline
8 & -0.119736 & -1.0974 & 0.137802 \tabularnewline
9 & -0.192399 & -1.7634 & 0.040737 \tabularnewline
10 & -0.344929 & -3.1613 & 0.001092 \tabularnewline
11 & 0.069141 & 0.6337 & 0.264003 \tabularnewline
12 & 0.359095 & 3.2912 & 0.00073 \tabularnewline
13 & -0.152579 & -1.3984 & 0.082835 \tabularnewline
14 & -0.228531 & -2.0945 & 0.019613 \tabularnewline
15 & -0.138399 & -1.2684 & 0.104072 \tabularnewline
16 & 0.036334 & 0.333 & 0.369978 \tabularnewline
17 & 0.02092 & 0.1917 & 0.424205 \tabularnewline
18 & 0.02039 & 0.1869 & 0.426102 \tabularnewline
19 & 0.01779 & 0.163 & 0.435435 \tabularnewline
20 & 0.070938 & 0.6502 & 0.258682 \tabularnewline
21 & 0.018839 & 0.1727 & 0.431666 \tabularnewline
22 & -0.118737 & -1.0882 & 0.1398 \tabularnewline
23 & 0.048015 & 0.4401 & 0.33051 \tabularnewline
24 & 0.009312 & 0.0853 & 0.466093 \tabularnewline
25 & 0.035084 & 0.3215 & 0.374297 \tabularnewline
26 & -0.029588 & -0.2712 & 0.39346 \tabularnewline
27 & 0.079595 & 0.7295 & 0.233862 \tabularnewline
28 & 0.095201 & 0.8725 & 0.192702 \tabularnewline
29 & 0.092866 & 0.8511 & 0.198559 \tabularnewline
30 & 0.026118 & 0.2394 & 0.405697 \tabularnewline
31 & -0.045347 & -0.4156 & 0.339376 \tabularnewline
32 & 0.007953 & 0.0729 & 0.471034 \tabularnewline
33 & 0.003466 & 0.0318 & 0.487368 \tabularnewline
34 & 0.011459 & 0.105 & 0.458305 \tabularnewline
35 & -0.067963 & -0.6229 & 0.267521 \tabularnewline
36 & -0.000913 & -0.0084 & 0.496673 \tabularnewline
37 & 0.014327 & 0.1313 & 0.447922 \tabularnewline
38 & 0.017822 & 0.1633 & 0.435319 \tabularnewline
39 & -0.045784 & -0.4196 & 0.337918 \tabularnewline
40 & -0.121726 & -1.1156 & 0.133879 \tabularnewline
41 & -0.032566 & -0.2985 & 0.383039 \tabularnewline
42 & -0.114318 & -1.0477 & 0.148882 \tabularnewline
43 & 0.009539 & 0.0874 & 0.465271 \tabularnewline
44 & -0.08925 & -0.818 & 0.20784 \tabularnewline
45 & 0.14996 & 1.3744 & 0.086486 \tabularnewline
46 & 0.035429 & 0.3247 & 0.373104 \tabularnewline
47 & 0.060645 & 0.5558 & 0.289906 \tabularnewline
48 & 0.039343 & 0.3606 & 0.359656 \tabularnewline
\hline
\end{tabular}
%Source: https://freestatistics.org/blog/index.php?pk=224649&T=2

[TABLE]
[ROW][C]Partial Autocorrelation Function[/C][/ROW]
[ROW][C]Time lag k[/C][C]PACF(k)[/C][C]T-STAT[/C][C]P-value[/C][/ROW]
[ROW][C]1[/C][C]0.396805[/C][C]3.6368[/C][C]0.000238[/C][/ROW]
[ROW][C]2[/C][C]0.029368[/C][C]0.2692[/C][C]0.394233[/C][/ROW]
[ROW][C]3[/C][C]0.431593[/C][C]3.9556[/C][C]7.9e-05[/C][/ROW]
[ROW][C]4[/C][C]-0.106859[/C][C]-0.9794[/C][C]0.165103[/C][/ROW]
[ROW][C]5[/C][C]0.354936[/C][C]3.253[/C][C]0.000823[/C][/ROW]
[ROW][C]6[/C][C]0.168295[/C][C]1.5424[/C][C]0.063362[/C][/ROW]
[ROW][C]7[/C][C]-0.076398[/C][C]-0.7002[/C][C]0.24287[/C][/ROW]
[ROW][C]8[/C][C]-0.119736[/C][C]-1.0974[/C][C]0.137802[/C][/ROW]
[ROW][C]9[/C][C]-0.192399[/C][C]-1.7634[/C][C]0.040737[/C][/ROW]
[ROW][C]10[/C][C]-0.344929[/C][C]-3.1613[/C][C]0.001092[/C][/ROW]
[ROW][C]11[/C][C]0.069141[/C][C]0.6337[/C][C]0.264003[/C][/ROW]
[ROW][C]12[/C][C]0.359095[/C][C]3.2912[/C][C]0.00073[/C][/ROW]
[ROW][C]13[/C][C]-0.152579[/C][C]-1.3984[/C][C]0.082835[/C][/ROW]
[ROW][C]14[/C][C]-0.228531[/C][C]-2.0945[/C][C]0.019613[/C][/ROW]
[ROW][C]15[/C][C]-0.138399[/C][C]-1.2684[/C][C]0.104072[/C][/ROW]
[ROW][C]16[/C][C]0.036334[/C][C]0.333[/C][C]0.369978[/C][/ROW]
[ROW][C]17[/C][C]0.02092[/C][C]0.1917[/C][C]0.424205[/C][/ROW]
[ROW][C]18[/C][C]0.02039[/C][C]0.1869[/C][C]0.426102[/C][/ROW]
[ROW][C]19[/C][C]0.01779[/C][C]0.163[/C][C]0.435435[/C][/ROW]
[ROW][C]20[/C][C]0.070938[/C][C]0.6502[/C][C]0.258682[/C][/ROW]
[ROW][C]21[/C][C]0.018839[/C][C]0.1727[/C][C]0.431666[/C][/ROW]
[ROW][C]22[/C][C]-0.118737[/C][C]-1.0882[/C][C]0.1398[/C][/ROW]
[ROW][C]23[/C][C]0.048015[/C][C]0.4401[/C][C]0.33051[/C][/ROW]
[ROW][C]24[/C][C]0.009312[/C][C]0.0853[/C][C]0.466093[/C][/ROW]
[ROW][C]25[/C][C]0.035084[/C][C]0.3215[/C][C]0.374297[/C][/ROW]
[ROW][C]26[/C][C]-0.029588[/C][C]-0.2712[/C][C]0.39346[/C][/ROW]
[ROW][C]27[/C][C]0.079595[/C][C]0.7295[/C][C]0.233862[/C][/ROW]
[ROW][C]28[/C][C]0.095201[/C][C]0.8725[/C][C]0.192702[/C][/ROW]
[ROW][C]29[/C][C]0.092866[/C][C]0.8511[/C][C]0.198559[/C][/ROW]
[ROW][C]30[/C][C]0.026118[/C][C]0.2394[/C][C]0.405697[/C][/ROW]
[ROW][C]31[/C][C]-0.045347[/C][C]-0.4156[/C][C]0.339376[/C][/ROW]
[ROW][C]32[/C][C]0.007953[/C][C]0.0729[/C][C]0.471034[/C][/ROW]
[ROW][C]33[/C][C]0.003466[/C][C]0.0318[/C][C]0.487368[/C][/ROW]
[ROW][C]34[/C][C]0.011459[/C][C]0.105[/C][C]0.458305[/C][/ROW]
[ROW][C]35[/C][C]-0.067963[/C][C]-0.6229[/C][C]0.267521[/C][/ROW]
[ROW][C]36[/C][C]-0.000913[/C][C]-0.0084[/C][C]0.496673[/C][/ROW]
[ROW][C]37[/C][C]0.014327[/C][C]0.1313[/C][C]0.447922[/C][/ROW]
[ROW][C]38[/C][C]0.017822[/C][C]0.1633[/C][C]0.435319[/C][/ROW]
[ROW][C]39[/C][C]-0.045784[/C][C]-0.4196[/C][C]0.337918[/C][/ROW]
[ROW][C]40[/C][C]-0.121726[/C][C]-1.1156[/C][C]0.133879[/C][/ROW]
[ROW][C]41[/C][C]-0.032566[/C][C]-0.2985[/C][C]0.383039[/C][/ROW]
[ROW][C]42[/C][C]-0.114318[/C][C]-1.0477[/C][C]0.148882[/C][/ROW]
[ROW][C]43[/C][C]0.009539[/C][C]0.0874[/C][C]0.465271[/C][/ROW]
[ROW][C]44[/C][C]-0.08925[/C][C]-0.818[/C][C]0.20784[/C][/ROW]
[ROW][C]45[/C][C]0.14996[/C][C]1.3744[/C][C]0.086486[/C][/ROW]
[ROW][C]46[/C][C]0.035429[/C][C]0.3247[/C][C]0.373104[/C][/ROW]
[ROW][C]47[/C][C]0.060645[/C][C]0.5558[/C][C]0.289906[/C][/ROW]
[ROW][C]48[/C][C]0.039343[/C][C]0.3606[/C][C]0.359656[/C][/ROW]
[/TABLE]
Source: https://freestatistics.org/blog/index.php?pk=224649&T=2

Globally Unique Identifier (entire table): ba.freestatistics.org/blog/index.php?pk=224649&T=2

As an alternative you can also use a QR Code:  

The GUIDs for individual cells are displayed in the table below:

Partial Autocorrelation Function
Time lag kPACF(k)T-STATP-value
10.3968053.63680.000238
20.0293680.26920.394233
30.4315933.95567.9e-05
4-0.106859-0.97940.165103
50.3549363.2530.000823
60.1682951.54240.063362
7-0.076398-0.70020.24287
8-0.119736-1.09740.137802
9-0.192399-1.76340.040737
10-0.344929-3.16130.001092
110.0691410.63370.264003
120.3590953.29120.00073
13-0.152579-1.39840.082835
14-0.228531-2.09450.019613
15-0.138399-1.26840.104072
160.0363340.3330.369978
170.020920.19170.424205
180.020390.18690.426102
190.017790.1630.435435
200.0709380.65020.258682
210.0188390.17270.431666
22-0.118737-1.08820.1398
230.0480150.44010.33051
240.0093120.08530.466093
250.0350840.32150.374297
26-0.029588-0.27120.39346
270.0795950.72950.233862
280.0952010.87250.192702
290.0928660.85110.198559
300.0261180.23940.405697
31-0.045347-0.41560.339376
320.0079530.07290.471034
330.0034660.03180.487368
340.0114590.1050.458305
35-0.067963-0.62290.267521
36-0.000913-0.00840.496673
370.0143270.13130.447922
380.0178220.16330.435319
39-0.045784-0.41960.337918
40-0.121726-1.11560.133879
41-0.032566-0.29850.383039
42-0.114318-1.04770.148882
430.0095390.08740.465271
44-0.08925-0.8180.20784
450.149961.37440.086486
460.0354290.32470.373104
470.0606450.55580.289906
480.0393430.36060.359656


Parameters (Session):
par1 = 48 ; par2 = 1 ; par3 = 0 ; par4 = 0 ; par5 = 12 ; par6 = White Noise ; par7 = 0.95 ;
Parameters (R input):
par1 = 48 ; par2 = 1 ; par3 = 0 ; par4 = 0 ; par5 = 12 ; par6 = White Noise ; par7 = 0.95 ; par8 = ;
R code (references can be found in the software module):
if (par1 == 'Default') {
par1 = 10*log10(length(x))
} else {
par1 <- as.numeric(par1)
}
par2 <- as.numeric(par2)
par3 <- as.numeric(par3)
par4 <- as.numeric(par4)
par5 <- as.numeric(par5)
if (par6 == 'White Noise') par6 <- 'white' else par6 <- 'ma'
par7 <- as.numeric(par7)
if (par8 != '') par8 <- as.numeric(par8)
ox <- x
if (par8 == '') {
if (par2 == 0) {
x <- log(x)
} else {
x <- (x ^ par2 - 1) / par2
}
} else {
x <- log(x,base=par8)
}
if (par3 > 0) x <- diff(x,lag=1,difference=par3)
if (par4 > 0) x <- diff(x,lag=par5,difference=par4)
bitmap(file='picts.png')
op <- par(mfrow=c(2,1))
plot(ox,type='l',main='Original Time Series',xlab='time',ylab='value')
if (par8=='') {
mytitle <- paste('Working Time Series (lambda=',par2,', d=',par3,', D=',par4,')',sep='')
mysub <- paste('(lambda=',par2,', d=',par3,', D=',par4,', CI=', par7, ', CI type=',par6,')',sep='')
} else {
mytitle <- paste('Working Time Series (base=',par8,', d=',par3,', D=',par4,')',sep='')
mysub <- paste('(base=',par8,', d=',par3,', D=',par4,', CI=', par7, ', CI type=',par6,')',sep='')
}
plot(x,type='l', main=mytitle,xlab='time',ylab='value')
par(op)
dev.off()
bitmap(file='pic1.png')
racf <- acf(x, par1, main='Autocorrelation', xlab='time lag', ylab='ACF', ci.type=par6, ci=par7, sub=mysub)
dev.off()
bitmap(file='pic2.png')
rpacf <- pacf(x,par1,main='Partial Autocorrelation',xlab='lags',ylab='PACF',sub=mysub)
dev.off()
(myacf <- c(racf$acf))
(mypacf <- c(rpacf$acf))
lengthx <- length(x)
sqrtn <- sqrt(lengthx)
load(file='createtable')
a<-table.start()
a<-table.row.start(a)
a<-table.element(a,'Autocorrelation Function',4,TRUE)
a<-table.row.end(a)
a<-table.row.start(a)
a<-table.element(a,'Time lag k',header=TRUE)
a<-table.element(a,hyperlink('basics.htm','ACF(k)','click here for more information about the Autocorrelation Function'),header=TRUE)
a<-table.element(a,'T-STAT',header=TRUE)
a<-table.element(a,'P-value',header=TRUE)
a<-table.row.end(a)
for (i in 2:(par1+1)) {
a<-table.row.start(a)
a<-table.element(a,i-1,header=TRUE)
a<-table.element(a,round(myacf[i],6))
mytstat <- myacf[i]*sqrtn
a<-table.element(a,round(mytstat,4))
a<-table.element(a,round(1-pt(abs(mytstat),lengthx),6))
a<-table.row.end(a)
}
a<-table.end(a)
table.save(a,file='mytable.tab')
a<-table.start()
a<-table.row.start(a)
a<-table.element(a,'Partial Autocorrelation Function',4,TRUE)
a<-table.row.end(a)
a<-table.row.start(a)
a<-table.element(a,'Time lag k',header=TRUE)
a<-table.element(a,hyperlink('basics.htm','PACF(k)','click here for more information about the Partial Autocorrelation Function'),header=TRUE)
a<-table.element(a,'T-STAT',header=TRUE)
a<-table.element(a,'P-value',header=TRUE)
a<-table.row.end(a)
for (i in 1:par1) {
a<-table.row.start(a)
a<-table.element(a,i,header=TRUE)
a<-table.element(a,round(mypacf[i],6))
mytstat <- mypacf[i]*sqrtn
a<-table.element(a,round(mytstat,4))
a<-table.element(a,round(1-pt(abs(mytstat),lengthx),6))
a<-table.row.end(a)
}
a<-table.end(a)
table.save(a,file='mytable1.tab')