Free Statistics

of Irreproducible Research!

Author's title

Author*Unverified author*
R Software Modulerwasp_autocorrelation.wasp
Title produced by software(Partial) Autocorrelation Function
Date of computationWed, 13 Nov 2013 03:57:43 -0500
Cite this page as followsStatistical Computations at FreeStatistics.org, Office for Research Development and Education, URL https://freestatistics.org/blog/index.php?v=date/2013/Nov/13/t1384333107escafycd5xzu56h.htm/, Retrieved Sun, 28 Apr 2024 22:13:06 +0000
Statistical Computations at FreeStatistics.org, Office for Research Development and Education, URL https://freestatistics.org/blog/index.php?pk=224616, Retrieved Sun, 28 Apr 2024 22:13:06 +0000
QR Codes:

Original text written by user:
IsPrivate?No (this computation is public)
User-defined keywords
Estimated Impact100
Family? (F = Feedback message, R = changed R code, M = changed R Module, P = changed Parameters, D = changed Data)
-       [(Partial) Autocorrelation Function] [] [2013-11-13 08:57:43] [3050d341fa02a6066b7b273abfa2c28b] [Current]
Feedback Forum

Post a new message
Dataseries X:
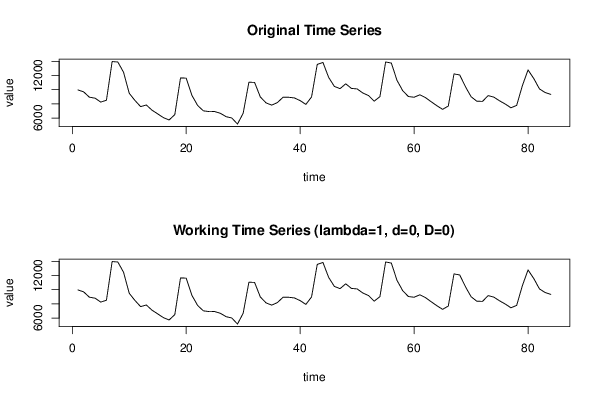
9969
9692
8943
8802
8250
8515
13973
13905
12467
9490
8483
7610
7839
7107
6584
6053
5725
6480
11663
11628
9203
7781
7020
6908
6912
6668
6189
6007
5148
6685
11044
11034
8986
8146
7818
8176
8935
8929
8835
8455
7924
8973
13575
13844
11738
10467
10145
10833
10179
10107
9533
9165
8382
9018
13911
13761
11316
9855
9034
8932
9278
8876
8298
7733
7226
7688
12226
12081
10439
9008
8377
8346
9167
8945
8428
7973
7446
7785
10561
12791
11583
10112
9597
9332


Summary of computational transaction
Raw Inputview raw input (R code)
Raw Outputview raw output of R engine
Computing time2 seconds
R Server'Gwilym Jenkins' @ jenkins.wessa.net

\begin{tabular}{lllllllll}
\hline
Summary of computational transaction \tabularnewline
Raw Input & view raw input (R code)  \tabularnewline
Raw Output & view raw output of R engine  \tabularnewline
Computing time & 2 seconds \tabularnewline
R Server & 'Gwilym Jenkins' @ jenkins.wessa.net \tabularnewline
\hline
\end{tabular}
%Source: https://freestatistics.org/blog/index.php?pk=224616&T=0

[TABLE]
[ROW][C]Summary of computational transaction[/C][/ROW]
[ROW][C]Raw Input[/C][C]view raw input (R code) [/C][/ROW]
[ROW][C]Raw Output[/C][C]view raw output of R engine [/C][/ROW]
[ROW][C]Computing time[/C][C]2 seconds[/C][/ROW]
[ROW][C]R Server[/C][C]'Gwilym Jenkins' @ jenkins.wessa.net[/C][/ROW]
[/TABLE]
Source: https://freestatistics.org/blog/index.php?pk=224616&T=0

Globally Unique Identifier (entire table): ba.freestatistics.org/blog/index.php?pk=224616&T=0

As an alternative you can also use a QR Code:  

The GUIDs for individual cells are displayed in the table below:

Summary of computational transaction
Raw Inputview raw input (R code)
Raw Outputview raw output of R engine
Computing time2 seconds
R Server'Gwilym Jenkins' @ jenkins.wessa.net


Autocorrelation Function
Time lag kACF(k)T-STATP-value
10.692416.3460
20.2333432.13860.017685
3-0.022869-0.20960.417243
4-0.061473-0.56340.287329
50.0015040.01380.494519
60.0470820.43150.333601
7-0.023092-0.21160.416449
8-0.128176-1.17480.121707
9-0.148978-1.36540.087885
100.0242840.22260.412208
110.387353.55010.000317
120.6274855.7510
130.3748523.43560.000461
14-0.024111-0.2210.412821
15-0.234279-2.14720.01733
16-0.268712-2.46280.007914
17-0.211021-1.9340.028238
18-0.176581-1.61840.054664
19-0.23189-2.12530.018249
20-0.319146-2.9250.002214
21-0.331096-3.03450.001603
22-0.185802-1.70290.046142
230.1260881.15560.125558
240.3459063.17030.001063
250.1732171.58760.058072
26-0.129299-1.1850.119671
27-0.279598-2.56260.006087
28-0.27882-2.55540.006204
29-0.205201-1.88070.031739
30-0.151563-1.38910.084238
31-0.17457-1.60.056681
32-0.217844-1.99660.024555
33-0.205794-1.88610.031366
34-0.070512-0.64630.259939
350.1935391.77380.039859
360.3878783.5550.000312
370.2631682.4120.009022
380.0243370.2230.41202
39-0.099892-0.91550.181268
40-0.112485-1.03090.152763
41-0.061908-0.56740.28598
42-0.028551-0.26170.397108
43-0.054385-0.49840.309736
44-0.100165-0.9180.180617
45-0.097297-0.89170.187539
460.0030870.02830.488747
470.1883511.72630.043988
480.3248882.97760.001898
490.2231032.04480.022004
500.0354430.32480.373055
51-0.079973-0.7330.23281
52-0.106469-0.97580.165981
53-0.079516-0.72880.234082
54-0.052263-0.4790.316594
55-0.081309-0.74520.229114
56-0.115655-1.060.146094
57-0.115781-1.06110.145832
58-0.044522-0.40810.342136
590.0791730.72560.235039
600.1792761.64310.052051

\begin{tabular}{lllllllll}
\hline
Autocorrelation Function \tabularnewline
Time lag k & ACF(k) & T-STAT & P-value \tabularnewline
1 & 0.69241 & 6.346 & 0 \tabularnewline
2 & 0.233343 & 2.1386 & 0.017685 \tabularnewline
3 & -0.022869 & -0.2096 & 0.417243 \tabularnewline
4 & -0.061473 & -0.5634 & 0.287329 \tabularnewline
5 & 0.001504 & 0.0138 & 0.494519 \tabularnewline
6 & 0.047082 & 0.4315 & 0.333601 \tabularnewline
7 & -0.023092 & -0.2116 & 0.416449 \tabularnewline
8 & -0.128176 & -1.1748 & 0.121707 \tabularnewline
9 & -0.148978 & -1.3654 & 0.087885 \tabularnewline
10 & 0.024284 & 0.2226 & 0.412208 \tabularnewline
11 & 0.38735 & 3.5501 & 0.000317 \tabularnewline
12 & 0.627485 & 5.751 & 0 \tabularnewline
13 & 0.374852 & 3.4356 & 0.000461 \tabularnewline
14 & -0.024111 & -0.221 & 0.412821 \tabularnewline
15 & -0.234279 & -2.1472 & 0.01733 \tabularnewline
16 & -0.268712 & -2.4628 & 0.007914 \tabularnewline
17 & -0.211021 & -1.934 & 0.028238 \tabularnewline
18 & -0.176581 & -1.6184 & 0.054664 \tabularnewline
19 & -0.23189 & -2.1253 & 0.018249 \tabularnewline
20 & -0.319146 & -2.925 & 0.002214 \tabularnewline
21 & -0.331096 & -3.0345 & 0.001603 \tabularnewline
22 & -0.185802 & -1.7029 & 0.046142 \tabularnewline
23 & 0.126088 & 1.1556 & 0.125558 \tabularnewline
24 & 0.345906 & 3.1703 & 0.001063 \tabularnewline
25 & 0.173217 & 1.5876 & 0.058072 \tabularnewline
26 & -0.129299 & -1.185 & 0.119671 \tabularnewline
27 & -0.279598 & -2.5626 & 0.006087 \tabularnewline
28 & -0.27882 & -2.5554 & 0.006204 \tabularnewline
29 & -0.205201 & -1.8807 & 0.031739 \tabularnewline
30 & -0.151563 & -1.3891 & 0.084238 \tabularnewline
31 & -0.17457 & -1.6 & 0.056681 \tabularnewline
32 & -0.217844 & -1.9966 & 0.024555 \tabularnewline
33 & -0.205794 & -1.8861 & 0.031366 \tabularnewline
34 & -0.070512 & -0.6463 & 0.259939 \tabularnewline
35 & 0.193539 & 1.7738 & 0.039859 \tabularnewline
36 & 0.387878 & 3.555 & 0.000312 \tabularnewline
37 & 0.263168 & 2.412 & 0.009022 \tabularnewline
38 & 0.024337 & 0.223 & 0.41202 \tabularnewline
39 & -0.099892 & -0.9155 & 0.181268 \tabularnewline
40 & -0.112485 & -1.0309 & 0.152763 \tabularnewline
41 & -0.061908 & -0.5674 & 0.28598 \tabularnewline
42 & -0.028551 & -0.2617 & 0.397108 \tabularnewline
43 & -0.054385 & -0.4984 & 0.309736 \tabularnewline
44 & -0.100165 & -0.918 & 0.180617 \tabularnewline
45 & -0.097297 & -0.8917 & 0.187539 \tabularnewline
46 & 0.003087 & 0.0283 & 0.488747 \tabularnewline
47 & 0.188351 & 1.7263 & 0.043988 \tabularnewline
48 & 0.324888 & 2.9776 & 0.001898 \tabularnewline
49 & 0.223103 & 2.0448 & 0.022004 \tabularnewline
50 & 0.035443 & 0.3248 & 0.373055 \tabularnewline
51 & -0.079973 & -0.733 & 0.23281 \tabularnewline
52 & -0.106469 & -0.9758 & 0.165981 \tabularnewline
53 & -0.079516 & -0.7288 & 0.234082 \tabularnewline
54 & -0.052263 & -0.479 & 0.316594 \tabularnewline
55 & -0.081309 & -0.7452 & 0.229114 \tabularnewline
56 & -0.115655 & -1.06 & 0.146094 \tabularnewline
57 & -0.115781 & -1.0611 & 0.145832 \tabularnewline
58 & -0.044522 & -0.4081 & 0.342136 \tabularnewline
59 & 0.079173 & 0.7256 & 0.235039 \tabularnewline
60 & 0.179276 & 1.6431 & 0.052051 \tabularnewline
\hline
\end{tabular}
%Source: https://freestatistics.org/blog/index.php?pk=224616&T=1

[TABLE]
[ROW][C]Autocorrelation Function[/C][/ROW]
[ROW][C]Time lag k[/C][C]ACF(k)[/C][C]T-STAT[/C][C]P-value[/C][/ROW]
[ROW][C]1[/C][C]0.69241[/C][C]6.346[/C][C]0[/C][/ROW]
[ROW][C]2[/C][C]0.233343[/C][C]2.1386[/C][C]0.017685[/C][/ROW]
[ROW][C]3[/C][C]-0.022869[/C][C]-0.2096[/C][C]0.417243[/C][/ROW]
[ROW][C]4[/C][C]-0.061473[/C][C]-0.5634[/C][C]0.287329[/C][/ROW]
[ROW][C]5[/C][C]0.001504[/C][C]0.0138[/C][C]0.494519[/C][/ROW]
[ROW][C]6[/C][C]0.047082[/C][C]0.4315[/C][C]0.333601[/C][/ROW]
[ROW][C]7[/C][C]-0.023092[/C][C]-0.2116[/C][C]0.416449[/C][/ROW]
[ROW][C]8[/C][C]-0.128176[/C][C]-1.1748[/C][C]0.121707[/C][/ROW]
[ROW][C]9[/C][C]-0.148978[/C][C]-1.3654[/C][C]0.087885[/C][/ROW]
[ROW][C]10[/C][C]0.024284[/C][C]0.2226[/C][C]0.412208[/C][/ROW]
[ROW][C]11[/C][C]0.38735[/C][C]3.5501[/C][C]0.000317[/C][/ROW]
[ROW][C]12[/C][C]0.627485[/C][C]5.751[/C][C]0[/C][/ROW]
[ROW][C]13[/C][C]0.374852[/C][C]3.4356[/C][C]0.000461[/C][/ROW]
[ROW][C]14[/C][C]-0.024111[/C][C]-0.221[/C][C]0.412821[/C][/ROW]
[ROW][C]15[/C][C]-0.234279[/C][C]-2.1472[/C][C]0.01733[/C][/ROW]
[ROW][C]16[/C][C]-0.268712[/C][C]-2.4628[/C][C]0.007914[/C][/ROW]
[ROW][C]17[/C][C]-0.211021[/C][C]-1.934[/C][C]0.028238[/C][/ROW]
[ROW][C]18[/C][C]-0.176581[/C][C]-1.6184[/C][C]0.054664[/C][/ROW]
[ROW][C]19[/C][C]-0.23189[/C][C]-2.1253[/C][C]0.018249[/C][/ROW]
[ROW][C]20[/C][C]-0.319146[/C][C]-2.925[/C][C]0.002214[/C][/ROW]
[ROW][C]21[/C][C]-0.331096[/C][C]-3.0345[/C][C]0.001603[/C][/ROW]
[ROW][C]22[/C][C]-0.185802[/C][C]-1.7029[/C][C]0.046142[/C][/ROW]
[ROW][C]23[/C][C]0.126088[/C][C]1.1556[/C][C]0.125558[/C][/ROW]
[ROW][C]24[/C][C]0.345906[/C][C]3.1703[/C][C]0.001063[/C][/ROW]
[ROW][C]25[/C][C]0.173217[/C][C]1.5876[/C][C]0.058072[/C][/ROW]
[ROW][C]26[/C][C]-0.129299[/C][C]-1.185[/C][C]0.119671[/C][/ROW]
[ROW][C]27[/C][C]-0.279598[/C][C]-2.5626[/C][C]0.006087[/C][/ROW]
[ROW][C]28[/C][C]-0.27882[/C][C]-2.5554[/C][C]0.006204[/C][/ROW]
[ROW][C]29[/C][C]-0.205201[/C][C]-1.8807[/C][C]0.031739[/C][/ROW]
[ROW][C]30[/C][C]-0.151563[/C][C]-1.3891[/C][C]0.084238[/C][/ROW]
[ROW][C]31[/C][C]-0.17457[/C][C]-1.6[/C][C]0.056681[/C][/ROW]
[ROW][C]32[/C][C]-0.217844[/C][C]-1.9966[/C][C]0.024555[/C][/ROW]
[ROW][C]33[/C][C]-0.205794[/C][C]-1.8861[/C][C]0.031366[/C][/ROW]
[ROW][C]34[/C][C]-0.070512[/C][C]-0.6463[/C][C]0.259939[/C][/ROW]
[ROW][C]35[/C][C]0.193539[/C][C]1.7738[/C][C]0.039859[/C][/ROW]
[ROW][C]36[/C][C]0.387878[/C][C]3.555[/C][C]0.000312[/C][/ROW]
[ROW][C]37[/C][C]0.263168[/C][C]2.412[/C][C]0.009022[/C][/ROW]
[ROW][C]38[/C][C]0.024337[/C][C]0.223[/C][C]0.41202[/C][/ROW]
[ROW][C]39[/C][C]-0.099892[/C][C]-0.9155[/C][C]0.181268[/C][/ROW]
[ROW][C]40[/C][C]-0.112485[/C][C]-1.0309[/C][C]0.152763[/C][/ROW]
[ROW][C]41[/C][C]-0.061908[/C][C]-0.5674[/C][C]0.28598[/C][/ROW]
[ROW][C]42[/C][C]-0.028551[/C][C]-0.2617[/C][C]0.397108[/C][/ROW]
[ROW][C]43[/C][C]-0.054385[/C][C]-0.4984[/C][C]0.309736[/C][/ROW]
[ROW][C]44[/C][C]-0.100165[/C][C]-0.918[/C][C]0.180617[/C][/ROW]
[ROW][C]45[/C][C]-0.097297[/C][C]-0.8917[/C][C]0.187539[/C][/ROW]
[ROW][C]46[/C][C]0.003087[/C][C]0.0283[/C][C]0.488747[/C][/ROW]
[ROW][C]47[/C][C]0.188351[/C][C]1.7263[/C][C]0.043988[/C][/ROW]
[ROW][C]48[/C][C]0.324888[/C][C]2.9776[/C][C]0.001898[/C][/ROW]
[ROW][C]49[/C][C]0.223103[/C][C]2.0448[/C][C]0.022004[/C][/ROW]
[ROW][C]50[/C][C]0.035443[/C][C]0.3248[/C][C]0.373055[/C][/ROW]
[ROW][C]51[/C][C]-0.079973[/C][C]-0.733[/C][C]0.23281[/C][/ROW]
[ROW][C]52[/C][C]-0.106469[/C][C]-0.9758[/C][C]0.165981[/C][/ROW]
[ROW][C]53[/C][C]-0.079516[/C][C]-0.7288[/C][C]0.234082[/C][/ROW]
[ROW][C]54[/C][C]-0.052263[/C][C]-0.479[/C][C]0.316594[/C][/ROW]
[ROW][C]55[/C][C]-0.081309[/C][C]-0.7452[/C][C]0.229114[/C][/ROW]
[ROW][C]56[/C][C]-0.115655[/C][C]-1.06[/C][C]0.146094[/C][/ROW]
[ROW][C]57[/C][C]-0.115781[/C][C]-1.0611[/C][C]0.145832[/C][/ROW]
[ROW][C]58[/C][C]-0.044522[/C][C]-0.4081[/C][C]0.342136[/C][/ROW]
[ROW][C]59[/C][C]0.079173[/C][C]0.7256[/C][C]0.235039[/C][/ROW]
[ROW][C]60[/C][C]0.179276[/C][C]1.6431[/C][C]0.052051[/C][/ROW]
[/TABLE]
Source: https://freestatistics.org/blog/index.php?pk=224616&T=1

Globally Unique Identifier (entire table): ba.freestatistics.org/blog/index.php?pk=224616&T=1

As an alternative you can also use a QR Code:  

The GUIDs for individual cells are displayed in the table below:

Autocorrelation Function
Time lag kACF(k)T-STATP-value
10.692416.3460
20.2333432.13860.017685
3-0.022869-0.20960.417243
4-0.061473-0.56340.287329
50.0015040.01380.494519
60.0470820.43150.333601
7-0.023092-0.21160.416449
8-0.128176-1.17480.121707
9-0.148978-1.36540.087885
100.0242840.22260.412208
110.387353.55010.000317
120.6274855.7510
130.3748523.43560.000461
14-0.024111-0.2210.412821
15-0.234279-2.14720.01733
16-0.268712-2.46280.007914
17-0.211021-1.9340.028238
18-0.176581-1.61840.054664
19-0.23189-2.12530.018249
20-0.319146-2.9250.002214
21-0.331096-3.03450.001603
22-0.185802-1.70290.046142
230.1260881.15560.125558
240.3459063.17030.001063
250.1732171.58760.058072
26-0.129299-1.1850.119671
27-0.279598-2.56260.006087
28-0.27882-2.55540.006204
29-0.205201-1.88070.031739
30-0.151563-1.38910.084238
31-0.17457-1.60.056681
32-0.217844-1.99660.024555
33-0.205794-1.88610.031366
34-0.070512-0.64630.259939
350.1935391.77380.039859
360.3878783.5550.000312
370.2631682.4120.009022
380.0243370.2230.41202
39-0.099892-0.91550.181268
40-0.112485-1.03090.152763
41-0.061908-0.56740.28598
42-0.028551-0.26170.397108
43-0.054385-0.49840.309736
44-0.100165-0.9180.180617
45-0.097297-0.89170.187539
460.0030870.02830.488747
470.1883511.72630.043988
480.3248882.97760.001898
490.2231032.04480.022004
500.0354430.32480.373055
51-0.079973-0.7330.23281
52-0.106469-0.97580.165981
53-0.079516-0.72880.234082
54-0.052263-0.4790.316594
55-0.081309-0.74520.229114
56-0.115655-1.060.146094
57-0.115781-1.06110.145832
58-0.044522-0.40810.342136
590.0791730.72560.235039
600.1792761.64310.052051


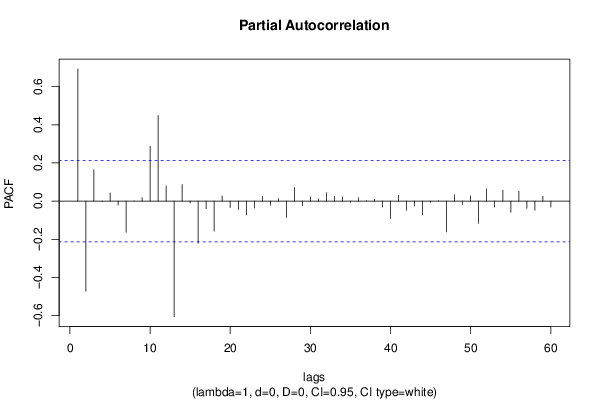
Partial Autocorrelation Function
Time lag kPACF(k)T-STATP-value
10.692416.3460
2-0.472729-4.33262e-05
30.1645211.50790.067671
4-0.002121-0.01940.492267
50.042840.39260.34779
6-0.020923-0.19180.424195
7-0.162991-1.49380.069483
80.0002540.00230.499073
90.0181390.16620.434183
100.287352.63360.005028
110.4481924.10774.6e-05
120.079610.72960.233821
13-0.605416-5.54870
140.0866340.7940.214711
15-0.010396-0.09530.462161
16-0.220243-2.01860.023362
17-0.039673-0.36360.358532
18-0.157442-1.4430.076372
190.0263890.24190.40474
20-0.033926-0.31090.378309
21-0.043303-0.39690.346231
22-0.072828-0.66750.253148
23-0.036221-0.3320.370371
240.0238670.21870.41369
25-0.021874-0.20050.420794
260.0130390.11950.452581
27-0.08639-0.79180.215361
280.0712290.65280.257825
29-0.023821-0.21830.413854
300.0213050.19530.42283
310.0109670.10050.460087
320.0438420.40180.34442
330.0243570.22320.411949
340.021530.19730.422024
35-0.006907-0.06330.474838
360.0174090.15960.436805
370.0020070.01840.492684
380.0096860.08880.464737
39-0.031275-0.28660.387545
40-0.090885-0.8330.20361
410.0305950.28040.389928
42-0.047733-0.43750.331442
43-0.025897-0.23740.406481
44-0.071319-0.65360.257563
45-0.006214-0.0570.477358
460.0012010.0110.495621
47-0.161409-1.47930.071395
480.0331410.30370.381038
49-0.018038-0.16530.434545
500.02710.24840.402226
51-0.116727-1.06980.143883
520.0645470.59160.277859
53-0.031081-0.28490.388226
540.0570950.52330.301076
55-0.058201-0.53340.297574
560.0510050.46750.320687
57-0.037815-0.34660.364886
58-0.047853-0.43860.331046
590.0258960.23730.406484
60-0.031422-0.2880.387031

\begin{tabular}{lllllllll}
\hline
Partial Autocorrelation Function \tabularnewline
Time lag k & PACF(k) & T-STAT & P-value \tabularnewline
1 & 0.69241 & 6.346 & 0 \tabularnewline
2 & -0.472729 & -4.3326 & 2e-05 \tabularnewline
3 & 0.164521 & 1.5079 & 0.067671 \tabularnewline
4 & -0.002121 & -0.0194 & 0.492267 \tabularnewline
5 & 0.04284 & 0.3926 & 0.34779 \tabularnewline
6 & -0.020923 & -0.1918 & 0.424195 \tabularnewline
7 & -0.162991 & -1.4938 & 0.069483 \tabularnewline
8 & 0.000254 & 0.0023 & 0.499073 \tabularnewline
9 & 0.018139 & 0.1662 & 0.434183 \tabularnewline
10 & 0.28735 & 2.6336 & 0.005028 \tabularnewline
11 & 0.448192 & 4.1077 & 4.6e-05 \tabularnewline
12 & 0.07961 & 0.7296 & 0.233821 \tabularnewline
13 & -0.605416 & -5.5487 & 0 \tabularnewline
14 & 0.086634 & 0.794 & 0.214711 \tabularnewline
15 & -0.010396 & -0.0953 & 0.462161 \tabularnewline
16 & -0.220243 & -2.0186 & 0.023362 \tabularnewline
17 & -0.039673 & -0.3636 & 0.358532 \tabularnewline
18 & -0.157442 & -1.443 & 0.076372 \tabularnewline
19 & 0.026389 & 0.2419 & 0.40474 \tabularnewline
20 & -0.033926 & -0.3109 & 0.378309 \tabularnewline
21 & -0.043303 & -0.3969 & 0.346231 \tabularnewline
22 & -0.072828 & -0.6675 & 0.253148 \tabularnewline
23 & -0.036221 & -0.332 & 0.370371 \tabularnewline
24 & 0.023867 & 0.2187 & 0.41369 \tabularnewline
25 & -0.021874 & -0.2005 & 0.420794 \tabularnewline
26 & 0.013039 & 0.1195 & 0.452581 \tabularnewline
27 & -0.08639 & -0.7918 & 0.215361 \tabularnewline
28 & 0.071229 & 0.6528 & 0.257825 \tabularnewline
29 & -0.023821 & -0.2183 & 0.413854 \tabularnewline
30 & 0.021305 & 0.1953 & 0.42283 \tabularnewline
31 & 0.010967 & 0.1005 & 0.460087 \tabularnewline
32 & 0.043842 & 0.4018 & 0.34442 \tabularnewline
33 & 0.024357 & 0.2232 & 0.411949 \tabularnewline
34 & 0.02153 & 0.1973 & 0.422024 \tabularnewline
35 & -0.006907 & -0.0633 & 0.474838 \tabularnewline
36 & 0.017409 & 0.1596 & 0.436805 \tabularnewline
37 & 0.002007 & 0.0184 & 0.492684 \tabularnewline
38 & 0.009686 & 0.0888 & 0.464737 \tabularnewline
39 & -0.031275 & -0.2866 & 0.387545 \tabularnewline
40 & -0.090885 & -0.833 & 0.20361 \tabularnewline
41 & 0.030595 & 0.2804 & 0.389928 \tabularnewline
42 & -0.047733 & -0.4375 & 0.331442 \tabularnewline
43 & -0.025897 & -0.2374 & 0.406481 \tabularnewline
44 & -0.071319 & -0.6536 & 0.257563 \tabularnewline
45 & -0.006214 & -0.057 & 0.477358 \tabularnewline
46 & 0.001201 & 0.011 & 0.495621 \tabularnewline
47 & -0.161409 & -1.4793 & 0.071395 \tabularnewline
48 & 0.033141 & 0.3037 & 0.381038 \tabularnewline
49 & -0.018038 & -0.1653 & 0.434545 \tabularnewline
50 & 0.0271 & 0.2484 & 0.402226 \tabularnewline
51 & -0.116727 & -1.0698 & 0.143883 \tabularnewline
52 & 0.064547 & 0.5916 & 0.277859 \tabularnewline
53 & -0.031081 & -0.2849 & 0.388226 \tabularnewline
54 & 0.057095 & 0.5233 & 0.301076 \tabularnewline
55 & -0.058201 & -0.5334 & 0.297574 \tabularnewline
56 & 0.051005 & 0.4675 & 0.320687 \tabularnewline
57 & -0.037815 & -0.3466 & 0.364886 \tabularnewline
58 & -0.047853 & -0.4386 & 0.331046 \tabularnewline
59 & 0.025896 & 0.2373 & 0.406484 \tabularnewline
60 & -0.031422 & -0.288 & 0.387031 \tabularnewline
\hline
\end{tabular}
%Source: https://freestatistics.org/blog/index.php?pk=224616&T=2

[TABLE]
[ROW][C]Partial Autocorrelation Function[/C][/ROW]
[ROW][C]Time lag k[/C][C]PACF(k)[/C][C]T-STAT[/C][C]P-value[/C][/ROW]
[ROW][C]1[/C][C]0.69241[/C][C]6.346[/C][C]0[/C][/ROW]
[ROW][C]2[/C][C]-0.472729[/C][C]-4.3326[/C][C]2e-05[/C][/ROW]
[ROW][C]3[/C][C]0.164521[/C][C]1.5079[/C][C]0.067671[/C][/ROW]
[ROW][C]4[/C][C]-0.002121[/C][C]-0.0194[/C][C]0.492267[/C][/ROW]
[ROW][C]5[/C][C]0.04284[/C][C]0.3926[/C][C]0.34779[/C][/ROW]
[ROW][C]6[/C][C]-0.020923[/C][C]-0.1918[/C][C]0.424195[/C][/ROW]
[ROW][C]7[/C][C]-0.162991[/C][C]-1.4938[/C][C]0.069483[/C][/ROW]
[ROW][C]8[/C][C]0.000254[/C][C]0.0023[/C][C]0.499073[/C][/ROW]
[ROW][C]9[/C][C]0.018139[/C][C]0.1662[/C][C]0.434183[/C][/ROW]
[ROW][C]10[/C][C]0.28735[/C][C]2.6336[/C][C]0.005028[/C][/ROW]
[ROW][C]11[/C][C]0.448192[/C][C]4.1077[/C][C]4.6e-05[/C][/ROW]
[ROW][C]12[/C][C]0.07961[/C][C]0.7296[/C][C]0.233821[/C][/ROW]
[ROW][C]13[/C][C]-0.605416[/C][C]-5.5487[/C][C]0[/C][/ROW]
[ROW][C]14[/C][C]0.086634[/C][C]0.794[/C][C]0.214711[/C][/ROW]
[ROW][C]15[/C][C]-0.010396[/C][C]-0.0953[/C][C]0.462161[/C][/ROW]
[ROW][C]16[/C][C]-0.220243[/C][C]-2.0186[/C][C]0.023362[/C][/ROW]
[ROW][C]17[/C][C]-0.039673[/C][C]-0.3636[/C][C]0.358532[/C][/ROW]
[ROW][C]18[/C][C]-0.157442[/C][C]-1.443[/C][C]0.076372[/C][/ROW]
[ROW][C]19[/C][C]0.026389[/C][C]0.2419[/C][C]0.40474[/C][/ROW]
[ROW][C]20[/C][C]-0.033926[/C][C]-0.3109[/C][C]0.378309[/C][/ROW]
[ROW][C]21[/C][C]-0.043303[/C][C]-0.3969[/C][C]0.346231[/C][/ROW]
[ROW][C]22[/C][C]-0.072828[/C][C]-0.6675[/C][C]0.253148[/C][/ROW]
[ROW][C]23[/C][C]-0.036221[/C][C]-0.332[/C][C]0.370371[/C][/ROW]
[ROW][C]24[/C][C]0.023867[/C][C]0.2187[/C][C]0.41369[/C][/ROW]
[ROW][C]25[/C][C]-0.021874[/C][C]-0.2005[/C][C]0.420794[/C][/ROW]
[ROW][C]26[/C][C]0.013039[/C][C]0.1195[/C][C]0.452581[/C][/ROW]
[ROW][C]27[/C][C]-0.08639[/C][C]-0.7918[/C][C]0.215361[/C][/ROW]
[ROW][C]28[/C][C]0.071229[/C][C]0.6528[/C][C]0.257825[/C][/ROW]
[ROW][C]29[/C][C]-0.023821[/C][C]-0.2183[/C][C]0.413854[/C][/ROW]
[ROW][C]30[/C][C]0.021305[/C][C]0.1953[/C][C]0.42283[/C][/ROW]
[ROW][C]31[/C][C]0.010967[/C][C]0.1005[/C][C]0.460087[/C][/ROW]
[ROW][C]32[/C][C]0.043842[/C][C]0.4018[/C][C]0.34442[/C][/ROW]
[ROW][C]33[/C][C]0.024357[/C][C]0.2232[/C][C]0.411949[/C][/ROW]
[ROW][C]34[/C][C]0.02153[/C][C]0.1973[/C][C]0.422024[/C][/ROW]
[ROW][C]35[/C][C]-0.006907[/C][C]-0.0633[/C][C]0.474838[/C][/ROW]
[ROW][C]36[/C][C]0.017409[/C][C]0.1596[/C][C]0.436805[/C][/ROW]
[ROW][C]37[/C][C]0.002007[/C][C]0.0184[/C][C]0.492684[/C][/ROW]
[ROW][C]38[/C][C]0.009686[/C][C]0.0888[/C][C]0.464737[/C][/ROW]
[ROW][C]39[/C][C]-0.031275[/C][C]-0.2866[/C][C]0.387545[/C][/ROW]
[ROW][C]40[/C][C]-0.090885[/C][C]-0.833[/C][C]0.20361[/C][/ROW]
[ROW][C]41[/C][C]0.030595[/C][C]0.2804[/C][C]0.389928[/C][/ROW]
[ROW][C]42[/C][C]-0.047733[/C][C]-0.4375[/C][C]0.331442[/C][/ROW]
[ROW][C]43[/C][C]-0.025897[/C][C]-0.2374[/C][C]0.406481[/C][/ROW]
[ROW][C]44[/C][C]-0.071319[/C][C]-0.6536[/C][C]0.257563[/C][/ROW]
[ROW][C]45[/C][C]-0.006214[/C][C]-0.057[/C][C]0.477358[/C][/ROW]
[ROW][C]46[/C][C]0.001201[/C][C]0.011[/C][C]0.495621[/C][/ROW]
[ROW][C]47[/C][C]-0.161409[/C][C]-1.4793[/C][C]0.071395[/C][/ROW]
[ROW][C]48[/C][C]0.033141[/C][C]0.3037[/C][C]0.381038[/C][/ROW]
[ROW][C]49[/C][C]-0.018038[/C][C]-0.1653[/C][C]0.434545[/C][/ROW]
[ROW][C]50[/C][C]0.0271[/C][C]0.2484[/C][C]0.402226[/C][/ROW]
[ROW][C]51[/C][C]-0.116727[/C][C]-1.0698[/C][C]0.143883[/C][/ROW]
[ROW][C]52[/C][C]0.064547[/C][C]0.5916[/C][C]0.277859[/C][/ROW]
[ROW][C]53[/C][C]-0.031081[/C][C]-0.2849[/C][C]0.388226[/C][/ROW]
[ROW][C]54[/C][C]0.057095[/C][C]0.5233[/C][C]0.301076[/C][/ROW]
[ROW][C]55[/C][C]-0.058201[/C][C]-0.5334[/C][C]0.297574[/C][/ROW]
[ROW][C]56[/C][C]0.051005[/C][C]0.4675[/C][C]0.320687[/C][/ROW]
[ROW][C]57[/C][C]-0.037815[/C][C]-0.3466[/C][C]0.364886[/C][/ROW]
[ROW][C]58[/C][C]-0.047853[/C][C]-0.4386[/C][C]0.331046[/C][/ROW]
[ROW][C]59[/C][C]0.025896[/C][C]0.2373[/C][C]0.406484[/C][/ROW]
[ROW][C]60[/C][C]-0.031422[/C][C]-0.288[/C][C]0.387031[/C][/ROW]
[/TABLE]
Source: https://freestatistics.org/blog/index.php?pk=224616&T=2

Globally Unique Identifier (entire table): ba.freestatistics.org/blog/index.php?pk=224616&T=2

As an alternative you can also use a QR Code:  

The GUIDs for individual cells are displayed in the table below:

Partial Autocorrelation Function
Time lag kPACF(k)T-STATP-value
10.692416.3460
2-0.472729-4.33262e-05
30.1645211.50790.067671
4-0.002121-0.01940.492267
50.042840.39260.34779
6-0.020923-0.19180.424195
7-0.162991-1.49380.069483
80.0002540.00230.499073
90.0181390.16620.434183
100.287352.63360.005028
110.4481924.10774.6e-05
120.079610.72960.233821
13-0.605416-5.54870
140.0866340.7940.214711
15-0.010396-0.09530.462161
16-0.220243-2.01860.023362
17-0.039673-0.36360.358532
18-0.157442-1.4430.076372
190.0263890.24190.40474
20-0.033926-0.31090.378309
21-0.043303-0.39690.346231
22-0.072828-0.66750.253148
23-0.036221-0.3320.370371
240.0238670.21870.41369
25-0.021874-0.20050.420794
260.0130390.11950.452581
27-0.08639-0.79180.215361
280.0712290.65280.257825
29-0.023821-0.21830.413854
300.0213050.19530.42283
310.0109670.10050.460087
320.0438420.40180.34442
330.0243570.22320.411949
340.021530.19730.422024
35-0.006907-0.06330.474838
360.0174090.15960.436805
370.0020070.01840.492684
380.0096860.08880.464737
39-0.031275-0.28660.387545
40-0.090885-0.8330.20361
410.0305950.28040.389928
42-0.047733-0.43750.331442
43-0.025897-0.23740.406481
44-0.071319-0.65360.257563
45-0.006214-0.0570.477358
460.0012010.0110.495621
47-0.161409-1.47930.071395
480.0331410.30370.381038
49-0.018038-0.16530.434545
500.02710.24840.402226
51-0.116727-1.06980.143883
520.0645470.59160.277859
53-0.031081-0.28490.388226
540.0570950.52330.301076
55-0.058201-0.53340.297574
560.0510050.46750.320687
57-0.037815-0.34660.364886
58-0.047853-0.43860.331046
590.0258960.23730.406484
60-0.031422-0.2880.387031


Parameters (Session):
par1 = 60 ; par2 = 1 ; par3 = 0 ; par4 = 0 ; par5 = 12 ; par6 = White Noise ; par7 = 0.95 ;
Parameters (R input):
par1 = 60 ; par2 = 1 ; par3 = 0 ; par4 = 0 ; par5 = 12 ; par6 = White Noise ; par7 = 0.95 ; par8 = ;
R code (references can be found in the software module):
if (par1 == 'Default') {
par1 = 10*log10(length(x))
} else {
par1 <- as.numeric(par1)
}
par2 <- as.numeric(par2)
par3 <- as.numeric(par3)
par4 <- as.numeric(par4)
par5 <- as.numeric(par5)
if (par6 == 'White Noise') par6 <- 'white' else par6 <- 'ma'
par7 <- as.numeric(par7)
if (par8 != '') par8 <- as.numeric(par8)
ox <- x
if (par8 == '') {
if (par2 == 0) {
x <- log(x)
} else {
x <- (x ^ par2 - 1) / par2
}
} else {
x <- log(x,base=par8)
}
if (par3 > 0) x <- diff(x,lag=1,difference=par3)
if (par4 > 0) x <- diff(x,lag=par5,difference=par4)
bitmap(file='picts.png')
op <- par(mfrow=c(2,1))
plot(ox,type='l',main='Original Time Series',xlab='time',ylab='value')
if (par8=='') {
mytitle <- paste('Working Time Series (lambda=',par2,', d=',par3,', D=',par4,')',sep='')
mysub <- paste('(lambda=',par2,', d=',par3,', D=',par4,', CI=', par7, ', CI type=',par6,')',sep='')
} else {
mytitle <- paste('Working Time Series (base=',par8,', d=',par3,', D=',par4,')',sep='')
mysub <- paste('(base=',par8,', d=',par3,', D=',par4,', CI=', par7, ', CI type=',par6,')',sep='')
}
plot(x,type='l', main=mytitle,xlab='time',ylab='value')
par(op)
dev.off()
bitmap(file='pic1.png')
racf <- acf(x, par1, main='Autocorrelation', xlab='time lag', ylab='ACF', ci.type=par6, ci=par7, sub=mysub)
dev.off()
bitmap(file='pic2.png')
rpacf <- pacf(x,par1,main='Partial Autocorrelation',xlab='lags',ylab='PACF',sub=mysub)
dev.off()
(myacf <- c(racf$acf))
(mypacf <- c(rpacf$acf))
lengthx <- length(x)
sqrtn <- sqrt(lengthx)
load(file='createtable')
a<-table.start()
a<-table.row.start(a)
a<-table.element(a,'Autocorrelation Function',4,TRUE)
a<-table.row.end(a)
a<-table.row.start(a)
a<-table.element(a,'Time lag k',header=TRUE)
a<-table.element(a,hyperlink('basics.htm','ACF(k)','click here for more information about the Autocorrelation Function'),header=TRUE)
a<-table.element(a,'T-STAT',header=TRUE)
a<-table.element(a,'P-value',header=TRUE)
a<-table.row.end(a)
for (i in 2:(par1+1)) {
a<-table.row.start(a)
a<-table.element(a,i-1,header=TRUE)
a<-table.element(a,round(myacf[i],6))
mytstat <- myacf[i]*sqrtn
a<-table.element(a,round(mytstat,4))
a<-table.element(a,round(1-pt(abs(mytstat),lengthx),6))
a<-table.row.end(a)
}
a<-table.end(a)
table.save(a,file='mytable.tab')
a<-table.start()
a<-table.row.start(a)
a<-table.element(a,'Partial Autocorrelation Function',4,TRUE)
a<-table.row.end(a)
a<-table.row.start(a)
a<-table.element(a,'Time lag k',header=TRUE)
a<-table.element(a,hyperlink('basics.htm','PACF(k)','click here for more information about the Partial Autocorrelation Function'),header=TRUE)
a<-table.element(a,'T-STAT',header=TRUE)
a<-table.element(a,'P-value',header=TRUE)
a<-table.row.end(a)
for (i in 1:par1) {
a<-table.row.start(a)
a<-table.element(a,i,header=TRUE)
a<-table.element(a,round(mypacf[i],6))
mytstat <- mypacf[i]*sqrtn
a<-table.element(a,round(mytstat,4))
a<-table.element(a,round(1-pt(abs(mytstat),lengthx),6))
a<-table.row.end(a)
}
a<-table.end(a)
table.save(a,file='mytable1.tab')