Free Statistics

of Irreproducible Research!

Author's title

Author*The author of this computation has been verified*
R Software Modulerwasp_structuraltimeseries.wasp
Title produced by softwareStructural Time Series Models
Date of computationTue, 12 Nov 2013 08:57:00 -0500
Cite this page as followsStatistical Computations at FreeStatistics.org, Office for Research Development and Education, URL https://freestatistics.org/blog/index.php?v=date/2013/Nov/12/t13842646490coftugmqdmnev5.htm/, Retrieved Fri, 03 May 2024 03:18:22 +0000
Statistical Computations at FreeStatistics.org, Office for Research Development and Education, URL https://freestatistics.org/blog/index.php?pk=224394, Retrieved Fri, 03 May 2024 03:18:22 +0000
QR Codes:

Original text written by user:
IsPrivate?No (this computation is public)
User-defined keywords
Estimated Impact78
Family? (F = Feedback message, R = changed R code, M = changed R Module, P = changed Parameters, D = changed Data)
-     [Multiple Regression] [HPC Retail Sales] [2008-03-08 13:40:54] [1c0f2c85e8a48e42648374b3bcceca26]
- RMPD    [Structural Time Series Models] [ws8] [2013-11-12 13:57:00] [e931f330ae8eb739e69629b6955c783c] [Current]
Feedback Forum

Post a new message
Dataseries X:
38
40
39
48
54
55
56
63
52
59
57
62
50


Summary of computational transaction
Raw Inputview raw input (R code)
Raw Outputview raw output of R engine
Computing time5 seconds
R Server'Gertrude Mary Cox' @ cox.wessa.net

\begin{tabular}{lllllllll}
\hline
Summary of computational transaction \tabularnewline
Raw Input & view raw input (R code)  \tabularnewline
Raw Output & view raw output of R engine  \tabularnewline
Computing time & 5 seconds \tabularnewline
R Server & 'Gertrude Mary Cox' @ cox.wessa.net \tabularnewline
\hline
\end{tabular}
%Source: https://freestatistics.org/blog/index.php?pk=224394&T=0

[TABLE]
[ROW][C]Summary of computational transaction[/C][/ROW]
[ROW][C]Raw Input[/C][C]view raw input (R code) [/C][/ROW]
[ROW][C]Raw Output[/C][C]view raw output of R engine [/C][/ROW]
[ROW][C]Computing time[/C][C]5 seconds[/C][/ROW]
[ROW][C]R Server[/C][C]'Gertrude Mary Cox' @ cox.wessa.net[/C][/ROW]
[/TABLE]
Source: https://freestatistics.org/blog/index.php?pk=224394&T=0

Globally Unique Identifier (entire table): ba.freestatistics.org/blog/index.php?pk=224394&T=0

As an alternative you can also use a QR Code:  

The GUIDs for individual cells are displayed in the table below:

Summary of computational transaction
Raw Inputview raw input (R code)
Raw Outputview raw output of R engine
Computing time5 seconds
R Server'Gertrude Mary Cox' @ cox.wessa.net


Structural Time Series Model
tObservedLevelSlopeSeasonalStand. Residuals
13838000
24038.33309011002980.4708512474729931.666909889970230.590230061685977
33939.63398522117960.942700257819702-0.6339852211795980.252662856587944
44844.71601743224472.93758796553033.283982567755341.25198469482982
55451.6427766392125.004151604683232.357223360788041.26767370788648
65556.44072193336024.89756864903266-1.44072193336018-0.0599616559974753
75658.2341749787353.33867445595584-2.23417497873498-0.875227000457784
86361.81528217901343.45981685480991.18471782098660.0689927948307368
95257.8217832413258-0.285186510137597-5.8217832413258-2.13376417073227
105957.0632951873811-0.5237287966560161.93670481261888-0.135547649903268
115756.6540083691436-0.4660253196817720.3459916308564350.0327736063066461
126259.39265707211261.149402122784572.607342927887410.91773987882119
135055.3267230895685-1.46047426184581-5.32672308956848-1.49136144431081

\begin{tabular}{lllllllll}
\hline
Structural Time Series Model \tabularnewline
t & Observed & Level & Slope & Seasonal & Stand. Residuals \tabularnewline
1 & 38 & 38 & 0 & 0 & 0 \tabularnewline
2 & 40 & 38.3330901100298 & 0.470851247472993 & 1.66690988997023 & 0.590230061685977 \tabularnewline
3 & 39 & 39.6339852211796 & 0.942700257819702 & -0.633985221179598 & 0.252662856587944 \tabularnewline
4 & 48 & 44.7160174322447 & 2.9375879655303 & 3.28398256775534 & 1.25198469482982 \tabularnewline
5 & 54 & 51.642776639212 & 5.00415160468323 & 2.35722336078804 & 1.26767370788648 \tabularnewline
6 & 55 & 56.4407219333602 & 4.89756864903266 & -1.44072193336018 & -0.0599616559974753 \tabularnewline
7 & 56 & 58.234174978735 & 3.33867445595584 & -2.23417497873498 & -0.875227000457784 \tabularnewline
8 & 63 & 61.8152821790134 & 3.4598168548099 & 1.1847178209866 & 0.0689927948307368 \tabularnewline
9 & 52 & 57.8217832413258 & -0.285186510137597 & -5.8217832413258 & -2.13376417073227 \tabularnewline
10 & 59 & 57.0632951873811 & -0.523728796656016 & 1.93670481261888 & -0.135547649903268 \tabularnewline
11 & 57 & 56.6540083691436 & -0.466025319681772 & 0.345991630856435 & 0.0327736063066461 \tabularnewline
12 & 62 & 59.3926570721126 & 1.14940212278457 & 2.60734292788741 & 0.91773987882119 \tabularnewline
13 & 50 & 55.3267230895685 & -1.46047426184581 & -5.32672308956848 & -1.49136144431081 \tabularnewline
\hline
\end{tabular}
%Source: https://freestatistics.org/blog/index.php?pk=224394&T=1

[TABLE]
[ROW][C]Structural Time Series Model[/C][/ROW]
[ROW][C]t[/C][C]Observed[/C][C]Level[/C][C]Slope[/C][C]Seasonal[/C][C]Stand. Residuals[/C][/ROW]
[ROW][C]1[/C][C]38[/C][C]38[/C][C]0[/C][C]0[/C][C]0[/C][/ROW]
[ROW][C]2[/C][C]40[/C][C]38.3330901100298[/C][C]0.470851247472993[/C][C]1.66690988997023[/C][C]0.590230061685977[/C][/ROW]
[ROW][C]3[/C][C]39[/C][C]39.6339852211796[/C][C]0.942700257819702[/C][C]-0.633985221179598[/C][C]0.252662856587944[/C][/ROW]
[ROW][C]4[/C][C]48[/C][C]44.7160174322447[/C][C]2.9375879655303[/C][C]3.28398256775534[/C][C]1.25198469482982[/C][/ROW]
[ROW][C]5[/C][C]54[/C][C]51.642776639212[/C][C]5.00415160468323[/C][C]2.35722336078804[/C][C]1.26767370788648[/C][/ROW]
[ROW][C]6[/C][C]55[/C][C]56.4407219333602[/C][C]4.89756864903266[/C][C]-1.44072193336018[/C][C]-0.0599616559974753[/C][/ROW]
[ROW][C]7[/C][C]56[/C][C]58.234174978735[/C][C]3.33867445595584[/C][C]-2.23417497873498[/C][C]-0.875227000457784[/C][/ROW]
[ROW][C]8[/C][C]63[/C][C]61.8152821790134[/C][C]3.4598168548099[/C][C]1.1847178209866[/C][C]0.0689927948307368[/C][/ROW]
[ROW][C]9[/C][C]52[/C][C]57.8217832413258[/C][C]-0.285186510137597[/C][C]-5.8217832413258[/C][C]-2.13376417073227[/C][/ROW]
[ROW][C]10[/C][C]59[/C][C]57.0632951873811[/C][C]-0.523728796656016[/C][C]1.93670481261888[/C][C]-0.135547649903268[/C][/ROW]
[ROW][C]11[/C][C]57[/C][C]56.6540083691436[/C][C]-0.466025319681772[/C][C]0.345991630856435[/C][C]0.0327736063066461[/C][/ROW]
[ROW][C]12[/C][C]62[/C][C]59.3926570721126[/C][C]1.14940212278457[/C][C]2.60734292788741[/C][C]0.91773987882119[/C][/ROW]
[ROW][C]13[/C][C]50[/C][C]55.3267230895685[/C][C]-1.46047426184581[/C][C]-5.32672308956848[/C][C]-1.49136144431081[/C][/ROW]
[/TABLE]
Source: https://freestatistics.org/blog/index.php?pk=224394&T=1

Globally Unique Identifier (entire table): ba.freestatistics.org/blog/index.php?pk=224394&T=1

As an alternative you can also use a QR Code:  

The GUIDs for individual cells are displayed in the table below:

Structural Time Series Model
tObservedLevelSlopeSeasonalStand. Residuals
13838000
24038.33309011002980.4708512474729931.666909889970230.590230061685977
33939.63398522117960.942700257819702-0.6339852211795980.252662856587944
44844.71601743224472.93758796553033.283982567755341.25198469482982
55451.6427766392125.004151604683232.357223360788041.26767370788648
65556.44072193336024.89756864903266-1.44072193336018-0.0599616559974753
75658.2341749787353.33867445595584-2.23417497873498-0.875227000457784
86361.81528217901343.45981685480991.18471782098660.0689927948307368
95257.8217832413258-0.285186510137597-5.8217832413258-2.13376417073227
105957.0632951873811-0.5237287966560161.93670481261888-0.135547649903268
115756.6540083691436-0.4660253196817720.3459916308564350.0327736063066461
126259.39265707211261.149402122784572.607342927887410.91773987882119
135055.3267230895685-1.46047426184581-5.32672308956848-1.49136144431081


Parameters (Session):
par1 = 12 ;
Parameters (R input):
par1 = 12 ;
R code (references can be found in the software module):
par1 <- as.numeric(par1)
nx <- length(x)
x <- ts(x,frequency=par1)
m <- StructTS(x,type='BSM')
m$coef
m$fitted
m$resid
mylevel <- as.numeric(m$fitted[,'level'])
myslope <- as.numeric(m$fitted[,'slope'])
myseas <- as.numeric(m$fitted[,'sea'])
myresid <- as.numeric(m$resid)
myfit <- mylevel+myseas
mylagmax <- nx/2
bitmap(file='test2.png')
op <- par(mfrow = c(2,2))
acf(as.numeric(x),lag.max = mylagmax,main='Observed')
acf(mylevel,na.action=na.pass,lag.max = mylagmax,main='Level')
acf(myseas,na.action=na.pass,lag.max = mylagmax,main='Seasonal')
acf(myresid,na.action=na.pass,lag.max = mylagmax,main='Standardized Residals')
par(op)
dev.off()
bitmap(file='test3.png')
op <- par(mfrow = c(2,2))
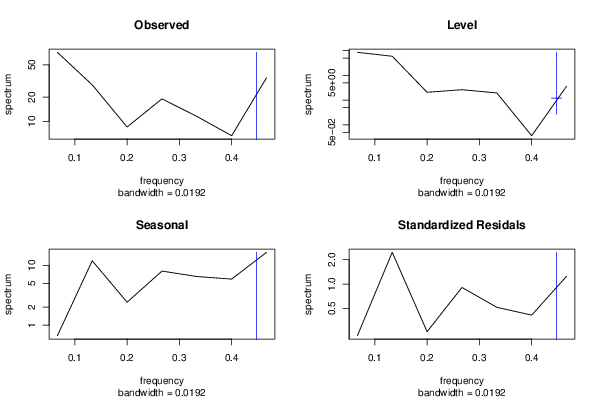
spectrum(as.numeric(x),main='Observed')
spectrum(mylevel,main='Level')
spectrum(myseas,main='Seasonal')
spectrum(myresid,main='Standardized Residals')
par(op)
dev.off()
bitmap(file='test4.png')
op <- par(mfrow = c(2,2))
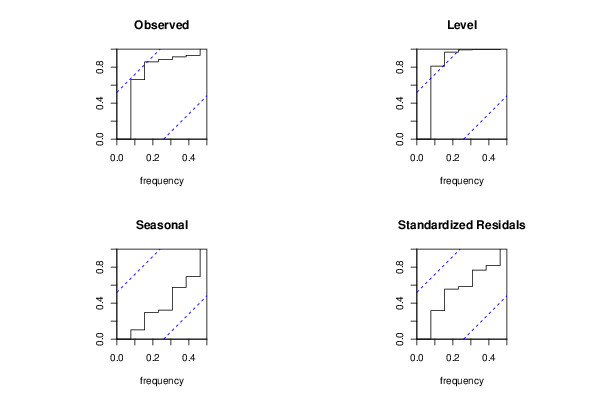
cpgram(as.numeric(x),main='Observed')
cpgram(mylevel,main='Level')
cpgram(myseas,main='Seasonal')
cpgram(myresid,main='Standardized Residals')
par(op)
dev.off()
bitmap(file='test1.png')
plot(as.numeric(m$resid),main='Standardized Residuals',ylab='Residuals',xlab='time',type='b')
grid()
dev.off()
bitmap(file='test5.png')
op <- par(mfrow = c(2,2))
hist(m$resid,main='Residual Histogram')
plot(density(m$resid),main='Residual Kernel Density')
qqnorm(m$resid,main='Residual Normal QQ Plot')
qqline(m$resid)
plot(m$resid^2, myfit^2,main='Sq.Resid vs. Sq.Fit',xlab='Squared residuals',ylab='Squared Fit')
par(op)
dev.off()
load(file='createtable')
a<-table.start()
a<-table.row.start(a)
a<-table.element(a,'Structural Time Series Model',6,TRUE)
a<-table.row.end(a)
a<-table.row.start(a)
a<-table.element(a,'t',header=TRUE)
a<-table.element(a,'Observed',header=TRUE)
a<-table.element(a,'Level',header=TRUE)
a<-table.element(a,'Slope',header=TRUE)
a<-table.element(a,'Seasonal',header=TRUE)
a<-table.element(a,'Stand. Residuals',header=TRUE)
a<-table.row.end(a)
for (i in 1:nx) {
a<-table.row.start(a)
a<-table.element(a,i,header=TRUE)
a<-table.element(a,x[i])
a<-table.element(a,mylevel[i])
a<-table.element(a,myslope[i])
a<-table.element(a,myseas[i])
a<-table.element(a,myresid[i])
a<-table.row.end(a)
}
a<-table.end(a)
table.save(a,file='mytable.tab')