Free Statistics

of Irreproducible Research!

Author's title

Author*Unverified author*
R Software Modulerwasp_autocorrelation.wasp
Title produced by software(Partial) Autocorrelation Function
Date of computationSun, 26 May 2013 20:00:56 -0400
Cite this page as followsStatistical Computations at FreeStatistics.org, Office for Research Development and Education, URL https://freestatistics.org/blog/index.php?v=date/2013/May/26/t1369612886z3yfu53k334kbbh.htm/, Retrieved Mon, 29 Apr 2024 08:04:09 +0000
Statistical Computations at FreeStatistics.org, Office for Research Development and Education, URL https://freestatistics.org/blog/index.php?pk=210695, Retrieved Mon, 29 Apr 2024 08:04:09 +0000
QR Codes:

Original text written by user:
IsPrivate?No (this computation is public)
User-defined keywords
Estimated Impact77
Family? (F = Feedback message, R = changed R code, M = changed R Module, P = changed Parameters, D = changed Data)
-       [(Partial) Autocorrelation Function] [] [2013-05-27 00:00:56] [72493e16725cf12b5fc5a9dfdf9b34f2] [Current]
Feedback Forum

Post a new message
Dataseries X:
106.1
106.17
105.75
106.49
106.61
106.61
106.61
106.61
106.92
106.94
107.28
107.36
107.36
107.39
107.46
107.51
108.21
108.33
108.33
108.36
108.89
109.3
109.55
109.45
109.45
109.4
109.45
109.5
109.91
109.9
109.9
109.92
109.74
110.28
110.97
111.02
111.02
111
111.43
111.52
112.29
112.27
112.27
112.39
112.31
112.91
112.9
113.08
113.08
113.54
114
115.28
116.4
116.56
116.56
116.59
116.96
117.17
117.83
117.84
117.84
117.84
117.69
117.9
118.05
118.08
118.08
118.08
118.16
118.53
118.5
118.62


Summary of computational transaction
Raw Inputview raw input (R code)
Raw Outputview raw output of R engine
Computing time2 seconds
R Server'Sir Maurice George Kendall' @ kendall.wessa.net

\begin{tabular}{lllllllll}
\hline
Summary of computational transaction \tabularnewline
Raw Input & view raw input (R code)  \tabularnewline
Raw Output & view raw output of R engine  \tabularnewline
Computing time & 2 seconds \tabularnewline
R Server & 'Sir Maurice George Kendall' @ kendall.wessa.net \tabularnewline
\hline
\end{tabular}
%Source: https://freestatistics.org/blog/index.php?pk=210695&T=0

[TABLE]
[ROW][C]Summary of computational transaction[/C][/ROW]
[ROW][C]Raw Input[/C][C]view raw input (R code) [/C][/ROW]
[ROW][C]Raw Output[/C][C]view raw output of R engine [/C][/ROW]
[ROW][C]Computing time[/C][C]2 seconds[/C][/ROW]
[ROW][C]R Server[/C][C]'Sir Maurice George Kendall' @ kendall.wessa.net[/C][/ROW]
[/TABLE]
Source: https://freestatistics.org/blog/index.php?pk=210695&T=0

Globally Unique Identifier (entire table): ba.freestatistics.org/blog/index.php?pk=210695&T=0

As an alternative you can also use a QR Code:  

The GUIDs for individual cells are displayed in the table below:

Summary of computational transaction
Raw Inputview raw input (R code)
Raw Outputview raw output of R engine
Computing time2 seconds
R Server'Sir Maurice George Kendall' @ kendall.wessa.net


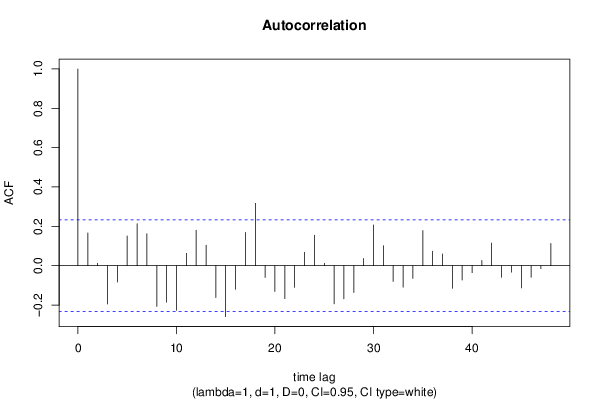
Autocorrelation Function
Time lag kACF(k)T-STATP-value
10.1662431.40080.082817
20.0120650.10170.459656
3-0.195275-1.64540.052152
4-0.082725-0.6970.244024
50.1512761.27470.10329
60.2127281.79250.038658
70.1619151.36430.088389
8-0.206999-1.74420.042726
9-0.185242-1.56090.0615
10-0.227099-1.91360.029854
110.0624110.52590.300302
120.1800191.51690.06687
130.1037130.87390.192559
14-0.161614-1.36180.088785
15-0.259166-2.18380.016142
16-0.120025-1.01140.157641
170.1689091.42330.079521
180.3166512.66820.004721
19-0.059583-0.50210.308591
20-0.130804-1.10220.137053
21-0.167575-1.4120.081157
22-0.110544-0.93150.177386
230.0685610.57770.282647
240.1551111.3070.097717
250.0121020.1020.459532
26-0.194085-1.63540.053197
27-0.167898-1.41470.080759
28-0.136307-1.14850.1273
290.0364850.30740.379707
300.2070271.74440.042705
310.101290.85350.198131
32-0.079834-0.67270.251664
33-0.10924-0.92050.180222
34-0.064548-0.54390.294111
350.178391.50310.068619
360.0730250.61530.270156
370.0595520.50180.308683
38-0.114761-0.9670.168414
39-0.073163-0.61650.269775
40-0.035265-0.29710.383611
410.0260410.21940.413473
420.1148260.96750.168278
43-0.059228-0.49910.309639
44-0.032932-0.27750.391106
45-0.113097-0.9530.171918
46-0.058843-0.49580.310777
47-0.015199-0.12810.449229
480.112610.94890.172952

\begin{tabular}{lllllllll}
\hline
Autocorrelation Function \tabularnewline
Time lag k & ACF(k) & T-STAT & P-value \tabularnewline
1 & 0.166243 & 1.4008 & 0.082817 \tabularnewline
2 & 0.012065 & 0.1017 & 0.459656 \tabularnewline
3 & -0.195275 & -1.6454 & 0.052152 \tabularnewline
4 & -0.082725 & -0.697 & 0.244024 \tabularnewline
5 & 0.151276 & 1.2747 & 0.10329 \tabularnewline
6 & 0.212728 & 1.7925 & 0.038658 \tabularnewline
7 & 0.161915 & 1.3643 & 0.088389 \tabularnewline
8 & -0.206999 & -1.7442 & 0.042726 \tabularnewline
9 & -0.185242 & -1.5609 & 0.0615 \tabularnewline
10 & -0.227099 & -1.9136 & 0.029854 \tabularnewline
11 & 0.062411 & 0.5259 & 0.300302 \tabularnewline
12 & 0.180019 & 1.5169 & 0.06687 \tabularnewline
13 & 0.103713 & 0.8739 & 0.192559 \tabularnewline
14 & -0.161614 & -1.3618 & 0.088785 \tabularnewline
15 & -0.259166 & -2.1838 & 0.016142 \tabularnewline
16 & -0.120025 & -1.0114 & 0.157641 \tabularnewline
17 & 0.168909 & 1.4233 & 0.079521 \tabularnewline
18 & 0.316651 & 2.6682 & 0.004721 \tabularnewline
19 & -0.059583 & -0.5021 & 0.308591 \tabularnewline
20 & -0.130804 & -1.1022 & 0.137053 \tabularnewline
21 & -0.167575 & -1.412 & 0.081157 \tabularnewline
22 & -0.110544 & -0.9315 & 0.177386 \tabularnewline
23 & 0.068561 & 0.5777 & 0.282647 \tabularnewline
24 & 0.155111 & 1.307 & 0.097717 \tabularnewline
25 & 0.012102 & 0.102 & 0.459532 \tabularnewline
26 & -0.194085 & -1.6354 & 0.053197 \tabularnewline
27 & -0.167898 & -1.4147 & 0.080759 \tabularnewline
28 & -0.136307 & -1.1485 & 0.1273 \tabularnewline
29 & 0.036485 & 0.3074 & 0.379707 \tabularnewline
30 & 0.207027 & 1.7444 & 0.042705 \tabularnewline
31 & 0.10129 & 0.8535 & 0.198131 \tabularnewline
32 & -0.079834 & -0.6727 & 0.251664 \tabularnewline
33 & -0.10924 & -0.9205 & 0.180222 \tabularnewline
34 & -0.064548 & -0.5439 & 0.294111 \tabularnewline
35 & 0.17839 & 1.5031 & 0.068619 \tabularnewline
36 & 0.073025 & 0.6153 & 0.270156 \tabularnewline
37 & 0.059552 & 0.5018 & 0.308683 \tabularnewline
38 & -0.114761 & -0.967 & 0.168414 \tabularnewline
39 & -0.073163 & -0.6165 & 0.269775 \tabularnewline
40 & -0.035265 & -0.2971 & 0.383611 \tabularnewline
41 & 0.026041 & 0.2194 & 0.413473 \tabularnewline
42 & 0.114826 & 0.9675 & 0.168278 \tabularnewline
43 & -0.059228 & -0.4991 & 0.309639 \tabularnewline
44 & -0.032932 & -0.2775 & 0.391106 \tabularnewline
45 & -0.113097 & -0.953 & 0.171918 \tabularnewline
46 & -0.058843 & -0.4958 & 0.310777 \tabularnewline
47 & -0.015199 & -0.1281 & 0.449229 \tabularnewline
48 & 0.11261 & 0.9489 & 0.172952 \tabularnewline
\hline
\end{tabular}
%Source: https://freestatistics.org/blog/index.php?pk=210695&T=1

[TABLE]
[ROW][C]Autocorrelation Function[/C][/ROW]
[ROW][C]Time lag k[/C][C]ACF(k)[/C][C]T-STAT[/C][C]P-value[/C][/ROW]
[ROW][C]1[/C][C]0.166243[/C][C]1.4008[/C][C]0.082817[/C][/ROW]
[ROW][C]2[/C][C]0.012065[/C][C]0.1017[/C][C]0.459656[/C][/ROW]
[ROW][C]3[/C][C]-0.195275[/C][C]-1.6454[/C][C]0.052152[/C][/ROW]
[ROW][C]4[/C][C]-0.082725[/C][C]-0.697[/C][C]0.244024[/C][/ROW]
[ROW][C]5[/C][C]0.151276[/C][C]1.2747[/C][C]0.10329[/C][/ROW]
[ROW][C]6[/C][C]0.212728[/C][C]1.7925[/C][C]0.038658[/C][/ROW]
[ROW][C]7[/C][C]0.161915[/C][C]1.3643[/C][C]0.088389[/C][/ROW]
[ROW][C]8[/C][C]-0.206999[/C][C]-1.7442[/C][C]0.042726[/C][/ROW]
[ROW][C]9[/C][C]-0.185242[/C][C]-1.5609[/C][C]0.0615[/C][/ROW]
[ROW][C]10[/C][C]-0.227099[/C][C]-1.9136[/C][C]0.029854[/C][/ROW]
[ROW][C]11[/C][C]0.062411[/C][C]0.5259[/C][C]0.300302[/C][/ROW]
[ROW][C]12[/C][C]0.180019[/C][C]1.5169[/C][C]0.06687[/C][/ROW]
[ROW][C]13[/C][C]0.103713[/C][C]0.8739[/C][C]0.192559[/C][/ROW]
[ROW][C]14[/C][C]-0.161614[/C][C]-1.3618[/C][C]0.088785[/C][/ROW]
[ROW][C]15[/C][C]-0.259166[/C][C]-2.1838[/C][C]0.016142[/C][/ROW]
[ROW][C]16[/C][C]-0.120025[/C][C]-1.0114[/C][C]0.157641[/C][/ROW]
[ROW][C]17[/C][C]0.168909[/C][C]1.4233[/C][C]0.079521[/C][/ROW]
[ROW][C]18[/C][C]0.316651[/C][C]2.6682[/C][C]0.004721[/C][/ROW]
[ROW][C]19[/C][C]-0.059583[/C][C]-0.5021[/C][C]0.308591[/C][/ROW]
[ROW][C]20[/C][C]-0.130804[/C][C]-1.1022[/C][C]0.137053[/C][/ROW]
[ROW][C]21[/C][C]-0.167575[/C][C]-1.412[/C][C]0.081157[/C][/ROW]
[ROW][C]22[/C][C]-0.110544[/C][C]-0.9315[/C][C]0.177386[/C][/ROW]
[ROW][C]23[/C][C]0.068561[/C][C]0.5777[/C][C]0.282647[/C][/ROW]
[ROW][C]24[/C][C]0.155111[/C][C]1.307[/C][C]0.097717[/C][/ROW]
[ROW][C]25[/C][C]0.012102[/C][C]0.102[/C][C]0.459532[/C][/ROW]
[ROW][C]26[/C][C]-0.194085[/C][C]-1.6354[/C][C]0.053197[/C][/ROW]
[ROW][C]27[/C][C]-0.167898[/C][C]-1.4147[/C][C]0.080759[/C][/ROW]
[ROW][C]28[/C][C]-0.136307[/C][C]-1.1485[/C][C]0.1273[/C][/ROW]
[ROW][C]29[/C][C]0.036485[/C][C]0.3074[/C][C]0.379707[/C][/ROW]
[ROW][C]30[/C][C]0.207027[/C][C]1.7444[/C][C]0.042705[/C][/ROW]
[ROW][C]31[/C][C]0.10129[/C][C]0.8535[/C][C]0.198131[/C][/ROW]
[ROW][C]32[/C][C]-0.079834[/C][C]-0.6727[/C][C]0.251664[/C][/ROW]
[ROW][C]33[/C][C]-0.10924[/C][C]-0.9205[/C][C]0.180222[/C][/ROW]
[ROW][C]34[/C][C]-0.064548[/C][C]-0.5439[/C][C]0.294111[/C][/ROW]
[ROW][C]35[/C][C]0.17839[/C][C]1.5031[/C][C]0.068619[/C][/ROW]
[ROW][C]36[/C][C]0.073025[/C][C]0.6153[/C][C]0.270156[/C][/ROW]
[ROW][C]37[/C][C]0.059552[/C][C]0.5018[/C][C]0.308683[/C][/ROW]
[ROW][C]38[/C][C]-0.114761[/C][C]-0.967[/C][C]0.168414[/C][/ROW]
[ROW][C]39[/C][C]-0.073163[/C][C]-0.6165[/C][C]0.269775[/C][/ROW]
[ROW][C]40[/C][C]-0.035265[/C][C]-0.2971[/C][C]0.383611[/C][/ROW]
[ROW][C]41[/C][C]0.026041[/C][C]0.2194[/C][C]0.413473[/C][/ROW]
[ROW][C]42[/C][C]0.114826[/C][C]0.9675[/C][C]0.168278[/C][/ROW]
[ROW][C]43[/C][C]-0.059228[/C][C]-0.4991[/C][C]0.309639[/C][/ROW]
[ROW][C]44[/C][C]-0.032932[/C][C]-0.2775[/C][C]0.391106[/C][/ROW]
[ROW][C]45[/C][C]-0.113097[/C][C]-0.953[/C][C]0.171918[/C][/ROW]
[ROW][C]46[/C][C]-0.058843[/C][C]-0.4958[/C][C]0.310777[/C][/ROW]
[ROW][C]47[/C][C]-0.015199[/C][C]-0.1281[/C][C]0.449229[/C][/ROW]
[ROW][C]48[/C][C]0.11261[/C][C]0.9489[/C][C]0.172952[/C][/ROW]
[/TABLE]
Source: https://freestatistics.org/blog/index.php?pk=210695&T=1

Globally Unique Identifier (entire table): ba.freestatistics.org/blog/index.php?pk=210695&T=1

As an alternative you can also use a QR Code:  

The GUIDs for individual cells are displayed in the table below:

Autocorrelation Function
Time lag kACF(k)T-STATP-value
10.1662431.40080.082817
20.0120650.10170.459656
3-0.195275-1.64540.052152
4-0.082725-0.6970.244024
50.1512761.27470.10329
60.2127281.79250.038658
70.1619151.36430.088389
8-0.206999-1.74420.042726
9-0.185242-1.56090.0615
10-0.227099-1.91360.029854
110.0624110.52590.300302
120.1800191.51690.06687
130.1037130.87390.192559
14-0.161614-1.36180.088785
15-0.259166-2.18380.016142
16-0.120025-1.01140.157641
170.1689091.42330.079521
180.3166512.66820.004721
19-0.059583-0.50210.308591
20-0.130804-1.10220.137053
21-0.167575-1.4120.081157
22-0.110544-0.93150.177386
230.0685610.57770.282647
240.1551111.3070.097717
250.0121020.1020.459532
26-0.194085-1.63540.053197
27-0.167898-1.41470.080759
28-0.136307-1.14850.1273
290.0364850.30740.379707
300.2070271.74440.042705
310.101290.85350.198131
32-0.079834-0.67270.251664
33-0.10924-0.92050.180222
34-0.064548-0.54390.294111
350.178391.50310.068619
360.0730250.61530.270156
370.0595520.50180.308683
38-0.114761-0.9670.168414
39-0.073163-0.61650.269775
40-0.035265-0.29710.383611
410.0260410.21940.413473
420.1148260.96750.168278
43-0.059228-0.49910.309639
44-0.032932-0.27750.391106
45-0.113097-0.9530.171918
46-0.058843-0.49580.310777
47-0.015199-0.12810.449229
480.112610.94890.172952


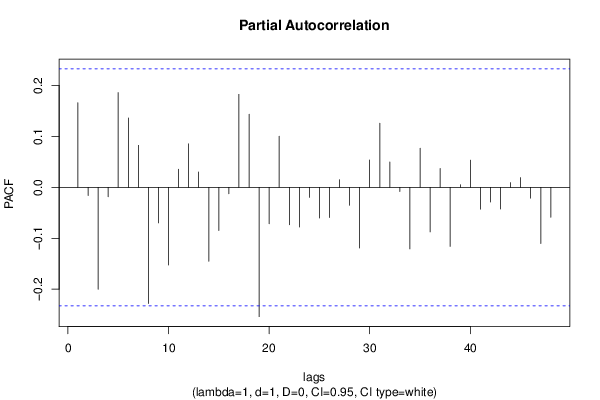
Partial Autocorrelation Function
Time lag kPACF(k)T-STATP-value
10.1662431.40080.082817
2-0.016014-0.13490.446522
3-0.200234-1.68720.047976
4-0.018534-0.15620.43817
50.1861861.56880.060566
60.1362751.14830.127355
70.0824790.6950.244667
8-0.228175-1.92260.029269
9-0.069827-0.58840.279074
10-0.152465-1.28470.101538
110.0356410.30030.382408
120.0854950.72040.236824
130.0301250.25380.400176
14-0.145276-1.22410.112477
15-0.084684-0.71360.238918
16-0.012506-0.10540.458185
170.1826211.53880.06415
180.1435521.20960.115224
19-0.25402-2.14040.017879
20-0.071508-0.60250.274367
210.1003990.8460.200203
22-0.073334-0.61790.269301
23-0.077993-0.65720.256594
24-0.019693-0.16590.43434
25-0.060195-0.50720.306789
26-0.059251-0.49930.309572
270.0148130.12480.450511
28-0.035076-0.29560.384217
29-0.119267-1.0050.159164
300.0538910.45410.325574
310.125841.06030.14629
320.0499190.42060.33765
33-0.00829-0.06980.472255
34-0.120899-1.01870.155899
350.0766670.6460.260177
36-0.087538-0.73760.231591
370.0371240.31280.377671
38-0.116007-0.97750.165821
390.0049850.0420.483306
400.0534250.45020.32698
41-0.042823-0.36080.359648
42-0.028753-0.24230.404632
43-0.042391-0.35720.361004
440.0093360.07870.46876
450.0191450.16130.436149
46-0.021266-0.17920.42915
47-0.11026-0.92910.178001
48-0.058758-0.49510.311028

\begin{tabular}{lllllllll}
\hline
Partial Autocorrelation Function \tabularnewline
Time lag k & PACF(k) & T-STAT & P-value \tabularnewline
1 & 0.166243 & 1.4008 & 0.082817 \tabularnewline
2 & -0.016014 & -0.1349 & 0.446522 \tabularnewline
3 & -0.200234 & -1.6872 & 0.047976 \tabularnewline
4 & -0.018534 & -0.1562 & 0.43817 \tabularnewline
5 & 0.186186 & 1.5688 & 0.060566 \tabularnewline
6 & 0.136275 & 1.1483 & 0.127355 \tabularnewline
7 & 0.082479 & 0.695 & 0.244667 \tabularnewline
8 & -0.228175 & -1.9226 & 0.029269 \tabularnewline
9 & -0.069827 & -0.5884 & 0.279074 \tabularnewline
10 & -0.152465 & -1.2847 & 0.101538 \tabularnewline
11 & 0.035641 & 0.3003 & 0.382408 \tabularnewline
12 & 0.085495 & 0.7204 & 0.236824 \tabularnewline
13 & 0.030125 & 0.2538 & 0.400176 \tabularnewline
14 & -0.145276 & -1.2241 & 0.112477 \tabularnewline
15 & -0.084684 & -0.7136 & 0.238918 \tabularnewline
16 & -0.012506 & -0.1054 & 0.458185 \tabularnewline
17 & 0.182621 & 1.5388 & 0.06415 \tabularnewline
18 & 0.143552 & 1.2096 & 0.115224 \tabularnewline
19 & -0.25402 & -2.1404 & 0.017879 \tabularnewline
20 & -0.071508 & -0.6025 & 0.274367 \tabularnewline
21 & 0.100399 & 0.846 & 0.200203 \tabularnewline
22 & -0.073334 & -0.6179 & 0.269301 \tabularnewline
23 & -0.077993 & -0.6572 & 0.256594 \tabularnewline
24 & -0.019693 & -0.1659 & 0.43434 \tabularnewline
25 & -0.060195 & -0.5072 & 0.306789 \tabularnewline
26 & -0.059251 & -0.4993 & 0.309572 \tabularnewline
27 & 0.014813 & 0.1248 & 0.450511 \tabularnewline
28 & -0.035076 & -0.2956 & 0.384217 \tabularnewline
29 & -0.119267 & -1.005 & 0.159164 \tabularnewline
30 & 0.053891 & 0.4541 & 0.325574 \tabularnewline
31 & 0.12584 & 1.0603 & 0.14629 \tabularnewline
32 & 0.049919 & 0.4206 & 0.33765 \tabularnewline
33 & -0.00829 & -0.0698 & 0.472255 \tabularnewline
34 & -0.120899 & -1.0187 & 0.155899 \tabularnewline
35 & 0.076667 & 0.646 & 0.260177 \tabularnewline
36 & -0.087538 & -0.7376 & 0.231591 \tabularnewline
37 & 0.037124 & 0.3128 & 0.377671 \tabularnewline
38 & -0.116007 & -0.9775 & 0.165821 \tabularnewline
39 & 0.004985 & 0.042 & 0.483306 \tabularnewline
40 & 0.053425 & 0.4502 & 0.32698 \tabularnewline
41 & -0.042823 & -0.3608 & 0.359648 \tabularnewline
42 & -0.028753 & -0.2423 & 0.404632 \tabularnewline
43 & -0.042391 & -0.3572 & 0.361004 \tabularnewline
44 & 0.009336 & 0.0787 & 0.46876 \tabularnewline
45 & 0.019145 & 0.1613 & 0.436149 \tabularnewline
46 & -0.021266 & -0.1792 & 0.42915 \tabularnewline
47 & -0.11026 & -0.9291 & 0.178001 \tabularnewline
48 & -0.058758 & -0.4951 & 0.311028 \tabularnewline
\hline
\end{tabular}
%Source: https://freestatistics.org/blog/index.php?pk=210695&T=2

[TABLE]
[ROW][C]Partial Autocorrelation Function[/C][/ROW]
[ROW][C]Time lag k[/C][C]PACF(k)[/C][C]T-STAT[/C][C]P-value[/C][/ROW]
[ROW][C]1[/C][C]0.166243[/C][C]1.4008[/C][C]0.082817[/C][/ROW]
[ROW][C]2[/C][C]-0.016014[/C][C]-0.1349[/C][C]0.446522[/C][/ROW]
[ROW][C]3[/C][C]-0.200234[/C][C]-1.6872[/C][C]0.047976[/C][/ROW]
[ROW][C]4[/C][C]-0.018534[/C][C]-0.1562[/C][C]0.43817[/C][/ROW]
[ROW][C]5[/C][C]0.186186[/C][C]1.5688[/C][C]0.060566[/C][/ROW]
[ROW][C]6[/C][C]0.136275[/C][C]1.1483[/C][C]0.127355[/C][/ROW]
[ROW][C]7[/C][C]0.082479[/C][C]0.695[/C][C]0.244667[/C][/ROW]
[ROW][C]8[/C][C]-0.228175[/C][C]-1.9226[/C][C]0.029269[/C][/ROW]
[ROW][C]9[/C][C]-0.069827[/C][C]-0.5884[/C][C]0.279074[/C][/ROW]
[ROW][C]10[/C][C]-0.152465[/C][C]-1.2847[/C][C]0.101538[/C][/ROW]
[ROW][C]11[/C][C]0.035641[/C][C]0.3003[/C][C]0.382408[/C][/ROW]
[ROW][C]12[/C][C]0.085495[/C][C]0.7204[/C][C]0.236824[/C][/ROW]
[ROW][C]13[/C][C]0.030125[/C][C]0.2538[/C][C]0.400176[/C][/ROW]
[ROW][C]14[/C][C]-0.145276[/C][C]-1.2241[/C][C]0.112477[/C][/ROW]
[ROW][C]15[/C][C]-0.084684[/C][C]-0.7136[/C][C]0.238918[/C][/ROW]
[ROW][C]16[/C][C]-0.012506[/C][C]-0.1054[/C][C]0.458185[/C][/ROW]
[ROW][C]17[/C][C]0.182621[/C][C]1.5388[/C][C]0.06415[/C][/ROW]
[ROW][C]18[/C][C]0.143552[/C][C]1.2096[/C][C]0.115224[/C][/ROW]
[ROW][C]19[/C][C]-0.25402[/C][C]-2.1404[/C][C]0.017879[/C][/ROW]
[ROW][C]20[/C][C]-0.071508[/C][C]-0.6025[/C][C]0.274367[/C][/ROW]
[ROW][C]21[/C][C]0.100399[/C][C]0.846[/C][C]0.200203[/C][/ROW]
[ROW][C]22[/C][C]-0.073334[/C][C]-0.6179[/C][C]0.269301[/C][/ROW]
[ROW][C]23[/C][C]-0.077993[/C][C]-0.6572[/C][C]0.256594[/C][/ROW]
[ROW][C]24[/C][C]-0.019693[/C][C]-0.1659[/C][C]0.43434[/C][/ROW]
[ROW][C]25[/C][C]-0.060195[/C][C]-0.5072[/C][C]0.306789[/C][/ROW]
[ROW][C]26[/C][C]-0.059251[/C][C]-0.4993[/C][C]0.309572[/C][/ROW]
[ROW][C]27[/C][C]0.014813[/C][C]0.1248[/C][C]0.450511[/C][/ROW]
[ROW][C]28[/C][C]-0.035076[/C][C]-0.2956[/C][C]0.384217[/C][/ROW]
[ROW][C]29[/C][C]-0.119267[/C][C]-1.005[/C][C]0.159164[/C][/ROW]
[ROW][C]30[/C][C]0.053891[/C][C]0.4541[/C][C]0.325574[/C][/ROW]
[ROW][C]31[/C][C]0.12584[/C][C]1.0603[/C][C]0.14629[/C][/ROW]
[ROW][C]32[/C][C]0.049919[/C][C]0.4206[/C][C]0.33765[/C][/ROW]
[ROW][C]33[/C][C]-0.00829[/C][C]-0.0698[/C][C]0.472255[/C][/ROW]
[ROW][C]34[/C][C]-0.120899[/C][C]-1.0187[/C][C]0.155899[/C][/ROW]
[ROW][C]35[/C][C]0.076667[/C][C]0.646[/C][C]0.260177[/C][/ROW]
[ROW][C]36[/C][C]-0.087538[/C][C]-0.7376[/C][C]0.231591[/C][/ROW]
[ROW][C]37[/C][C]0.037124[/C][C]0.3128[/C][C]0.377671[/C][/ROW]
[ROW][C]38[/C][C]-0.116007[/C][C]-0.9775[/C][C]0.165821[/C][/ROW]
[ROW][C]39[/C][C]0.004985[/C][C]0.042[/C][C]0.483306[/C][/ROW]
[ROW][C]40[/C][C]0.053425[/C][C]0.4502[/C][C]0.32698[/C][/ROW]
[ROW][C]41[/C][C]-0.042823[/C][C]-0.3608[/C][C]0.359648[/C][/ROW]
[ROW][C]42[/C][C]-0.028753[/C][C]-0.2423[/C][C]0.404632[/C][/ROW]
[ROW][C]43[/C][C]-0.042391[/C][C]-0.3572[/C][C]0.361004[/C][/ROW]
[ROW][C]44[/C][C]0.009336[/C][C]0.0787[/C][C]0.46876[/C][/ROW]
[ROW][C]45[/C][C]0.019145[/C][C]0.1613[/C][C]0.436149[/C][/ROW]
[ROW][C]46[/C][C]-0.021266[/C][C]-0.1792[/C][C]0.42915[/C][/ROW]
[ROW][C]47[/C][C]-0.11026[/C][C]-0.9291[/C][C]0.178001[/C][/ROW]
[ROW][C]48[/C][C]-0.058758[/C][C]-0.4951[/C][C]0.311028[/C][/ROW]
[/TABLE]
Source: https://freestatistics.org/blog/index.php?pk=210695&T=2

Globally Unique Identifier (entire table): ba.freestatistics.org/blog/index.php?pk=210695&T=2

As an alternative you can also use a QR Code:  

The GUIDs for individual cells are displayed in the table below:

Partial Autocorrelation Function
Time lag kPACF(k)T-STATP-value
10.1662431.40080.082817
2-0.016014-0.13490.446522
3-0.200234-1.68720.047976
4-0.018534-0.15620.43817
50.1861861.56880.060566
60.1362751.14830.127355
70.0824790.6950.244667
8-0.228175-1.92260.029269
9-0.069827-0.58840.279074
10-0.152465-1.28470.101538
110.0356410.30030.382408
120.0854950.72040.236824
130.0301250.25380.400176
14-0.145276-1.22410.112477
15-0.084684-0.71360.238918
16-0.012506-0.10540.458185
170.1826211.53880.06415
180.1435521.20960.115224
19-0.25402-2.14040.017879
20-0.071508-0.60250.274367
210.1003990.8460.200203
22-0.073334-0.61790.269301
23-0.077993-0.65720.256594
24-0.019693-0.16590.43434
25-0.060195-0.50720.306789
26-0.059251-0.49930.309572
270.0148130.12480.450511
28-0.035076-0.29560.384217
29-0.119267-1.0050.159164
300.0538910.45410.325574
310.125841.06030.14629
320.0499190.42060.33765
33-0.00829-0.06980.472255
34-0.120899-1.01870.155899
350.0766670.6460.260177
36-0.087538-0.73760.231591
370.0371240.31280.377671
38-0.116007-0.97750.165821
390.0049850.0420.483306
400.0534250.45020.32698
41-0.042823-0.36080.359648
42-0.028753-0.24230.404632
43-0.042391-0.35720.361004
440.0093360.07870.46876
450.0191450.16130.436149
46-0.021266-0.17920.42915
47-0.11026-0.92910.178001
48-0.058758-0.49510.311028


Parameters (Session):
par1 = 48 ; par2 = 1 ; par3 = 1 ; par4 = 0 ; par5 = 12 ; par6 = White Noise ; par7 = 0.95 ;
Parameters (R input):
par1 = 48 ; par2 = 1 ; par3 = 1 ; par4 = 0 ; par5 = 12 ; par6 = White Noise ; par7 = 0.95 ; par8 = ;
R code (references can be found in the software module):
par8 <- ''
par7 <- '0.95'
par6 <- 'White Noise'
par5 <- '12'
par4 <- '0'
par3 <- '0'
par2 <- '1'
par1 <- '48'
if (par1 == 'Default') {
par1 = 10*log10(length(x))
} else {
par1 <- as.numeric(par1)
}
par2 <- as.numeric(par2)
par3 <- as.numeric(par3)
par4 <- as.numeric(par4)
par5 <- as.numeric(par5)
if (par6 == 'White Noise') par6 <- 'white' else par6 <- 'ma'
par7 <- as.numeric(par7)
if (par8 != '') par8 <- as.numeric(par8)
ox <- x
if (par8 == '') {
if (par2 == 0) {
x <- log(x)
} else {
x <- (x ^ par2 - 1) / par2
}
} else {
x <- log(x,base=par8)
}
if (par3 > 0) x <- diff(x,lag=1,difference=par3)
if (par4 > 0) x <- diff(x,lag=par5,difference=par4)
bitmap(file='picts.png')
op <- par(mfrow=c(2,1))
plot(ox,type='l',main='Original Time Series',xlab='time',ylab='value')
if (par8=='') {
mytitle <- paste('Working Time Series (lambda=',par2,', d=',par3,', D=',par4,')',sep='')
mysub <- paste('(lambda=',par2,', d=',par3,', D=',par4,', CI=', par7, ', CI type=',par6,')',sep='')
} else {
mytitle <- paste('Working Time Series (base=',par8,', d=',par3,', D=',par4,')',sep='')
mysub <- paste('(base=',par8,', d=',par3,', D=',par4,', CI=', par7, ', CI type=',par6,')',sep='')
}
plot(x,type='l', main=mytitle,xlab='time',ylab='value')
par(op)
dev.off()
bitmap(file='pic1.png')
racf <- acf(x, par1, main='Autocorrelation', xlab='time lag', ylab='ACF', ci.type=par6, ci=par7, sub=mysub)
dev.off()
bitmap(file='pic2.png')
rpacf <- pacf(x,par1,main='Partial Autocorrelation',xlab='lags',ylab='PACF',sub=mysub)
dev.off()
(myacf <- c(racf$acf))
(mypacf <- c(rpacf$acf))
lengthx <- length(x)
sqrtn <- sqrt(lengthx)
load(file='createtable')
a<-table.start()
a<-table.row.start(a)
a<-table.element(a,'Autocorrelation Function',4,TRUE)
a<-table.row.end(a)
a<-table.row.start(a)
a<-table.element(a,'Time lag k',header=TRUE)
a<-table.element(a,hyperlink('basics.htm','ACF(k)','click here for more information about the Autocorrelation Function'),header=TRUE)
a<-table.element(a,'T-STAT',header=TRUE)
a<-table.element(a,'P-value',header=TRUE)
a<-table.row.end(a)
for (i in 2:(par1+1)) {
a<-table.row.start(a)
a<-table.element(a,i-1,header=TRUE)
a<-table.element(a,round(myacf[i],6))
mytstat <- myacf[i]*sqrtn
a<-table.element(a,round(mytstat,4))
a<-table.element(a,round(1-pt(abs(mytstat),lengthx),6))
a<-table.row.end(a)
}
a<-table.end(a)
table.save(a,file='mytable.tab')
a<-table.start()
a<-table.row.start(a)
a<-table.element(a,'Partial Autocorrelation Function',4,TRUE)
a<-table.row.end(a)
a<-table.row.start(a)
a<-table.element(a,'Time lag k',header=TRUE)
a<-table.element(a,hyperlink('basics.htm','PACF(k)','click here for more information about the Partial Autocorrelation Function'),header=TRUE)
a<-table.element(a,'T-STAT',header=TRUE)
a<-table.element(a,'P-value',header=TRUE)
a<-table.row.end(a)
for (i in 1:par1) {
a<-table.row.start(a)
a<-table.element(a,i,header=TRUE)
a<-table.element(a,round(mypacf[i],6))
mytstat <- mypacf[i]*sqrtn
a<-table.element(a,round(mytstat,4))
a<-table.element(a,round(1-pt(abs(mytstat),lengthx),6))
a<-table.row.end(a)
}
a<-table.end(a)
table.save(a,file='mytable1.tab')