Free Statistics

of Irreproducible Research!

Author's title

Author*Unverified author*
R Software Modulerwasp_autocorrelation.wasp
Title produced by software(Partial) Autocorrelation Function
Date of computationSun, 26 May 2013 19:59:35 -0400
Cite this page as followsStatistical Computations at FreeStatistics.org, Office for Research Development and Education, URL https://freestatistics.org/blog/index.php?v=date/2013/May/26/t1369612805f57k6ycr7fplok7.htm/, Retrieved Mon, 29 Apr 2024 10:58:36 +0000
Statistical Computations at FreeStatistics.org, Office for Research Development and Education, URL https://freestatistics.org/blog/index.php?pk=210694, Retrieved Mon, 29 Apr 2024 10:58:36 +0000
QR Codes:

Original text written by user:
IsPrivate?No (this computation is public)
User-defined keywords
Estimated Impact65
Family? (F = Feedback message, R = changed R code, M = changed R Module, P = changed Parameters, D = changed Data)
-       [(Partial) Autocorrelation Function] [] [2013-05-26 23:59:35] [72493e16725cf12b5fc5a9dfdf9b34f2] [Current]
Feedback Forum

Post a new message
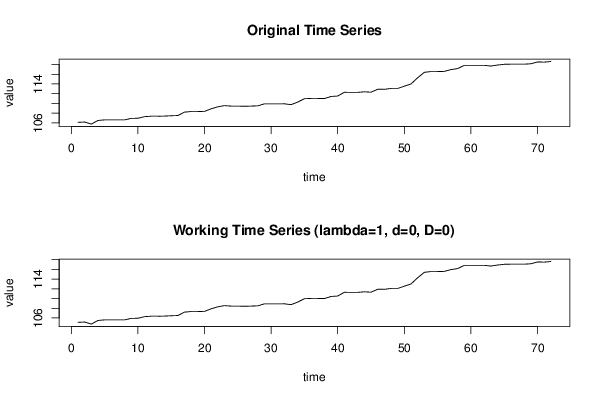
Dataseries X:
106,1
106,17
105,75
106,49
106,61
106,61
106,61
106,61
106,92
106,94
107,28
107,36
107,36
107,39
107,46
107,51
108,21
108,33
108,33
108,36
108,89
109,3
109,55
109,45
109,45
109,4
109,45
109,5
109,91
109,9
109,9
109,92
109,74
110,28
110,97
111,02
111,02
111
111,43
111,52
112,29
112,27
112,27
112,39
112,31
112,91
112,9
113,08
113,08
113,54
114
115,28
116,4
116,56
116,56
116,59
116,96
117,17
117,83
117,84
117,84
117,84
117,69
117,9
118,05
118,08
118,08
118,08
118,16
118,53
118,5
118,62


Summary of computational transaction
Raw Inputview raw input (R code)
Raw Outputview raw output of R engine
Computing time3 seconds
R Server'Gertrude Mary Cox' @ cox.wessa.net

\begin{tabular}{lllllllll}
\hline
Summary of computational transaction \tabularnewline
Raw Input & view raw input (R code)  \tabularnewline
Raw Output & view raw output of R engine  \tabularnewline
Computing time & 3 seconds \tabularnewline
R Server & 'Gertrude Mary Cox' @ cox.wessa.net \tabularnewline
\hline
\end{tabular}
%Source: https://freestatistics.org/blog/index.php?pk=210694&T=0

[TABLE]
[ROW][C]Summary of computational transaction[/C][/ROW]
[ROW][C]Raw Input[/C][C]view raw input (R code) [/C][/ROW]
[ROW][C]Raw Output[/C][C]view raw output of R engine [/C][/ROW]
[ROW][C]Computing time[/C][C]3 seconds[/C][/ROW]
[ROW][C]R Server[/C][C]'Gertrude Mary Cox' @ cox.wessa.net[/C][/ROW]
[/TABLE]
Source: https://freestatistics.org/blog/index.php?pk=210694&T=0

Globally Unique Identifier (entire table): ba.freestatistics.org/blog/index.php?pk=210694&T=0

As an alternative you can also use a QR Code:  

The GUIDs for individual cells are displayed in the table below:

Summary of computational transaction
Raw Inputview raw input (R code)
Raw Outputview raw output of R engine
Computing time3 seconds
R Server'Gertrude Mary Cox' @ cox.wessa.net


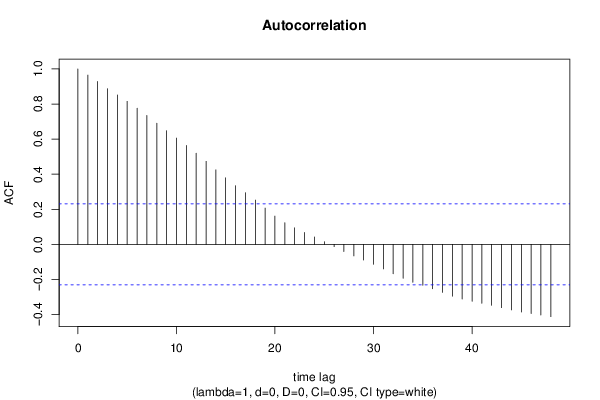
Autocorrelation Function
Time lag kACF(k)T-STATP-value
10.9649378.18780
20.9282527.87650
30.8875427.5310
40.8515057.22530
50.8151446.91670
60.7762816.5870
70.7345886.23320
80.6904585.85870
90.6478495.49720
100.6056455.13911e-06
110.5635794.78214e-06
120.5198134.41081.8e-05
130.4733694.01677.2e-05
140.4247993.60450.000286
150.3792173.21780.000969
160.334582.8390.002939
170.29422.49640.007419
180.2521092.13920.017905
190.206831.7550.041756
200.1612421.36820.087755
210.1234371.04740.14921
220.0941260.79870.213549
230.0679060.57620.283137
240.0422950.35890.360365
250.01480.12560.450207
26-0.013129-0.11140.455804
27-0.041057-0.34840.364284
28-0.065733-0.55780.289368
29-0.089322-0.75790.225486
30-0.113546-0.96350.169269
31-0.139883-1.18690.119575
32-0.167849-1.42420.079347
33-0.193118-1.63870.052823
34-0.215846-1.83150.03558
35-0.233579-1.9820.02565
36-0.252948-2.14630.017608
37-0.27358-2.32140.01155
38-0.295248-2.50530.007249
39-0.311394-2.64230.005048
40-0.324548-2.75390.003725
41-0.335607-2.84770.002867
42-0.347468-2.94840.002152
43-0.360612-3.05990.001555
44-0.373685-3.17080.001117
45-0.385437-3.27050.000824
46-0.394216-3.3450.000655
47-0.40313-3.42070.000516
48-0.412068-3.49650.000406

\begin{tabular}{lllllllll}
\hline
Autocorrelation Function \tabularnewline
Time lag k & ACF(k) & T-STAT & P-value \tabularnewline
1 & 0.964937 & 8.1878 & 0 \tabularnewline
2 & 0.928252 & 7.8765 & 0 \tabularnewline
3 & 0.887542 & 7.531 & 0 \tabularnewline
4 & 0.851505 & 7.2253 & 0 \tabularnewline
5 & 0.815144 & 6.9167 & 0 \tabularnewline
6 & 0.776281 & 6.587 & 0 \tabularnewline
7 & 0.734588 & 6.2332 & 0 \tabularnewline
8 & 0.690458 & 5.8587 & 0 \tabularnewline
9 & 0.647849 & 5.4972 & 0 \tabularnewline
10 & 0.605645 & 5.1391 & 1e-06 \tabularnewline
11 & 0.563579 & 4.7821 & 4e-06 \tabularnewline
12 & 0.519813 & 4.4108 & 1.8e-05 \tabularnewline
13 & 0.473369 & 4.0167 & 7.2e-05 \tabularnewline
14 & 0.424799 & 3.6045 & 0.000286 \tabularnewline
15 & 0.379217 & 3.2178 & 0.000969 \tabularnewline
16 & 0.33458 & 2.839 & 0.002939 \tabularnewline
17 & 0.2942 & 2.4964 & 0.007419 \tabularnewline
18 & 0.252109 & 2.1392 & 0.017905 \tabularnewline
19 & 0.20683 & 1.755 & 0.041756 \tabularnewline
20 & 0.161242 & 1.3682 & 0.087755 \tabularnewline
21 & 0.123437 & 1.0474 & 0.14921 \tabularnewline
22 & 0.094126 & 0.7987 & 0.213549 \tabularnewline
23 & 0.067906 & 0.5762 & 0.283137 \tabularnewline
24 & 0.042295 & 0.3589 & 0.360365 \tabularnewline
25 & 0.0148 & 0.1256 & 0.450207 \tabularnewline
26 & -0.013129 & -0.1114 & 0.455804 \tabularnewline
27 & -0.041057 & -0.3484 & 0.364284 \tabularnewline
28 & -0.065733 & -0.5578 & 0.289368 \tabularnewline
29 & -0.089322 & -0.7579 & 0.225486 \tabularnewline
30 & -0.113546 & -0.9635 & 0.169269 \tabularnewline
31 & -0.139883 & -1.1869 & 0.119575 \tabularnewline
32 & -0.167849 & -1.4242 & 0.079347 \tabularnewline
33 & -0.193118 & -1.6387 & 0.052823 \tabularnewline
34 & -0.215846 & -1.8315 & 0.03558 \tabularnewline
35 & -0.233579 & -1.982 & 0.02565 \tabularnewline
36 & -0.252948 & -2.1463 & 0.017608 \tabularnewline
37 & -0.27358 & -2.3214 & 0.01155 \tabularnewline
38 & -0.295248 & -2.5053 & 0.007249 \tabularnewline
39 & -0.311394 & -2.6423 & 0.005048 \tabularnewline
40 & -0.324548 & -2.7539 & 0.003725 \tabularnewline
41 & -0.335607 & -2.8477 & 0.002867 \tabularnewline
42 & -0.347468 & -2.9484 & 0.002152 \tabularnewline
43 & -0.360612 & -3.0599 & 0.001555 \tabularnewline
44 & -0.373685 & -3.1708 & 0.001117 \tabularnewline
45 & -0.385437 & -3.2705 & 0.000824 \tabularnewline
46 & -0.394216 & -3.345 & 0.000655 \tabularnewline
47 & -0.40313 & -3.4207 & 0.000516 \tabularnewline
48 & -0.412068 & -3.4965 & 0.000406 \tabularnewline
\hline
\end{tabular}
%Source: https://freestatistics.org/blog/index.php?pk=210694&T=1

[TABLE]
[ROW][C]Autocorrelation Function[/C][/ROW]
[ROW][C]Time lag k[/C][C]ACF(k)[/C][C]T-STAT[/C][C]P-value[/C][/ROW]
[ROW][C]1[/C][C]0.964937[/C][C]8.1878[/C][C]0[/C][/ROW]
[ROW][C]2[/C][C]0.928252[/C][C]7.8765[/C][C]0[/C][/ROW]
[ROW][C]3[/C][C]0.887542[/C][C]7.531[/C][C]0[/C][/ROW]
[ROW][C]4[/C][C]0.851505[/C][C]7.2253[/C][C]0[/C][/ROW]
[ROW][C]5[/C][C]0.815144[/C][C]6.9167[/C][C]0[/C][/ROW]
[ROW][C]6[/C][C]0.776281[/C][C]6.587[/C][C]0[/C][/ROW]
[ROW][C]7[/C][C]0.734588[/C][C]6.2332[/C][C]0[/C][/ROW]
[ROW][C]8[/C][C]0.690458[/C][C]5.8587[/C][C]0[/C][/ROW]
[ROW][C]9[/C][C]0.647849[/C][C]5.4972[/C][C]0[/C][/ROW]
[ROW][C]10[/C][C]0.605645[/C][C]5.1391[/C][C]1e-06[/C][/ROW]
[ROW][C]11[/C][C]0.563579[/C][C]4.7821[/C][C]4e-06[/C][/ROW]
[ROW][C]12[/C][C]0.519813[/C][C]4.4108[/C][C]1.8e-05[/C][/ROW]
[ROW][C]13[/C][C]0.473369[/C][C]4.0167[/C][C]7.2e-05[/C][/ROW]
[ROW][C]14[/C][C]0.424799[/C][C]3.6045[/C][C]0.000286[/C][/ROW]
[ROW][C]15[/C][C]0.379217[/C][C]3.2178[/C][C]0.000969[/C][/ROW]
[ROW][C]16[/C][C]0.33458[/C][C]2.839[/C][C]0.002939[/C][/ROW]
[ROW][C]17[/C][C]0.2942[/C][C]2.4964[/C][C]0.007419[/C][/ROW]
[ROW][C]18[/C][C]0.252109[/C][C]2.1392[/C][C]0.017905[/C][/ROW]
[ROW][C]19[/C][C]0.20683[/C][C]1.755[/C][C]0.041756[/C][/ROW]
[ROW][C]20[/C][C]0.161242[/C][C]1.3682[/C][C]0.087755[/C][/ROW]
[ROW][C]21[/C][C]0.123437[/C][C]1.0474[/C][C]0.14921[/C][/ROW]
[ROW][C]22[/C][C]0.094126[/C][C]0.7987[/C][C]0.213549[/C][/ROW]
[ROW][C]23[/C][C]0.067906[/C][C]0.5762[/C][C]0.283137[/C][/ROW]
[ROW][C]24[/C][C]0.042295[/C][C]0.3589[/C][C]0.360365[/C][/ROW]
[ROW][C]25[/C][C]0.0148[/C][C]0.1256[/C][C]0.450207[/C][/ROW]
[ROW][C]26[/C][C]-0.013129[/C][C]-0.1114[/C][C]0.455804[/C][/ROW]
[ROW][C]27[/C][C]-0.041057[/C][C]-0.3484[/C][C]0.364284[/C][/ROW]
[ROW][C]28[/C][C]-0.065733[/C][C]-0.5578[/C][C]0.289368[/C][/ROW]
[ROW][C]29[/C][C]-0.089322[/C][C]-0.7579[/C][C]0.225486[/C][/ROW]
[ROW][C]30[/C][C]-0.113546[/C][C]-0.9635[/C][C]0.169269[/C][/ROW]
[ROW][C]31[/C][C]-0.139883[/C][C]-1.1869[/C][C]0.119575[/C][/ROW]
[ROW][C]32[/C][C]-0.167849[/C][C]-1.4242[/C][C]0.079347[/C][/ROW]
[ROW][C]33[/C][C]-0.193118[/C][C]-1.6387[/C][C]0.052823[/C][/ROW]
[ROW][C]34[/C][C]-0.215846[/C][C]-1.8315[/C][C]0.03558[/C][/ROW]
[ROW][C]35[/C][C]-0.233579[/C][C]-1.982[/C][C]0.02565[/C][/ROW]
[ROW][C]36[/C][C]-0.252948[/C][C]-2.1463[/C][C]0.017608[/C][/ROW]
[ROW][C]37[/C][C]-0.27358[/C][C]-2.3214[/C][C]0.01155[/C][/ROW]
[ROW][C]38[/C][C]-0.295248[/C][C]-2.5053[/C][C]0.007249[/C][/ROW]
[ROW][C]39[/C][C]-0.311394[/C][C]-2.6423[/C][C]0.005048[/C][/ROW]
[ROW][C]40[/C][C]-0.324548[/C][C]-2.7539[/C][C]0.003725[/C][/ROW]
[ROW][C]41[/C][C]-0.335607[/C][C]-2.8477[/C][C]0.002867[/C][/ROW]
[ROW][C]42[/C][C]-0.347468[/C][C]-2.9484[/C][C]0.002152[/C][/ROW]
[ROW][C]43[/C][C]-0.360612[/C][C]-3.0599[/C][C]0.001555[/C][/ROW]
[ROW][C]44[/C][C]-0.373685[/C][C]-3.1708[/C][C]0.001117[/C][/ROW]
[ROW][C]45[/C][C]-0.385437[/C][C]-3.2705[/C][C]0.000824[/C][/ROW]
[ROW][C]46[/C][C]-0.394216[/C][C]-3.345[/C][C]0.000655[/C][/ROW]
[ROW][C]47[/C][C]-0.40313[/C][C]-3.4207[/C][C]0.000516[/C][/ROW]
[ROW][C]48[/C][C]-0.412068[/C][C]-3.4965[/C][C]0.000406[/C][/ROW]
[/TABLE]
Source: https://freestatistics.org/blog/index.php?pk=210694&T=1

Globally Unique Identifier (entire table): ba.freestatistics.org/blog/index.php?pk=210694&T=1

As an alternative you can also use a QR Code:  

The GUIDs for individual cells are displayed in the table below:

Autocorrelation Function
Time lag kACF(k)T-STATP-value
10.9649378.18780
20.9282527.87650
30.8875427.5310
40.8515057.22530
50.8151446.91670
60.7762816.5870
70.7345886.23320
80.6904585.85870
90.6478495.49720
100.6056455.13911e-06
110.5635794.78214e-06
120.5198134.41081.8e-05
130.4733694.01677.2e-05
140.4247993.60450.000286
150.3792173.21780.000969
160.334582.8390.002939
170.29422.49640.007419
180.2521092.13920.017905
190.206831.7550.041756
200.1612421.36820.087755
210.1234371.04740.14921
220.0941260.79870.213549
230.0679060.57620.283137
240.0422950.35890.360365
250.01480.12560.450207
26-0.013129-0.11140.455804
27-0.041057-0.34840.364284
28-0.065733-0.55780.289368
29-0.089322-0.75790.225486
30-0.113546-0.96350.169269
31-0.139883-1.18690.119575
32-0.167849-1.42420.079347
33-0.193118-1.63870.052823
34-0.215846-1.83150.03558
35-0.233579-1.9820.02565
36-0.252948-2.14630.017608
37-0.27358-2.32140.01155
38-0.295248-2.50530.007249
39-0.311394-2.64230.005048
40-0.324548-2.75390.003725
41-0.335607-2.84770.002867
42-0.347468-2.94840.002152
43-0.360612-3.05990.001555
44-0.373685-3.17080.001117
45-0.385437-3.27050.000824
46-0.394216-3.3450.000655
47-0.40313-3.42070.000516
48-0.412068-3.49650.000406


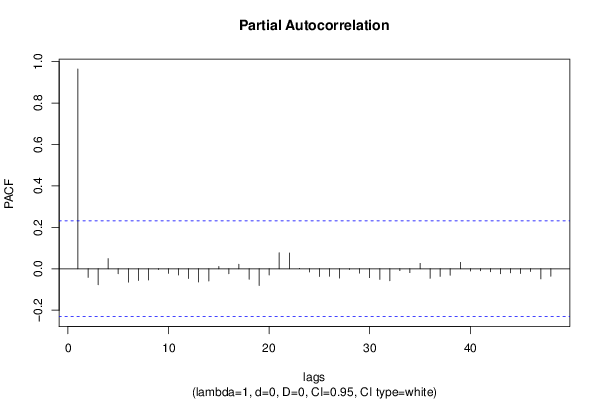
Partial Autocorrelation Function
Time lag kPACF(k)T-STATP-value
10.9649378.18780
2-0.041374-0.35110.36328
3-0.077041-0.65370.257689
40.049190.41740.338817
5-0.024073-0.20430.419362
6-0.064465-0.5470.293033
7-0.056452-0.4790.316692
8-0.054143-0.45940.323659
9-0.003334-0.02830.488755
10-0.022017-0.18680.426162
11-0.030114-0.25550.399522
12-0.046843-0.39750.346098
13-0.063458-0.53850.295959
14-0.058899-0.49980.309378
150.0114510.09720.461433
16-0.024267-0.20590.418721
170.022180.18820.425622
18-0.050247-0.42640.335559
19-0.080407-0.68230.248626
20-0.029709-0.25210.400845
210.0772820.65580.257035
220.0764110.64840.259405
230.0010530.00890.496448
24-0.015457-0.13120.448008
25-0.037062-0.31450.377033
26-0.03637-0.30860.379256
27-0.044877-0.38080.352238
28-0.003715-0.03150.487471
29-0.020969-0.17790.429638
30-0.042534-0.36090.359611
31-0.05098-0.43260.333307
32-0.057926-0.49150.312278
33-0.008825-0.07490.470257
34-0.018632-0.15810.437411
350.02620.22230.412348
36-0.046059-0.39080.348541
37-0.036747-0.31180.378042
38-0.031199-0.26470.395986
390.0310910.26380.396339
40-0.011028-0.09360.462854
41-0.0096-0.08150.467652
42-0.014198-0.12050.452223
43-0.024178-0.20520.419013
44-0.019526-0.16570.434435
45-0.022571-0.19150.424329
46-0.013081-0.1110.455964
47-0.048725-0.41340.340255
48-0.035808-0.30380.381063

\begin{tabular}{lllllllll}
\hline
Partial Autocorrelation Function \tabularnewline
Time lag k & PACF(k) & T-STAT & P-value \tabularnewline
1 & 0.964937 & 8.1878 & 0 \tabularnewline
2 & -0.041374 & -0.3511 & 0.36328 \tabularnewline
3 & -0.077041 & -0.6537 & 0.257689 \tabularnewline
4 & 0.04919 & 0.4174 & 0.338817 \tabularnewline
5 & -0.024073 & -0.2043 & 0.419362 \tabularnewline
6 & -0.064465 & -0.547 & 0.293033 \tabularnewline
7 & -0.056452 & -0.479 & 0.316692 \tabularnewline
8 & -0.054143 & -0.4594 & 0.323659 \tabularnewline
9 & -0.003334 & -0.0283 & 0.488755 \tabularnewline
10 & -0.022017 & -0.1868 & 0.426162 \tabularnewline
11 & -0.030114 & -0.2555 & 0.399522 \tabularnewline
12 & -0.046843 & -0.3975 & 0.346098 \tabularnewline
13 & -0.063458 & -0.5385 & 0.295959 \tabularnewline
14 & -0.058899 & -0.4998 & 0.309378 \tabularnewline
15 & 0.011451 & 0.0972 & 0.461433 \tabularnewline
16 & -0.024267 & -0.2059 & 0.418721 \tabularnewline
17 & 0.02218 & 0.1882 & 0.425622 \tabularnewline
18 & -0.050247 & -0.4264 & 0.335559 \tabularnewline
19 & -0.080407 & -0.6823 & 0.248626 \tabularnewline
20 & -0.029709 & -0.2521 & 0.400845 \tabularnewline
21 & 0.077282 & 0.6558 & 0.257035 \tabularnewline
22 & 0.076411 & 0.6484 & 0.259405 \tabularnewline
23 & 0.001053 & 0.0089 & 0.496448 \tabularnewline
24 & -0.015457 & -0.1312 & 0.448008 \tabularnewline
25 & -0.037062 & -0.3145 & 0.377033 \tabularnewline
26 & -0.03637 & -0.3086 & 0.379256 \tabularnewline
27 & -0.044877 & -0.3808 & 0.352238 \tabularnewline
28 & -0.003715 & -0.0315 & 0.487471 \tabularnewline
29 & -0.020969 & -0.1779 & 0.429638 \tabularnewline
30 & -0.042534 & -0.3609 & 0.359611 \tabularnewline
31 & -0.05098 & -0.4326 & 0.333307 \tabularnewline
32 & -0.057926 & -0.4915 & 0.312278 \tabularnewline
33 & -0.008825 & -0.0749 & 0.470257 \tabularnewline
34 & -0.018632 & -0.1581 & 0.437411 \tabularnewline
35 & 0.0262 & 0.2223 & 0.412348 \tabularnewline
36 & -0.046059 & -0.3908 & 0.348541 \tabularnewline
37 & -0.036747 & -0.3118 & 0.378042 \tabularnewline
38 & -0.031199 & -0.2647 & 0.395986 \tabularnewline
39 & 0.031091 & 0.2638 & 0.396339 \tabularnewline
40 & -0.011028 & -0.0936 & 0.462854 \tabularnewline
41 & -0.0096 & -0.0815 & 0.467652 \tabularnewline
42 & -0.014198 & -0.1205 & 0.452223 \tabularnewline
43 & -0.024178 & -0.2052 & 0.419013 \tabularnewline
44 & -0.019526 & -0.1657 & 0.434435 \tabularnewline
45 & -0.022571 & -0.1915 & 0.424329 \tabularnewline
46 & -0.013081 & -0.111 & 0.455964 \tabularnewline
47 & -0.048725 & -0.4134 & 0.340255 \tabularnewline
48 & -0.035808 & -0.3038 & 0.381063 \tabularnewline
\hline
\end{tabular}
%Source: https://freestatistics.org/blog/index.php?pk=210694&T=2

[TABLE]
[ROW][C]Partial Autocorrelation Function[/C][/ROW]
[ROW][C]Time lag k[/C][C]PACF(k)[/C][C]T-STAT[/C][C]P-value[/C][/ROW]
[ROW][C]1[/C][C]0.964937[/C][C]8.1878[/C][C]0[/C][/ROW]
[ROW][C]2[/C][C]-0.041374[/C][C]-0.3511[/C][C]0.36328[/C][/ROW]
[ROW][C]3[/C][C]-0.077041[/C][C]-0.6537[/C][C]0.257689[/C][/ROW]
[ROW][C]4[/C][C]0.04919[/C][C]0.4174[/C][C]0.338817[/C][/ROW]
[ROW][C]5[/C][C]-0.024073[/C][C]-0.2043[/C][C]0.419362[/C][/ROW]
[ROW][C]6[/C][C]-0.064465[/C][C]-0.547[/C][C]0.293033[/C][/ROW]
[ROW][C]7[/C][C]-0.056452[/C][C]-0.479[/C][C]0.316692[/C][/ROW]
[ROW][C]8[/C][C]-0.054143[/C][C]-0.4594[/C][C]0.323659[/C][/ROW]
[ROW][C]9[/C][C]-0.003334[/C][C]-0.0283[/C][C]0.488755[/C][/ROW]
[ROW][C]10[/C][C]-0.022017[/C][C]-0.1868[/C][C]0.426162[/C][/ROW]
[ROW][C]11[/C][C]-0.030114[/C][C]-0.2555[/C][C]0.399522[/C][/ROW]
[ROW][C]12[/C][C]-0.046843[/C][C]-0.3975[/C][C]0.346098[/C][/ROW]
[ROW][C]13[/C][C]-0.063458[/C][C]-0.5385[/C][C]0.295959[/C][/ROW]
[ROW][C]14[/C][C]-0.058899[/C][C]-0.4998[/C][C]0.309378[/C][/ROW]
[ROW][C]15[/C][C]0.011451[/C][C]0.0972[/C][C]0.461433[/C][/ROW]
[ROW][C]16[/C][C]-0.024267[/C][C]-0.2059[/C][C]0.418721[/C][/ROW]
[ROW][C]17[/C][C]0.02218[/C][C]0.1882[/C][C]0.425622[/C][/ROW]
[ROW][C]18[/C][C]-0.050247[/C][C]-0.4264[/C][C]0.335559[/C][/ROW]
[ROW][C]19[/C][C]-0.080407[/C][C]-0.6823[/C][C]0.248626[/C][/ROW]
[ROW][C]20[/C][C]-0.029709[/C][C]-0.2521[/C][C]0.400845[/C][/ROW]
[ROW][C]21[/C][C]0.077282[/C][C]0.6558[/C][C]0.257035[/C][/ROW]
[ROW][C]22[/C][C]0.076411[/C][C]0.6484[/C][C]0.259405[/C][/ROW]
[ROW][C]23[/C][C]0.001053[/C][C]0.0089[/C][C]0.496448[/C][/ROW]
[ROW][C]24[/C][C]-0.015457[/C][C]-0.1312[/C][C]0.448008[/C][/ROW]
[ROW][C]25[/C][C]-0.037062[/C][C]-0.3145[/C][C]0.377033[/C][/ROW]
[ROW][C]26[/C][C]-0.03637[/C][C]-0.3086[/C][C]0.379256[/C][/ROW]
[ROW][C]27[/C][C]-0.044877[/C][C]-0.3808[/C][C]0.352238[/C][/ROW]
[ROW][C]28[/C][C]-0.003715[/C][C]-0.0315[/C][C]0.487471[/C][/ROW]
[ROW][C]29[/C][C]-0.020969[/C][C]-0.1779[/C][C]0.429638[/C][/ROW]
[ROW][C]30[/C][C]-0.042534[/C][C]-0.3609[/C][C]0.359611[/C][/ROW]
[ROW][C]31[/C][C]-0.05098[/C][C]-0.4326[/C][C]0.333307[/C][/ROW]
[ROW][C]32[/C][C]-0.057926[/C][C]-0.4915[/C][C]0.312278[/C][/ROW]
[ROW][C]33[/C][C]-0.008825[/C][C]-0.0749[/C][C]0.470257[/C][/ROW]
[ROW][C]34[/C][C]-0.018632[/C][C]-0.1581[/C][C]0.437411[/C][/ROW]
[ROW][C]35[/C][C]0.0262[/C][C]0.2223[/C][C]0.412348[/C][/ROW]
[ROW][C]36[/C][C]-0.046059[/C][C]-0.3908[/C][C]0.348541[/C][/ROW]
[ROW][C]37[/C][C]-0.036747[/C][C]-0.3118[/C][C]0.378042[/C][/ROW]
[ROW][C]38[/C][C]-0.031199[/C][C]-0.2647[/C][C]0.395986[/C][/ROW]
[ROW][C]39[/C][C]0.031091[/C][C]0.2638[/C][C]0.396339[/C][/ROW]
[ROW][C]40[/C][C]-0.011028[/C][C]-0.0936[/C][C]0.462854[/C][/ROW]
[ROW][C]41[/C][C]-0.0096[/C][C]-0.0815[/C][C]0.467652[/C][/ROW]
[ROW][C]42[/C][C]-0.014198[/C][C]-0.1205[/C][C]0.452223[/C][/ROW]
[ROW][C]43[/C][C]-0.024178[/C][C]-0.2052[/C][C]0.419013[/C][/ROW]
[ROW][C]44[/C][C]-0.019526[/C][C]-0.1657[/C][C]0.434435[/C][/ROW]
[ROW][C]45[/C][C]-0.022571[/C][C]-0.1915[/C][C]0.424329[/C][/ROW]
[ROW][C]46[/C][C]-0.013081[/C][C]-0.111[/C][C]0.455964[/C][/ROW]
[ROW][C]47[/C][C]-0.048725[/C][C]-0.4134[/C][C]0.340255[/C][/ROW]
[ROW][C]48[/C][C]-0.035808[/C][C]-0.3038[/C][C]0.381063[/C][/ROW]
[/TABLE]
Source: https://freestatistics.org/blog/index.php?pk=210694&T=2

Globally Unique Identifier (entire table): ba.freestatistics.org/blog/index.php?pk=210694&T=2

As an alternative you can also use a QR Code:  

The GUIDs for individual cells are displayed in the table below:

Partial Autocorrelation Function
Time lag kPACF(k)T-STATP-value
10.9649378.18780
2-0.041374-0.35110.36328
3-0.077041-0.65370.257689
40.049190.41740.338817
5-0.024073-0.20430.419362
6-0.064465-0.5470.293033
7-0.056452-0.4790.316692
8-0.054143-0.45940.323659
9-0.003334-0.02830.488755
10-0.022017-0.18680.426162
11-0.030114-0.25550.399522
12-0.046843-0.39750.346098
13-0.063458-0.53850.295959
14-0.058899-0.49980.309378
150.0114510.09720.461433
16-0.024267-0.20590.418721
170.022180.18820.425622
18-0.050247-0.42640.335559
19-0.080407-0.68230.248626
20-0.029709-0.25210.400845
210.0772820.65580.257035
220.0764110.64840.259405
230.0010530.00890.496448
24-0.015457-0.13120.448008
25-0.037062-0.31450.377033
26-0.03637-0.30860.379256
27-0.044877-0.38080.352238
28-0.003715-0.03150.487471
29-0.020969-0.17790.429638
30-0.042534-0.36090.359611
31-0.05098-0.43260.333307
32-0.057926-0.49150.312278
33-0.008825-0.07490.470257
34-0.018632-0.15810.437411
350.02620.22230.412348
36-0.046059-0.39080.348541
37-0.036747-0.31180.378042
38-0.031199-0.26470.395986
390.0310910.26380.396339
40-0.011028-0.09360.462854
41-0.0096-0.08150.467652
42-0.014198-0.12050.452223
43-0.024178-0.20520.419013
44-0.019526-0.16570.434435
45-0.022571-0.19150.424329
46-0.013081-0.1110.455964
47-0.048725-0.41340.340255
48-0.035808-0.30380.381063


Parameters (Session):
par1 = 48 ; par2 = 1 ; par3 = 0 ; par4 = 0 ; par5 = 12 ; par6 = White Noise ; par7 = 0.95 ;
Parameters (R input):
par1 = 48 ; par2 = 1 ; par3 = 0 ; par4 = 0 ; par5 = 12 ; par6 = White Noise ; par7 = 0.95 ; par8 = ;
R code (references can be found in the software module):
if (par1 == 'Default') {
par1 = 10*log10(length(x))
} else {
par1 <- as.numeric(par1)
}
par2 <- as.numeric(par2)
par3 <- as.numeric(par3)
par4 <- as.numeric(par4)
par5 <- as.numeric(par5)
if (par6 == 'White Noise') par6 <- 'white' else par6 <- 'ma'
par7 <- as.numeric(par7)
if (par8 != '') par8 <- as.numeric(par8)
ox <- x
if (par8 == '') {
if (par2 == 0) {
x <- log(x)
} else {
x <- (x ^ par2 - 1) / par2
}
} else {
x <- log(x,base=par8)
}
if (par3 > 0) x <- diff(x,lag=1,difference=par3)
if (par4 > 0) x <- diff(x,lag=par5,difference=par4)
bitmap(file='picts.png')
op <- par(mfrow=c(2,1))
plot(ox,type='l',main='Original Time Series',xlab='time',ylab='value')
if (par8=='') {
mytitle <- paste('Working Time Series (lambda=',par2,', d=',par3,', D=',par4,')',sep='')
mysub <- paste('(lambda=',par2,', d=',par3,', D=',par4,', CI=', par7, ', CI type=',par6,')',sep='')
} else {
mytitle <- paste('Working Time Series (base=',par8,', d=',par3,', D=',par4,')',sep='')
mysub <- paste('(base=',par8,', d=',par3,', D=',par4,', CI=', par7, ', CI type=',par6,')',sep='')
}
plot(x,type='l', main=mytitle,xlab='time',ylab='value')
par(op)
dev.off()
bitmap(file='pic1.png')
racf <- acf(x, par1, main='Autocorrelation', xlab='time lag', ylab='ACF', ci.type=par6, ci=par7, sub=mysub)
dev.off()
bitmap(file='pic2.png')
rpacf <- pacf(x,par1,main='Partial Autocorrelation',xlab='lags',ylab='PACF',sub=mysub)
dev.off()
(myacf <- c(racf$acf))
(mypacf <- c(rpacf$acf))
lengthx <- length(x)
sqrtn <- sqrt(lengthx)
load(file='createtable')
a<-table.start()
a<-table.row.start(a)
a<-table.element(a,'Autocorrelation Function',4,TRUE)
a<-table.row.end(a)
a<-table.row.start(a)
a<-table.element(a,'Time lag k',header=TRUE)
a<-table.element(a,hyperlink('basics.htm','ACF(k)','click here for more information about the Autocorrelation Function'),header=TRUE)
a<-table.element(a,'T-STAT',header=TRUE)
a<-table.element(a,'P-value',header=TRUE)
a<-table.row.end(a)
for (i in 2:(par1+1)) {
a<-table.row.start(a)
a<-table.element(a,i-1,header=TRUE)
a<-table.element(a,round(myacf[i],6))
mytstat <- myacf[i]*sqrtn
a<-table.element(a,round(mytstat,4))
a<-table.element(a,round(1-pt(abs(mytstat),lengthx),6))
a<-table.row.end(a)
}
a<-table.end(a)
table.save(a,file='mytable.tab')
a<-table.start()
a<-table.row.start(a)
a<-table.element(a,'Partial Autocorrelation Function',4,TRUE)
a<-table.row.end(a)
a<-table.row.start(a)
a<-table.element(a,'Time lag k',header=TRUE)
a<-table.element(a,hyperlink('basics.htm','PACF(k)','click here for more information about the Partial Autocorrelation Function'),header=TRUE)
a<-table.element(a,'T-STAT',header=TRUE)
a<-table.element(a,'P-value',header=TRUE)
a<-table.row.end(a)
for (i in 1:par1) {
a<-table.row.start(a)
a<-table.element(a,i,header=TRUE)
a<-table.element(a,round(mypacf[i],6))
mytstat <- mypacf[i]*sqrtn
a<-table.element(a,round(mytstat,4))
a<-table.element(a,round(1-pt(abs(mytstat),lengthx),6))
a<-table.row.end(a)
}
a<-table.end(a)
table.save(a,file='mytable1.tab')