Free Statistics

of Irreproducible Research!

Author's title

Author*The author of this computation has been verified*
R Software Modulerwasp_Tests to Compare Two Means.wasp
Title produced by softwareT-Tests
Date of computationMon, 18 Mar 2013 15:20:04 -0400
Cite this page as followsStatistical Computations at FreeStatistics.org, Office for Research Development and Education, URL https://freestatistics.org/blog/index.php?v=date/2013/Mar/18/t1363634900zcma7oinzca8mn7.htm/, Retrieved Sat, 27 Apr 2024 09:46:55 +0000
Statistical Computations at FreeStatistics.org, Office for Research Development and Education, URL https://freestatistics.org/blog/index.php?pk=207866, Retrieved Sat, 27 Apr 2024 09:46:55 +0000
QR Codes:

Original text written by user:
IsPrivate?No (this computation is public)
User-defined keywords
Estimated Impact164
Family? (F = Feedback message, R = changed R code, M = changed R Module, P = changed Parameters, D = changed Data)
-       [T-Tests] [] [2013-03-18 19:20:04] [80fa07db41e661353ef083169e826f3b] [Current]
Feedback Forum

Post a new message
Dataseries X:
881	1866
947	949
986	849
2790	651
666	621
758	839
1122	634
1270	603
1422	1083
1469	1335
678	953
1261	1040
673	505
660	716
768	677
1078	1922
2284	877
745	724
806	931
755	726
681	543
1175	852
861	535
574	957
762	675
718	646
523	597
667	776
619	679
685	629
750	1237
711	732
712	597
845	720
1177	1309
957	722


Summary of computational transaction
Raw Inputview raw input (R code)
Raw Outputview raw output of R engine
Computing time1 seconds
R Server'George Udny Yule' @ yule.wessa.net

\begin{tabular}{lllllllll}
\hline
Summary of computational transaction \tabularnewline
Raw Input & view raw input (R code)  \tabularnewline
Raw Output & view raw output of R engine  \tabularnewline
Computing time & 1 seconds \tabularnewline
R Server & 'George Udny Yule' @ yule.wessa.net \tabularnewline
\hline
\end{tabular}
%Source: https://freestatistics.org/blog/index.php?pk=207866&T=0

[TABLE]
[ROW][C]Summary of computational transaction[/C][/ROW]
[ROW][C]Raw Input[/C][C]view raw input (R code) [/C][/ROW]
[ROW][C]Raw Output[/C][C]view raw output of R engine [/C][/ROW]
[ROW][C]Computing time[/C][C]1 seconds[/C][/ROW]
[ROW][C]R Server[/C][C]'George Udny Yule' @ yule.wessa.net[/C][/ROW]
[/TABLE]
Source: https://freestatistics.org/blog/index.php?pk=207866&T=0

Globally Unique Identifier (entire table): ba.freestatistics.org/blog/index.php?pk=207866&T=0

As an alternative you can also use a QR Code:  

The GUIDs for individual cells are displayed in the table below:

Summary of computational transaction
Raw Inputview raw input (R code)
Raw Outputview raw output of R engine
Computing time1 seconds
R Server'George Udny Yule' @ yule.wessa.net


Wilcoxon Test
StatisticP-value
Wilcoxon Test427.50.13971

\begin{tabular}{lllllllll}
\hline
Wilcoxon Test \tabularnewline
 & Statistic & P-value \tabularnewline
Wilcoxon Test & 427.5 & 0.13971 \tabularnewline
\hline
\end{tabular}
%Source: https://freestatistics.org/blog/index.php?pk=207866&T=1

[TABLE]
[ROW][C]Wilcoxon Test[/C][/ROW]
[ROW][C][/C][C]Statistic[/C][C]P-value[/C][/ROW]
[ROW][C]Wilcoxon Test[/C][C]427.5[/C][C]0.13971[/C][/ROW]
[/TABLE]
Source: https://freestatistics.org/blog/index.php?pk=207866&T=1

Globally Unique Identifier (entire table): ba.freestatistics.org/blog/index.php?pk=207866&T=1

As an alternative you can also use a QR Code:  

The GUIDs for individual cells are displayed in the table below:

Wilcoxon Test
StatisticP-value
Wilcoxon Test427.50.13971


Standard Deviations
Variable 1460.22277
Variable 2330.74932

\begin{tabular}{lllllllll}
\hline
Standard Deviations \tabularnewline
Variable 1 & 460.22277 \tabularnewline
Variable 2 & 330.74932 \tabularnewline
\hline
\end{tabular}
%Source: https://freestatistics.org/blog/index.php?pk=207866&T=2

[TABLE]
[ROW][C]Standard Deviations[/C][/ROW]
[ROW][C]Variable 1[/C][C]460.22277[/C][/ROW]
[ROW][C]Variable 2[/C][C]330.74932[/C][/ROW]
[/TABLE]
Source: https://freestatistics.org/blog/index.php?pk=207866&T=2

Globally Unique Identifier (entire table): ba.freestatistics.org/blog/index.php?pk=207866&T=2

As an alternative you can also use a QR Code:  

The GUIDs for individual cells are displayed in the table below:

Standard Deviations
Variable 1460.22277
Variable 2330.74932


Parameters (Session):
par1 = two.sided ; par2 = 1 ; par3 = 2 ; par4 = Wilcoxon-Mann_Whitney ; par5 = paired ; par6 = 0.0 ; par7 = 0.95 ; par8 = TRUE ;
Parameters (R input):
par1 = two.sided ; par2 = 1 ; par3 = 2 ; par4 = Wilcoxon-Mann_Whitney ; par5 = paired ; par6 = 0.0 ; par7 = 0.95 ; par8 = TRUE ;
R code (references can be found in the software module):
par2 <- as.numeric(par2)
par3 <- as.numeric(par3)
par4 <- as.character(par4)
par5 <- as.character(par5)
par6 <- as.numeric(par6)
par7 <- as.numeric(par7)
par8 <- as.logical(par8)
if ( par5 == 'unpaired') paired <- FALSE else paired <- TRUE
x <- t(y)
if(par8){
bitmap(file='test1.png')
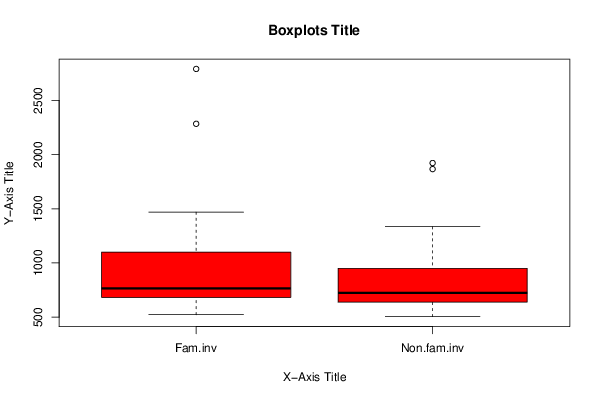
(r<-boxplot(x ,xlab=xlab,ylab=ylab,main=main,notch=FALSE,col=2))
dev.off()
}
load(file='createtable')
if( par4 == 'Wilcoxon-Mann_Whitney'){
a<-table.start()
a <- table.row.start(a)
a <- table.element(a,'Wilcoxon Test',3,TRUE)
a <- table.row.end(a)
a <- table.row.start(a)
a <- table.element(a,'',1,TRUE)
a <- table.element(a,'Statistic',1,TRUE)
a <- table.element(a,'P-value',1,TRUE)
a <- table.row.end(a)
W <- wilcox.test(x[,par2],x[,par3],alternative=par1, paired = paired)
a<-table.row.start(a)
a<-table.element(a,'Wilcoxon Test',1,TRUE)
a<-table.element(a,W$statistic[[1]])
a<-table.element(a,round(W$p.value, digits=5) )
a<-table.row.end(a)
a<-table.end(a)
table.save(a,file='mytable.tab')
}
if( par4 == 'T-Test')
{
T <- t.test(x[,par2],x[,par3],alternative=par1, paired=paired, mu=par6, conf.level=par7)
a<-table.start()
a <- table.row.start(a)
a <- table.element(a,'T-Test',3,TRUE)
a <- table.row.end(a)
if(paired){
a <- table.row.start(a)
a <- table.element(a,'Difference: Mean1 - Mean2',1,TRUE)
a<-table.element(a,round(T$estimate, digits=5) )
a <- table.row.end(a)
}
if(!paired){
a <- table.row.start(a)
a <- table.element(a,'Mean1',1,TRUE)
a<-table.element(a,round(T$estimate[1], digits=5) )
a <- table.row.end(a)
a <- table.row.start(a)
a <- table.element(a,'Mean2',1,TRUE)
a<-table.element(a,round(T$estimate[2], digits=5) )
a <- table.row.end(a)
}
a <- table.row.start(a)
a <- table.element(a,'T Statistic',1,TRUE)
a<-table.element(a,round(T$statistic, digits=5) )
a <- table.row.end(a)
a <- table.row.start(a)
a <- table.element(a,'P-value',1,TRUE)
a<-table.element(a,round(T$p.value, digits=5) )
a <- table.row.end(a)
a <- table.row.start(a)
a <- table.element(a,'Lower Confidence Limit',1,TRUE)
a<-table.element(a,round(T$conf.int[1], digits=5) )
a <- table.row.end(a)
a<-table.row.start(a)
a <- table.element(a,'Upper Confidence Limit',1,TRUE)
a<-table.element(a,round(T$conf.int[2], digits=5) )
a <- table.row.end(a)
a<-table.end(a)
table.save(a,file='mytable.tab')
}
a<-table.start()
a <- table.row.start(a)
a <- table.element(a,'Standard Deviations',3,TRUE)
a <- table.row.end(a)
a <- table.row.start(a)
a <- table.element(a,'Variable 1',1,TRUE)
a<-table.element(a,round(sd(x[,par2], na.rm=TRUE), digits=5) )
a <- table.row.end(a)
a <- table.row.start(a)
a <- table.element(a,'Variable 2',1,TRUE)
a<-table.element(a,round(sd(x[,par3], na.rm=TRUE), digits=5) )
a <- table.row.end(a)
a<-table.end(a)
table.save(a,file='mytable1.tab')