Free Statistics

of Irreproducible Research!

Author's title

Author*Unverified author*
R Software Modulerwasp_autocorrelation.wasp
Title produced by software(Partial) Autocorrelation Function
Date of computationMon, 18 Mar 2013 12:32:55 -0400
Cite this page as followsStatistical Computations at FreeStatistics.org, Office for Research Development and Education, URL https://freestatistics.org/blog/index.php?v=date/2013/Mar/18/t1363624431k7kcsy1g7wh26wc.htm/, Retrieved Sat, 27 Apr 2024 05:43:31 +0000
Statistical Computations at FreeStatistics.org, Office for Research Development and Education, URL https://freestatistics.org/blog/index.php?pk=207860, Retrieved Sat, 27 Apr 2024 05:43:31 +0000
QR Codes:

Original text written by user:
IsPrivate?No (this computation is public)
User-defined keywords
Estimated Impact159
Family? (F = Feedback message, R = changed R code, M = changed R Module, P = changed Parameters, D = changed Data)
-       [(Partial) Autocorrelation Function] [] [2013-03-18 16:32:55] [a20b39b66cdf12df5e07217cd6d70728] [Current]
Feedback Forum

Post a new message
Dataseries X:
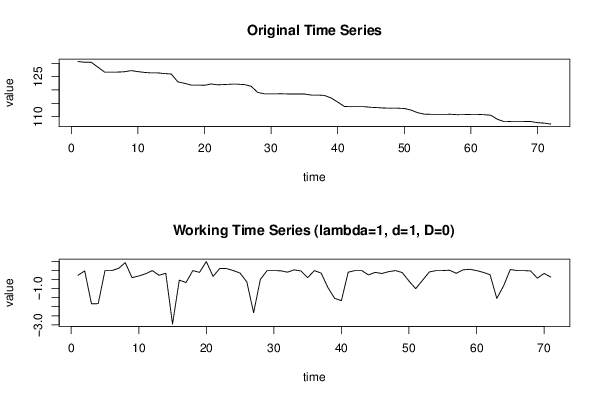
130,65
130,39
130,37
128,53
126,7
126,7
126,7
126,82
127,26
126,87
126,57
126,39
126,39
126,13
125,98
123,02
122,49
121,83
121,83
121,73
122,23
121,91
122,03
122,14
122,14
122
121,37
119,04
118,55
118,55
118,55
118,54
118,45
118,49
118,47
118,08
118,08
117,94
117
115,46
113,8
113,71
113,71
113,71
113,47
113,37
113,21
113,15
113,15
113,04
112,46
111,46
110,92
110,84
110,84
110,84
110,86
110,71
110,75
110,82
110,82
110,72
110,49
108,95
108,1
108,16
108,16
108,16
108,14
107,72
107,56
107,2


Summary of computational transaction
Raw Inputview raw input (R code)
Raw Outputview raw output of R engine
Computing time2 seconds
R Server'Gertrude Mary Cox' @ cox.wessa.net

\begin{tabular}{lllllllll}
\hline
Summary of computational transaction \tabularnewline
Raw Input & view raw input (R code)  \tabularnewline
Raw Output & view raw output of R engine  \tabularnewline
Computing time & 2 seconds \tabularnewline
R Server & 'Gertrude Mary Cox' @ cox.wessa.net \tabularnewline
\hline
\end{tabular}
%Source: https://freestatistics.org/blog/index.php?pk=207860&T=0

[TABLE]
[ROW][C]Summary of computational transaction[/C][/ROW]
[ROW][C]Raw Input[/C][C]view raw input (R code) [/C][/ROW]
[ROW][C]Raw Output[/C][C]view raw output of R engine [/C][/ROW]
[ROW][C]Computing time[/C][C]2 seconds[/C][/ROW]
[ROW][C]R Server[/C][C]'Gertrude Mary Cox' @ cox.wessa.net[/C][/ROW]
[/TABLE]
Source: https://freestatistics.org/blog/index.php?pk=207860&T=0

Globally Unique Identifier (entire table): ba.freestatistics.org/blog/index.php?pk=207860&T=0

As an alternative you can also use a QR Code:  

The GUIDs for individual cells are displayed in the table below:

Summary of computational transaction
Raw Inputview raw input (R code)
Raw Outputview raw output of R engine
Computing time2 seconds
R Server'Gertrude Mary Cox' @ cox.wessa.net


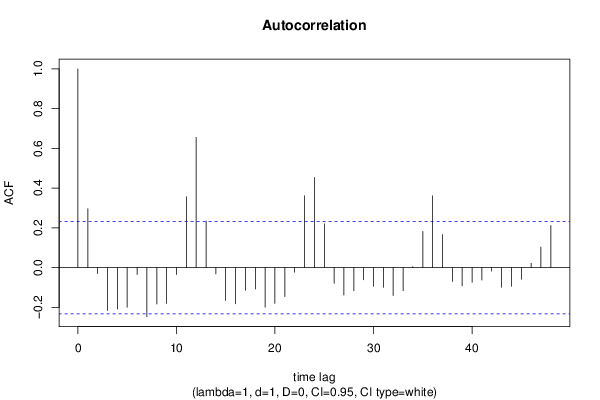
Autocorrelation Function
Time lag kACF(k)T-STATP-value
10.2959222.49350.007491
2-0.02946-0.24820.402335
3-0.216377-1.82320.036239
4-0.208875-1.760.041357
5-0.199358-1.67980.048694
6-0.034994-0.29490.384479
7-0.24704-2.08160.020493
8-0.183224-1.54390.063533
9-0.180238-1.51870.066638
10-0.03462-0.29170.385678
110.3562723.0020.00185
120.6554385.52280
130.2343431.97460.026101
14-0.031706-0.26720.39506
15-0.165695-1.39620.083507
16-0.182167-1.5350.064618
17-0.113794-0.95880.170446
18-0.107482-0.90570.184089
19-0.199289-1.67920.048751
20-0.180048-1.51710.066839
21-0.145237-1.22380.112538
22-0.023052-0.19420.423271
230.3619853.05010.001607
240.4535363.82160.000141
250.220111.85470.033897
26-0.078887-0.66470.254193
27-0.137818-1.16130.124709
28-0.116833-0.98450.164118
29-0.061077-0.51460.304199
30-0.094679-0.79780.213828
31-0.098881-0.83320.203766
32-0.14065-1.18510.119957
33-0.116067-0.9780.165697
340.0046890.03950.484298
350.1814581.5290.065355
360.3611653.04320.00164
370.1661181.39970.082973
38-0.070179-0.59130.278085
39-0.092186-0.77680.219936
40-0.074067-0.62410.267282
41-0.062213-0.52420.300882
42-0.017297-0.14570.442268
43-0.099374-0.83730.202605
44-0.094161-0.79340.215091
45-0.058421-0.49230.312025
460.0217360.18310.427602
470.1028890.8670.194444
480.2121961.7880.039022

\begin{tabular}{lllllllll}
\hline
Autocorrelation Function \tabularnewline
Time lag k & ACF(k) & T-STAT & P-value \tabularnewline
1 & 0.295922 & 2.4935 & 0.007491 \tabularnewline
2 & -0.02946 & -0.2482 & 0.402335 \tabularnewline
3 & -0.216377 & -1.8232 & 0.036239 \tabularnewline
4 & -0.208875 & -1.76 & 0.041357 \tabularnewline
5 & -0.199358 & -1.6798 & 0.048694 \tabularnewline
6 & -0.034994 & -0.2949 & 0.384479 \tabularnewline
7 & -0.24704 & -2.0816 & 0.020493 \tabularnewline
8 & -0.183224 & -1.5439 & 0.063533 \tabularnewline
9 & -0.180238 & -1.5187 & 0.066638 \tabularnewline
10 & -0.03462 & -0.2917 & 0.385678 \tabularnewline
11 & 0.356272 & 3.002 & 0.00185 \tabularnewline
12 & 0.655438 & 5.5228 & 0 \tabularnewline
13 & 0.234343 & 1.9746 & 0.026101 \tabularnewline
14 & -0.031706 & -0.2672 & 0.39506 \tabularnewline
15 & -0.165695 & -1.3962 & 0.083507 \tabularnewline
16 & -0.182167 & -1.535 & 0.064618 \tabularnewline
17 & -0.113794 & -0.9588 & 0.170446 \tabularnewline
18 & -0.107482 & -0.9057 & 0.184089 \tabularnewline
19 & -0.199289 & -1.6792 & 0.048751 \tabularnewline
20 & -0.180048 & -1.5171 & 0.066839 \tabularnewline
21 & -0.145237 & -1.2238 & 0.112538 \tabularnewline
22 & -0.023052 & -0.1942 & 0.423271 \tabularnewline
23 & 0.361985 & 3.0501 & 0.001607 \tabularnewline
24 & 0.453536 & 3.8216 & 0.000141 \tabularnewline
25 & 0.22011 & 1.8547 & 0.033897 \tabularnewline
26 & -0.078887 & -0.6647 & 0.254193 \tabularnewline
27 & -0.137818 & -1.1613 & 0.124709 \tabularnewline
28 & -0.116833 & -0.9845 & 0.164118 \tabularnewline
29 & -0.061077 & -0.5146 & 0.304199 \tabularnewline
30 & -0.094679 & -0.7978 & 0.213828 \tabularnewline
31 & -0.098881 & -0.8332 & 0.203766 \tabularnewline
32 & -0.14065 & -1.1851 & 0.119957 \tabularnewline
33 & -0.116067 & -0.978 & 0.165697 \tabularnewline
34 & 0.004689 & 0.0395 & 0.484298 \tabularnewline
35 & 0.181458 & 1.529 & 0.065355 \tabularnewline
36 & 0.361165 & 3.0432 & 0.00164 \tabularnewline
37 & 0.166118 & 1.3997 & 0.082973 \tabularnewline
38 & -0.070179 & -0.5913 & 0.278085 \tabularnewline
39 & -0.092186 & -0.7768 & 0.219936 \tabularnewline
40 & -0.074067 & -0.6241 & 0.267282 \tabularnewline
41 & -0.062213 & -0.5242 & 0.300882 \tabularnewline
42 & -0.017297 & -0.1457 & 0.442268 \tabularnewline
43 & -0.099374 & -0.8373 & 0.202605 \tabularnewline
44 & -0.094161 & -0.7934 & 0.215091 \tabularnewline
45 & -0.058421 & -0.4923 & 0.312025 \tabularnewline
46 & 0.021736 & 0.1831 & 0.427602 \tabularnewline
47 & 0.102889 & 0.867 & 0.194444 \tabularnewline
48 & 0.212196 & 1.788 & 0.039022 \tabularnewline
\hline
\end{tabular}
%Source: https://freestatistics.org/blog/index.php?pk=207860&T=1

[TABLE]
[ROW][C]Autocorrelation Function[/C][/ROW]
[ROW][C]Time lag k[/C][C]ACF(k)[/C][C]T-STAT[/C][C]P-value[/C][/ROW]
[ROW][C]1[/C][C]0.295922[/C][C]2.4935[/C][C]0.007491[/C][/ROW]
[ROW][C]2[/C][C]-0.02946[/C][C]-0.2482[/C][C]0.402335[/C][/ROW]
[ROW][C]3[/C][C]-0.216377[/C][C]-1.8232[/C][C]0.036239[/C][/ROW]
[ROW][C]4[/C][C]-0.208875[/C][C]-1.76[/C][C]0.041357[/C][/ROW]
[ROW][C]5[/C][C]-0.199358[/C][C]-1.6798[/C][C]0.048694[/C][/ROW]
[ROW][C]6[/C][C]-0.034994[/C][C]-0.2949[/C][C]0.384479[/C][/ROW]
[ROW][C]7[/C][C]-0.24704[/C][C]-2.0816[/C][C]0.020493[/C][/ROW]
[ROW][C]8[/C][C]-0.183224[/C][C]-1.5439[/C][C]0.063533[/C][/ROW]
[ROW][C]9[/C][C]-0.180238[/C][C]-1.5187[/C][C]0.066638[/C][/ROW]
[ROW][C]10[/C][C]-0.03462[/C][C]-0.2917[/C][C]0.385678[/C][/ROW]
[ROW][C]11[/C][C]0.356272[/C][C]3.002[/C][C]0.00185[/C][/ROW]
[ROW][C]12[/C][C]0.655438[/C][C]5.5228[/C][C]0[/C][/ROW]
[ROW][C]13[/C][C]0.234343[/C][C]1.9746[/C][C]0.026101[/C][/ROW]
[ROW][C]14[/C][C]-0.031706[/C][C]-0.2672[/C][C]0.39506[/C][/ROW]
[ROW][C]15[/C][C]-0.165695[/C][C]-1.3962[/C][C]0.083507[/C][/ROW]
[ROW][C]16[/C][C]-0.182167[/C][C]-1.535[/C][C]0.064618[/C][/ROW]
[ROW][C]17[/C][C]-0.113794[/C][C]-0.9588[/C][C]0.170446[/C][/ROW]
[ROW][C]18[/C][C]-0.107482[/C][C]-0.9057[/C][C]0.184089[/C][/ROW]
[ROW][C]19[/C][C]-0.199289[/C][C]-1.6792[/C][C]0.048751[/C][/ROW]
[ROW][C]20[/C][C]-0.180048[/C][C]-1.5171[/C][C]0.066839[/C][/ROW]
[ROW][C]21[/C][C]-0.145237[/C][C]-1.2238[/C][C]0.112538[/C][/ROW]
[ROW][C]22[/C][C]-0.023052[/C][C]-0.1942[/C][C]0.423271[/C][/ROW]
[ROW][C]23[/C][C]0.361985[/C][C]3.0501[/C][C]0.001607[/C][/ROW]
[ROW][C]24[/C][C]0.453536[/C][C]3.8216[/C][C]0.000141[/C][/ROW]
[ROW][C]25[/C][C]0.22011[/C][C]1.8547[/C][C]0.033897[/C][/ROW]
[ROW][C]26[/C][C]-0.078887[/C][C]-0.6647[/C][C]0.254193[/C][/ROW]
[ROW][C]27[/C][C]-0.137818[/C][C]-1.1613[/C][C]0.124709[/C][/ROW]
[ROW][C]28[/C][C]-0.116833[/C][C]-0.9845[/C][C]0.164118[/C][/ROW]
[ROW][C]29[/C][C]-0.061077[/C][C]-0.5146[/C][C]0.304199[/C][/ROW]
[ROW][C]30[/C][C]-0.094679[/C][C]-0.7978[/C][C]0.213828[/C][/ROW]
[ROW][C]31[/C][C]-0.098881[/C][C]-0.8332[/C][C]0.203766[/C][/ROW]
[ROW][C]32[/C][C]-0.14065[/C][C]-1.1851[/C][C]0.119957[/C][/ROW]
[ROW][C]33[/C][C]-0.116067[/C][C]-0.978[/C][C]0.165697[/C][/ROW]
[ROW][C]34[/C][C]0.004689[/C][C]0.0395[/C][C]0.484298[/C][/ROW]
[ROW][C]35[/C][C]0.181458[/C][C]1.529[/C][C]0.065355[/C][/ROW]
[ROW][C]36[/C][C]0.361165[/C][C]3.0432[/C][C]0.00164[/C][/ROW]
[ROW][C]37[/C][C]0.166118[/C][C]1.3997[/C][C]0.082973[/C][/ROW]
[ROW][C]38[/C][C]-0.070179[/C][C]-0.5913[/C][C]0.278085[/C][/ROW]
[ROW][C]39[/C][C]-0.092186[/C][C]-0.7768[/C][C]0.219936[/C][/ROW]
[ROW][C]40[/C][C]-0.074067[/C][C]-0.6241[/C][C]0.267282[/C][/ROW]
[ROW][C]41[/C][C]-0.062213[/C][C]-0.5242[/C][C]0.300882[/C][/ROW]
[ROW][C]42[/C][C]-0.017297[/C][C]-0.1457[/C][C]0.442268[/C][/ROW]
[ROW][C]43[/C][C]-0.099374[/C][C]-0.8373[/C][C]0.202605[/C][/ROW]
[ROW][C]44[/C][C]-0.094161[/C][C]-0.7934[/C][C]0.215091[/C][/ROW]
[ROW][C]45[/C][C]-0.058421[/C][C]-0.4923[/C][C]0.312025[/C][/ROW]
[ROW][C]46[/C][C]0.021736[/C][C]0.1831[/C][C]0.427602[/C][/ROW]
[ROW][C]47[/C][C]0.102889[/C][C]0.867[/C][C]0.194444[/C][/ROW]
[ROW][C]48[/C][C]0.212196[/C][C]1.788[/C][C]0.039022[/C][/ROW]
[/TABLE]
Source: https://freestatistics.org/blog/index.php?pk=207860&T=1

Globally Unique Identifier (entire table): ba.freestatistics.org/blog/index.php?pk=207860&T=1

As an alternative you can also use a QR Code:  

The GUIDs for individual cells are displayed in the table below:

Autocorrelation Function
Time lag kACF(k)T-STATP-value
10.2959222.49350.007491
2-0.02946-0.24820.402335
3-0.216377-1.82320.036239
4-0.208875-1.760.041357
5-0.199358-1.67980.048694
6-0.034994-0.29490.384479
7-0.24704-2.08160.020493
8-0.183224-1.54390.063533
9-0.180238-1.51870.066638
10-0.03462-0.29170.385678
110.3562723.0020.00185
120.6554385.52280
130.2343431.97460.026101
14-0.031706-0.26720.39506
15-0.165695-1.39620.083507
16-0.182167-1.5350.064618
17-0.113794-0.95880.170446
18-0.107482-0.90570.184089
19-0.199289-1.67920.048751
20-0.180048-1.51710.066839
21-0.145237-1.22380.112538
22-0.023052-0.19420.423271
230.3619853.05010.001607
240.4535363.82160.000141
250.220111.85470.033897
26-0.078887-0.66470.254193
27-0.137818-1.16130.124709
28-0.116833-0.98450.164118
29-0.061077-0.51460.304199
30-0.094679-0.79780.213828
31-0.098881-0.83320.203766
32-0.14065-1.18510.119957
33-0.116067-0.9780.165697
340.0046890.03950.484298
350.1814581.5290.065355
360.3611653.04320.00164
370.1661181.39970.082973
38-0.070179-0.59130.278085
39-0.092186-0.77680.219936
40-0.074067-0.62410.267282
41-0.062213-0.52420.300882
42-0.017297-0.14570.442268
43-0.099374-0.83730.202605
44-0.094161-0.79340.215091
45-0.058421-0.49230.312025
460.0217360.18310.427602
470.1028890.8670.194444
480.2121961.7880.039022


Partial Autocorrelation Function
Time lag kPACF(k)T-STATP-value
10.2959222.49350.007491
2-0.128262-1.08080.141732
3-0.187856-1.58290.058944
4-0.101859-0.85830.196812
5-0.150259-1.26610.104807
60.0077510.06530.474056
7-0.370455-3.12150.001301
8-0.151418-1.27590.103079
9-0.281382-2.3710.010229
10-0.217819-1.83540.035319
110.2375332.00150.024581
120.4264753.59350.000299
13-0.014905-0.12560.450204
14-0.042051-0.35430.362071
150.0534010.450.327052
160.0094720.07980.468306
17-0.000159-0.00130.499468
18-0.074854-0.63070.265121
190.0364840.30740.379712
20-0.043219-0.36420.358407
21-0.019865-0.16740.433771
22-0.066089-0.55690.289682
230.0442150.37260.355291
24-0.011873-0.10.460296
250.0268620.22630.410792
26-0.116488-0.98150.164827
27-0.016749-0.14110.444084
280.0523080.44080.330364
29-0.030015-0.25290.400532
300.0560090.47190.319207
310.1029940.86780.194202
320.0643070.54190.294804
330.0179710.15140.440036
340.0095390.08040.468082
35-0.207333-1.7470.042479
360.1050830.88540.189452
37-0.023869-0.20110.420589
38-0.014043-0.11830.45307
390.0372050.31350.377412
40-0.046556-0.39230.348009
410.0400670.33760.368327
420.0035790.03020.488014
43-0.063714-0.53690.296521
440.0339860.28640.387716
450.0499430.42080.337576
460.0731380.61630.269843
47-0.019793-0.16680.43401
48-0.148645-1.25250.107248

\begin{tabular}{lllllllll}
\hline
Partial Autocorrelation Function \tabularnewline
Time lag k & PACF(k) & T-STAT & P-value \tabularnewline
1 & 0.295922 & 2.4935 & 0.007491 \tabularnewline
2 & -0.128262 & -1.0808 & 0.141732 \tabularnewline
3 & -0.187856 & -1.5829 & 0.058944 \tabularnewline
4 & -0.101859 & -0.8583 & 0.196812 \tabularnewline
5 & -0.150259 & -1.2661 & 0.104807 \tabularnewline
6 & 0.007751 & 0.0653 & 0.474056 \tabularnewline
7 & -0.370455 & -3.1215 & 0.001301 \tabularnewline
8 & -0.151418 & -1.2759 & 0.103079 \tabularnewline
9 & -0.281382 & -2.371 & 0.010229 \tabularnewline
10 & -0.217819 & -1.8354 & 0.035319 \tabularnewline
11 & 0.237533 & 2.0015 & 0.024581 \tabularnewline
12 & 0.426475 & 3.5935 & 0.000299 \tabularnewline
13 & -0.014905 & -0.1256 & 0.450204 \tabularnewline
14 & -0.042051 & -0.3543 & 0.362071 \tabularnewline
15 & 0.053401 & 0.45 & 0.327052 \tabularnewline
16 & 0.009472 & 0.0798 & 0.468306 \tabularnewline
17 & -0.000159 & -0.0013 & 0.499468 \tabularnewline
18 & -0.074854 & -0.6307 & 0.265121 \tabularnewline
19 & 0.036484 & 0.3074 & 0.379712 \tabularnewline
20 & -0.043219 & -0.3642 & 0.358407 \tabularnewline
21 & -0.019865 & -0.1674 & 0.433771 \tabularnewline
22 & -0.066089 & -0.5569 & 0.289682 \tabularnewline
23 & 0.044215 & 0.3726 & 0.355291 \tabularnewline
24 & -0.011873 & -0.1 & 0.460296 \tabularnewline
25 & 0.026862 & 0.2263 & 0.410792 \tabularnewline
26 & -0.116488 & -0.9815 & 0.164827 \tabularnewline
27 & -0.016749 & -0.1411 & 0.444084 \tabularnewline
28 & 0.052308 & 0.4408 & 0.330364 \tabularnewline
29 & -0.030015 & -0.2529 & 0.400532 \tabularnewline
30 & 0.056009 & 0.4719 & 0.319207 \tabularnewline
31 & 0.102994 & 0.8678 & 0.194202 \tabularnewline
32 & 0.064307 & 0.5419 & 0.294804 \tabularnewline
33 & 0.017971 & 0.1514 & 0.440036 \tabularnewline
34 & 0.009539 & 0.0804 & 0.468082 \tabularnewline
35 & -0.207333 & -1.747 & 0.042479 \tabularnewline
36 & 0.105083 & 0.8854 & 0.189452 \tabularnewline
37 & -0.023869 & -0.2011 & 0.420589 \tabularnewline
38 & -0.014043 & -0.1183 & 0.45307 \tabularnewline
39 & 0.037205 & 0.3135 & 0.377412 \tabularnewline
40 & -0.046556 & -0.3923 & 0.348009 \tabularnewline
41 & 0.040067 & 0.3376 & 0.368327 \tabularnewline
42 & 0.003579 & 0.0302 & 0.488014 \tabularnewline
43 & -0.063714 & -0.5369 & 0.296521 \tabularnewline
44 & 0.033986 & 0.2864 & 0.387716 \tabularnewline
45 & 0.049943 & 0.4208 & 0.337576 \tabularnewline
46 & 0.073138 & 0.6163 & 0.269843 \tabularnewline
47 & -0.019793 & -0.1668 & 0.43401 \tabularnewline
48 & -0.148645 & -1.2525 & 0.107248 \tabularnewline
\hline
\end{tabular}
%Source: https://freestatistics.org/blog/index.php?pk=207860&T=2

[TABLE]
[ROW][C]Partial Autocorrelation Function[/C][/ROW]
[ROW][C]Time lag k[/C][C]PACF(k)[/C][C]T-STAT[/C][C]P-value[/C][/ROW]
[ROW][C]1[/C][C]0.295922[/C][C]2.4935[/C][C]0.007491[/C][/ROW]
[ROW][C]2[/C][C]-0.128262[/C][C]-1.0808[/C][C]0.141732[/C][/ROW]
[ROW][C]3[/C][C]-0.187856[/C][C]-1.5829[/C][C]0.058944[/C][/ROW]
[ROW][C]4[/C][C]-0.101859[/C][C]-0.8583[/C][C]0.196812[/C][/ROW]
[ROW][C]5[/C][C]-0.150259[/C][C]-1.2661[/C][C]0.104807[/C][/ROW]
[ROW][C]6[/C][C]0.007751[/C][C]0.0653[/C][C]0.474056[/C][/ROW]
[ROW][C]7[/C][C]-0.370455[/C][C]-3.1215[/C][C]0.001301[/C][/ROW]
[ROW][C]8[/C][C]-0.151418[/C][C]-1.2759[/C][C]0.103079[/C][/ROW]
[ROW][C]9[/C][C]-0.281382[/C][C]-2.371[/C][C]0.010229[/C][/ROW]
[ROW][C]10[/C][C]-0.217819[/C][C]-1.8354[/C][C]0.035319[/C][/ROW]
[ROW][C]11[/C][C]0.237533[/C][C]2.0015[/C][C]0.024581[/C][/ROW]
[ROW][C]12[/C][C]0.426475[/C][C]3.5935[/C][C]0.000299[/C][/ROW]
[ROW][C]13[/C][C]-0.014905[/C][C]-0.1256[/C][C]0.450204[/C][/ROW]
[ROW][C]14[/C][C]-0.042051[/C][C]-0.3543[/C][C]0.362071[/C][/ROW]
[ROW][C]15[/C][C]0.053401[/C][C]0.45[/C][C]0.327052[/C][/ROW]
[ROW][C]16[/C][C]0.009472[/C][C]0.0798[/C][C]0.468306[/C][/ROW]
[ROW][C]17[/C][C]-0.000159[/C][C]-0.0013[/C][C]0.499468[/C][/ROW]
[ROW][C]18[/C][C]-0.074854[/C][C]-0.6307[/C][C]0.265121[/C][/ROW]
[ROW][C]19[/C][C]0.036484[/C][C]0.3074[/C][C]0.379712[/C][/ROW]
[ROW][C]20[/C][C]-0.043219[/C][C]-0.3642[/C][C]0.358407[/C][/ROW]
[ROW][C]21[/C][C]-0.019865[/C][C]-0.1674[/C][C]0.433771[/C][/ROW]
[ROW][C]22[/C][C]-0.066089[/C][C]-0.5569[/C][C]0.289682[/C][/ROW]
[ROW][C]23[/C][C]0.044215[/C][C]0.3726[/C][C]0.355291[/C][/ROW]
[ROW][C]24[/C][C]-0.011873[/C][C]-0.1[/C][C]0.460296[/C][/ROW]
[ROW][C]25[/C][C]0.026862[/C][C]0.2263[/C][C]0.410792[/C][/ROW]
[ROW][C]26[/C][C]-0.116488[/C][C]-0.9815[/C][C]0.164827[/C][/ROW]
[ROW][C]27[/C][C]-0.016749[/C][C]-0.1411[/C][C]0.444084[/C][/ROW]
[ROW][C]28[/C][C]0.052308[/C][C]0.4408[/C][C]0.330364[/C][/ROW]
[ROW][C]29[/C][C]-0.030015[/C][C]-0.2529[/C][C]0.400532[/C][/ROW]
[ROW][C]30[/C][C]0.056009[/C][C]0.4719[/C][C]0.319207[/C][/ROW]
[ROW][C]31[/C][C]0.102994[/C][C]0.8678[/C][C]0.194202[/C][/ROW]
[ROW][C]32[/C][C]0.064307[/C][C]0.5419[/C][C]0.294804[/C][/ROW]
[ROW][C]33[/C][C]0.017971[/C][C]0.1514[/C][C]0.440036[/C][/ROW]
[ROW][C]34[/C][C]0.009539[/C][C]0.0804[/C][C]0.468082[/C][/ROW]
[ROW][C]35[/C][C]-0.207333[/C][C]-1.747[/C][C]0.042479[/C][/ROW]
[ROW][C]36[/C][C]0.105083[/C][C]0.8854[/C][C]0.189452[/C][/ROW]
[ROW][C]37[/C][C]-0.023869[/C][C]-0.2011[/C][C]0.420589[/C][/ROW]
[ROW][C]38[/C][C]-0.014043[/C][C]-0.1183[/C][C]0.45307[/C][/ROW]
[ROW][C]39[/C][C]0.037205[/C][C]0.3135[/C][C]0.377412[/C][/ROW]
[ROW][C]40[/C][C]-0.046556[/C][C]-0.3923[/C][C]0.348009[/C][/ROW]
[ROW][C]41[/C][C]0.040067[/C][C]0.3376[/C][C]0.368327[/C][/ROW]
[ROW][C]42[/C][C]0.003579[/C][C]0.0302[/C][C]0.488014[/C][/ROW]
[ROW][C]43[/C][C]-0.063714[/C][C]-0.5369[/C][C]0.296521[/C][/ROW]
[ROW][C]44[/C][C]0.033986[/C][C]0.2864[/C][C]0.387716[/C][/ROW]
[ROW][C]45[/C][C]0.049943[/C][C]0.4208[/C][C]0.337576[/C][/ROW]
[ROW][C]46[/C][C]0.073138[/C][C]0.6163[/C][C]0.269843[/C][/ROW]
[ROW][C]47[/C][C]-0.019793[/C][C]-0.1668[/C][C]0.43401[/C][/ROW]
[ROW][C]48[/C][C]-0.148645[/C][C]-1.2525[/C][C]0.107248[/C][/ROW]
[/TABLE]
Source: https://freestatistics.org/blog/index.php?pk=207860&T=2

Globally Unique Identifier (entire table): ba.freestatistics.org/blog/index.php?pk=207860&T=2

As an alternative you can also use a QR Code:  

The GUIDs for individual cells are displayed in the table below:

Partial Autocorrelation Function
Time lag kPACF(k)T-STATP-value
10.2959222.49350.007491
2-0.128262-1.08080.141732
3-0.187856-1.58290.058944
4-0.101859-0.85830.196812
5-0.150259-1.26610.104807
60.0077510.06530.474056
7-0.370455-3.12150.001301
8-0.151418-1.27590.103079
9-0.281382-2.3710.010229
10-0.217819-1.83540.035319
110.2375332.00150.024581
120.4264753.59350.000299
13-0.014905-0.12560.450204
14-0.042051-0.35430.362071
150.0534010.450.327052
160.0094720.07980.468306
17-0.000159-0.00130.499468
18-0.074854-0.63070.265121
190.0364840.30740.379712
20-0.043219-0.36420.358407
21-0.019865-0.16740.433771
22-0.066089-0.55690.289682
230.0442150.37260.355291
24-0.011873-0.10.460296
250.0268620.22630.410792
26-0.116488-0.98150.164827
27-0.016749-0.14110.444084
280.0523080.44080.330364
29-0.030015-0.25290.400532
300.0560090.47190.319207
310.1029940.86780.194202
320.0643070.54190.294804
330.0179710.15140.440036
340.0095390.08040.468082
35-0.207333-1.7470.042479
360.1050830.88540.189452
37-0.023869-0.20110.420589
38-0.014043-0.11830.45307
390.0372050.31350.377412
40-0.046556-0.39230.348009
410.0400670.33760.368327
420.0035790.03020.488014
43-0.063714-0.53690.296521
440.0339860.28640.387716
450.0499430.42080.337576
460.0731380.61630.269843
47-0.019793-0.16680.43401
48-0.148645-1.25250.107248


Parameters (Session):
par1 = 48 ; par2 = 1 ; par3 = 1 ; par4 = 0 ; par5 = 12 ; par6 = White Noise ; par7 = 0.95 ;
Parameters (R input):
par1 = 48 ; par2 = 1 ; par3 = 1 ; par4 = 0 ; par5 = 12 ; par6 = White Noise ; par7 = 0.95 ; par8 = ;
R code (references can be found in the software module):
if (par1 == 'Default') {
par1 = 10*log10(length(x))
} else {
par1 <- as.numeric(par1)
}
par2 <- as.numeric(par2)
par3 <- as.numeric(par3)
par4 <- as.numeric(par4)
par5 <- as.numeric(par5)
if (par6 == 'White Noise') par6 <- 'white' else par6 <- 'ma'
par7 <- as.numeric(par7)
if (par8 != '') par8 <- as.numeric(par8)
ox <- x
if (par8 == '') {
if (par2 == 0) {
x <- log(x)
} else {
x <- (x ^ par2 - 1) / par2
}
} else {
x <- log(x,base=par8)
}
if (par3 > 0) x <- diff(x,lag=1,difference=par3)
if (par4 > 0) x <- diff(x,lag=par5,difference=par4)
bitmap(file='picts.png')
op <- par(mfrow=c(2,1))
plot(ox,type='l',main='Original Time Series',xlab='time',ylab='value')
if (par8=='') {
mytitle <- paste('Working Time Series (lambda=',par2,', d=',par3,', D=',par4,')',sep='')
mysub <- paste('(lambda=',par2,', d=',par3,', D=',par4,', CI=', par7, ', CI type=',par6,')',sep='')
} else {
mytitle <- paste('Working Time Series (base=',par8,', d=',par3,', D=',par4,')',sep='')
mysub <- paste('(base=',par8,', d=',par3,', D=',par4,', CI=', par7, ', CI type=',par6,')',sep='')
}
plot(x,type='l', main=mytitle,xlab='time',ylab='value')
par(op)
dev.off()
bitmap(file='pic1.png')
racf <- acf(x, par1, main='Autocorrelation', xlab='time lag', ylab='ACF', ci.type=par6, ci=par7, sub=mysub)
dev.off()
bitmap(file='pic2.png')
rpacf <- pacf(x,par1,main='Partial Autocorrelation',xlab='lags',ylab='PACF',sub=mysub)
dev.off()
(myacf <- c(racf$acf))
(mypacf <- c(rpacf$acf))
lengthx <- length(x)
sqrtn <- sqrt(lengthx)
load(file='createtable')
a<-table.start()
a<-table.row.start(a)
a<-table.element(a,'Autocorrelation Function',4,TRUE)
a<-table.row.end(a)
a<-table.row.start(a)
a<-table.element(a,'Time lag k',header=TRUE)
a<-table.element(a,hyperlink('basics.htm','ACF(k)','click here for more information about the Autocorrelation Function'),header=TRUE)
a<-table.element(a,'T-STAT',header=TRUE)
a<-table.element(a,'P-value',header=TRUE)
a<-table.row.end(a)
for (i in 2:(par1+1)) {
a<-table.row.start(a)
a<-table.element(a,i-1,header=TRUE)
a<-table.element(a,round(myacf[i],6))
mytstat <- myacf[i]*sqrtn
a<-table.element(a,round(mytstat,4))
a<-table.element(a,round(1-pt(abs(mytstat),lengthx),6))
a<-table.row.end(a)
}
a<-table.end(a)
table.save(a,file='mytable.tab')
a<-table.start()
a<-table.row.start(a)
a<-table.element(a,'Partial Autocorrelation Function',4,TRUE)
a<-table.row.end(a)
a<-table.row.start(a)
a<-table.element(a,'Time lag k',header=TRUE)
a<-table.element(a,hyperlink('basics.htm','PACF(k)','click here for more information about the Partial Autocorrelation Function'),header=TRUE)
a<-table.element(a,'T-STAT',header=TRUE)
a<-table.element(a,'P-value',header=TRUE)
a<-table.row.end(a)
for (i in 1:par1) {
a<-table.row.start(a)
a<-table.element(a,i,header=TRUE)
a<-table.element(a,round(mypacf[i],6))
mytstat <- mypacf[i]*sqrtn
a<-table.element(a,round(mytstat,4))
a<-table.element(a,round(1-pt(abs(mytstat),lengthx),6))
a<-table.row.end(a)
}
a<-table.end(a)
table.save(a,file='mytable1.tab')