Free Statistics

of Irreproducible Research!

Author's title

Author*Unverified author*
R Software Modulerwasp_correlation.wasp
Title produced by softwarePearson Correlation
Date of computationThu, 27 Jun 2013 10:11:05 -0400
Cite this page as followsStatistical Computations at FreeStatistics.org, Office for Research Development and Education, URL https://freestatistics.org/blog/index.php?v=date/2013/Jun/27/t13723424786yz2sij6dvy6v2f.htm/, Retrieved Sat, 27 Apr 2024 22:19:57 +0000
Statistical Computations at FreeStatistics.org, Office for Research Development and Education, URL https://freestatistics.org/blog/index.php?pk=210762, Retrieved Sat, 27 Apr 2024 22:19:57 +0000
QR Codes:

Original text written by user:
IsPrivate?No (this computation is public)
User-defined keywords
Estimated Impact212
Family? (F = Feedback message, R = changed R code, M = changed R Module, P = changed Parameters, D = changed Data)
-       [Pearson Correlation] [6-27-2013 log] [2013-06-27 14:11:05] [d41d8cd98f00b204e9800998ecf8427e] [Current]
Feedback Forum

Post a new message
Dataseries X:
0.552841969
0.62838893
0.670941281
0.698970004
0.714482171
0.729459326
0.745966567
0.748188027
0.77815125
0.816609502
0.823908741
0.858670847
0.865301426
0.875061263
0.87917783
0.884606581
0.916453949
0.934498451
0.944482672
0.985276743
1
1
1
1.010723865
1.041392685
1.071882007
1.130333768
1.138302698
1.491361694

Dataseries Y:
4.803347692
5.007753445
4.917809207
4.668370472
4.816129041
5.236337478
4.463608092
5.059242059
5.284560886
5.205640245
5.060101415
5.228728367
5.042168348
4.282499541
5.136010229
5.199051161
5.204889056
4.567045063
4.038122253
4.653504882
5.16726563
4.40542852
4.070192255
4.543921158
4.457825891
4.703657658
4.868043268
4.69553989
4.284070866


Summary of computational transaction
Raw Inputview raw input (R code)
Raw Outputview raw output of R engine
Computing time2 seconds
R Server'Gertrude Mary Cox' @ cox.wessa.net
R Framework error message
Warning: there are blank lines in the 'Data X' field.
Please, use NA for missing data - blank lines are simply
 deleted and are NOT treated as missing values.

\begin{tabular}{lllllllll}
\hline
Summary of computational transaction \tabularnewline
Raw Input & view raw input (R code)  \tabularnewline
Raw Output & view raw output of R engine  \tabularnewline
Computing time & 2 seconds \tabularnewline
R Server & 'Gertrude Mary Cox' @ cox.wessa.net \tabularnewline
R Framework error message & 
Warning: there are blank lines in the 'Data X' field.
Please, use NA for missing data - blank lines are simply
 deleted and are NOT treated as missing values.
\tabularnewline \hline \end{tabular} %Source: https://freestatistics.org/blog/index.php?pk=210762&T=0

[TABLE]
[ROW][C]Summary of computational transaction[/C][/ROW]
[ROW][C]Raw Input[/C][C]view raw input (R code) [/C][/ROW]
[ROW][C]Raw Output[/C][C]view raw output of R engine [/C][/ROW]
[ROW][C]Computing time[/C][C]2 seconds[/C][/ROW]
[ROW][C]R Server[/C][C]'Gertrude Mary Cox' @ cox.wessa.net[/C][/ROW]
[ROW][C]R Framework error message[/C][C]
Warning: there are blank lines in the 'Data X' field.
Please, use NA for missing data - blank lines are simply
 deleted and are NOT treated as missing values.
[/C][/ROW] [/TABLE] Source: https://freestatistics.org/blog/index.php?pk=210762&T=0

Globally Unique Identifier (entire table): ba.freestatistics.org/blog/index.php?pk=210762&T=0

As an alternative you can also use a QR Code:  

The GUIDs for individual cells are displayed in the table below:

Summary of computational transaction
Raw Inputview raw input (R code)
Raw Outputview raw output of R engine
Computing time2 seconds
R Server'Gertrude Mary Cox' @ cox.wessa.net
R Framework error message
Warning: there are blank lines in the 'Data X' field.
Please, use NA for missing data - blank lines are simply
 deleted and are NOT treated as missing values.


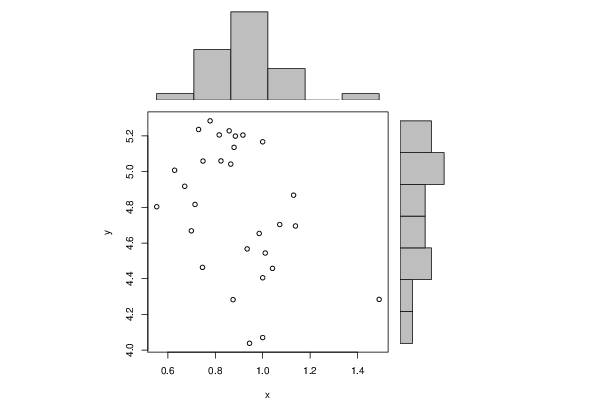
Pearson Product Moment Correlation - Ungrouped Data
StatisticVariable XVariable Y
Mean0.8943253188620694.79554703682759
Biased Variance0.03415052838954460.13142062718014
Biased Standard Deviation0.1847986157673930.362519830050909
Covariance-0.0283533501424773
Correlation-0.408633467607076
Determination0.166981310848583
T-Test-2.32642171295886
p-value (2 sided)0.0277460301106536
p-value (1 sided)0.0138730150553268
Degrees of Freedom27
Number of Observations29

\begin{tabular}{lllllllll}
\hline
Pearson Product Moment Correlation - Ungrouped Data \tabularnewline
Statistic & Variable X & Variable Y \tabularnewline
Mean & 0.894325318862069 & 4.79554703682759 \tabularnewline
Biased Variance & 0.0341505283895446 & 0.13142062718014 \tabularnewline
Biased Standard Deviation & 0.184798615767393 & 0.362519830050909 \tabularnewline
Covariance & -0.0283533501424773 \tabularnewline
Correlation & -0.408633467607076 \tabularnewline
Determination & 0.166981310848583 \tabularnewline
T-Test & -2.32642171295886 \tabularnewline
p-value (2 sided) & 0.0277460301106536 \tabularnewline
p-value (1 sided) & 0.0138730150553268 \tabularnewline
Degrees of Freedom & 27 \tabularnewline
Number of Observations & 29 \tabularnewline
\hline
\end{tabular}
%Source: https://freestatistics.org/blog/index.php?pk=210762&T=1

[TABLE]
[ROW][C]Pearson Product Moment Correlation - Ungrouped Data[/C][/ROW]
[ROW][C]Statistic[/C][C]Variable X[/C][C]Variable Y[/C][/ROW]
[ROW][C]Mean[/C][C]0.894325318862069[/C][C]4.79554703682759[/C][/ROW]
[ROW][C]Biased Variance[/C][C]0.0341505283895446[/C][C]0.13142062718014[/C][/ROW]
[ROW][C]Biased Standard Deviation[/C][C]0.184798615767393[/C][C]0.362519830050909[/C][/ROW]
[ROW][C]Covariance[/C][C]-0.0283533501424773[/C][/ROW]
[ROW][C]Correlation[/C][C]-0.408633467607076[/C][/ROW]
[ROW][C]Determination[/C][C]0.166981310848583[/C][/ROW]
[ROW][C]T-Test[/C][C]-2.32642171295886[/C][/ROW]
[ROW][C]p-value (2 sided)[/C][C]0.0277460301106536[/C][/ROW]
[ROW][C]p-value (1 sided)[/C][C]0.0138730150553268[/C][/ROW]
[ROW][C]Degrees of Freedom[/C][C]27[/C][/ROW]
[ROW][C]Number of Observations[/C][C]29[/C][/ROW]
[/TABLE]
Source: https://freestatistics.org/blog/index.php?pk=210762&T=1

Globally Unique Identifier (entire table): ba.freestatistics.org/blog/index.php?pk=210762&T=1

As an alternative you can also use a QR Code:  

The GUIDs for individual cells are displayed in the table below:

Pearson Product Moment Correlation - Ungrouped Data
StatisticVariable XVariable Y
Mean0.8943253188620694.79554703682759
Biased Variance0.03415052838954460.13142062718014
Biased Standard Deviation0.1847986157673930.362519830050909
Covariance-0.0283533501424773
Correlation-0.408633467607076
Determination0.166981310848583
T-Test-2.32642171295886
p-value (2 sided)0.0277460301106536
p-value (1 sided)0.0138730150553268
Degrees of Freedom27
Number of Observations29


Parameters (Session):
Parameters (R input):
R code (references can be found in the software module):
x <- x[!is.na(y)]
y <- y[!is.na(y)]
y <- y[!is.na(x)]
x <- x[!is.na(x)]
bitmap(file='test1.png')
histx <- hist(x, plot=FALSE)
histy <- hist(y, plot=FALSE)
maxcounts <- max(c(histx$counts, histx$counts))
xrange <- c(min(x),max(x))
yrange <- c(min(y),max(y))
nf <- layout(matrix(c(2,0,1,3),2,2,byrow=TRUE), c(3,1), c(1,3), TRUE)
par(mar=c(4,4,1,1))
plot(x, y, xlim=xrange, ylim=yrange, xlab=xlab, ylab=ylab)
par(mar=c(0,4,1,1))
barplot(histx$counts, axes=FALSE, ylim=c(0, maxcounts), space=0)
par(mar=c(4,0,1,1))
barplot(histy$counts, axes=FALSE, xlim=c(0, maxcounts), space=0, horiz=TRUE)
dev.off()
lx = length(x)
makebiased = (lx-1)/lx
varx = var(x)*makebiased
vary = var(y)*makebiased
corxy <- cor.test(x,y,method='pearson', na.rm = T)
cxy <- as.matrix(corxy$estimate)[1,1]
load(file='createtable')
a<-table.start()
a<-table.row.start(a)
a<-table.element(a,'Pearson Product Moment Correlation - Ungrouped Data',3,TRUE)
a<-table.row.end(a)
a<-table.row.start(a)
a<-table.element(a,'Statistic',1,TRUE)
a<-table.element(a,'Variable X',1,TRUE)
a<-table.element(a,'Variable Y',1,TRUE)
a<-table.row.end(a)
a<-table.row.start(a)
a<-table.element(a,hyperlink('arithmetic_mean.htm','Mean',''),header=TRUE)
a<-table.element(a,mean(x))
a<-table.element(a,mean(y))
a<-table.row.end(a)
a<-table.row.start(a)
a<-table.element(a,hyperlink('biased.htm','Biased Variance',''),header=TRUE)
a<-table.element(a,varx)
a<-table.element(a,vary)
a<-table.row.end(a)
a<-table.row.start(a)
a<-table.element(a,hyperlink('biased1.htm','Biased Standard Deviation',''),header=TRUE)
a<-table.element(a,sqrt(varx))
a<-table.element(a,sqrt(vary))
a<-table.row.end(a)
a<-table.row.start(a)
a<-table.element(a,hyperlink('covariance.htm','Covariance',''),header=TRUE)
a<-table.element(a,cov(x,y),2)
a<-table.row.end(a)
a<-table.row.start(a)
a<-table.element(a,hyperlink('pearson_correlation.htm','Correlation',''),header=TRUE)
a<-table.element(a,cxy,2)
a<-table.row.end(a)
a<-table.row.start(a)
a<-table.element(a,hyperlink('coeff_of_determination.htm','Determination',''),header=TRUE)
a<-table.element(a,cxy*cxy,2)
a<-table.row.end(a)
a<-table.row.start(a)
a<-table.element(a,hyperlink('ttest_statistic.htm','T-Test',''),header=TRUE)
a<-table.element(a,as.matrix(corxy$statistic)[1,1],2)
a<-table.row.end(a)
a<-table.row.start(a)
a<-table.element(a,'p-value (2 sided)',header=TRUE)
a<-table.element(a,(p2 <- as.matrix(corxy$p.value)[1,1]),2)
a<-table.row.end(a)
a<-table.row.start(a)
a<-table.element(a,'p-value (1 sided)',header=TRUE)
a<-table.element(a,p2/2,2)
a<-table.row.end(a)
a<-table.row.start(a)
a<-table.element(a,'Degrees of Freedom',header=TRUE)
a<-table.element(a,lx-2,2)
a<-table.row.end(a)
a<-table.row.start(a)
a<-table.element(a,'Number of Observations',header=TRUE)
a<-table.element(a,lx,2)
a<-table.row.end(a)
a<-table.end(a)
table.save(a,file='mytable.tab')