\begin{tabular}{lllllllll}
\hline
Summary of computational transaction \tabularnewline
Raw Input & view raw input (R code)  \tabularnewline
Raw Output & view raw output of R engine  \tabularnewline
Computing time & 3 seconds \tabularnewline
R Server & 'Herman Ole Andreas Wold' @ wold.wessa.net \tabularnewline
\hline
\end{tabular}
%Source: https://freestatistics.org/blog/index.php?pk=210815&T=0
[TABLE]
[ROW][C]Summary of computational transaction[/C][/ROW]
[ROW][C]Raw Input[/C][C]view raw input (R code) [/C][/ROW]
[ROW][C]Raw Output[/C][C]view raw output of R engine [/C][/ROW]
[ROW][C]Computing time[/C][C]3 seconds[/C][/ROW]
[ROW][C]R Server[/C][C]'Herman Ole Andreas Wold' @ wold.wessa.net[/C][/ROW]
[/TABLE]
Source: https://freestatistics.org/blog/index.php?pk=210815&T=0
If you paste this QR Code into your document, anyone with a smartphone or tablet will be able to scan it and view this table in a browser.
If you paste this QR Code into your document, anyone with a smartphone or tablet will be able to scan it and view this table in a browser.
If you paste this QR Code into your document, anyone with a smartphone or tablet will be able to scan it and view this table in a browser.
If you paste this QR Code into your document, anyone with a smartphone or tablet will be able to scan it and view this table in a browser.
If you paste this QR Code into your document, anyone with a smartphone or tablet will be able to scan it and view this table in a browser.
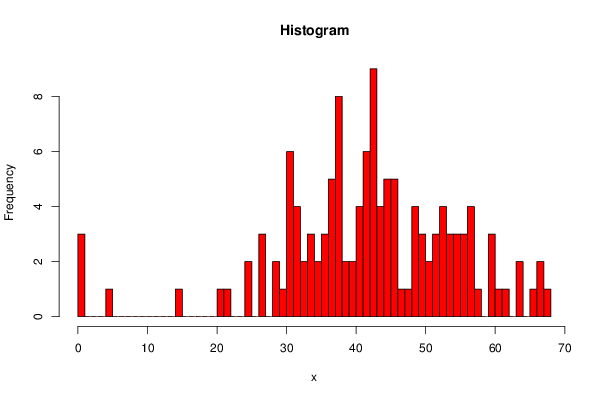
| Frequency Table (Histogram) | | Bins | Midpoint | Abs. Frequency | Rel. Frequency | Cumul. Rel. Freq. | Density | | [0,1[ | 0.5 | 3 | 0.023438 | 0.023438 | 0.023438 | | [1,2[ | 1.5 | 0 | 0 | 0.023438 | 0 | | [2,3[ | 2.5 | 0 | 0 | 0.023438 | 0 | | [3,4[ | 3.5 | 0 | 0 | 0.023438 | 0 | | [4,5[ | 4.5 | 1 | 0.007812 | 0.03125 | 0.007812 | | [5,6[ | 5.5 | 0 | 0 | 0.03125 | 0 | | [6,7[ | 6.5 | 0 | 0 | 0.03125 | 0 | | [7,8[ | 7.5 | 0 | 0 | 0.03125 | 0 | | [8,9[ | 8.5 | 0 | 0 | 0.03125 | 0 | | [9,10[ | 9.5 | 0 | 0 | 0.03125 | 0 | | [10,11[ | 10.5 | 0 | 0 | 0.03125 | 0 | | [11,12[ | 11.5 | 0 | 0 | 0.03125 | 0 | | [12,13[ | 12.5 | 0 | 0 | 0.03125 | 0 | | [13,14[ | 13.5 | 0 | 0 | 0.03125 | 0 | | [14,15[ | 14.5 | 1 | 0.007812 | 0.039062 | 0.007812 | | [15,16[ | 15.5 | 0 | 0 | 0.039062 | 0 | | [16,17[ | 16.5 | 0 | 0 | 0.039062 | 0 | | [17,18[ | 17.5 | 0 | 0 | 0.039062 | 0 | | [18,19[ | 18.5 | 0 | 0 | 0.039062 | 0 | | [19,20[ | 19.5 | 0 | 0 | 0.039062 | 0 | | [20,21[ | 20.5 | 1 | 0.007812 | 0.046875 | 0.007812 | | [21,22[ | 21.5 | 1 | 0.007812 | 0.054688 | 0.007812 | | [22,23[ | 22.5 | 0 | 0 | 0.054688 | 0 | | [23,24[ | 23.5 | 0 | 0 | 0.054688 | 0 | | [24,25[ | 24.5 | 2 | 0.015625 | 0.070312 | 0.015625 | | [25,26[ | 25.5 | 0 | 0 | 0.070312 | 0 | | [26,27[ | 26.5 | 3 | 0.023438 | 0.09375 | 0.023438 | | [27,28[ | 27.5 | 0 | 0 | 0.09375 | 0 | | [28,29[ | 28.5 | 2 | 0.015625 | 0.109375 | 0.015625 | | [29,30[ | 29.5 | 1 | 0.007812 | 0.117188 | 0.007812 | | [30,31[ | 30.5 | 6 | 0.046875 | 0.164062 | 0.046875 | | [31,32[ | 31.5 | 4 | 0.03125 | 0.195312 | 0.03125 | | [32,33[ | 32.5 | 2 | 0.015625 | 0.210938 | 0.015625 | | [33,34[ | 33.5 | 3 | 0.023438 | 0.234375 | 0.023438 | | [34,35[ | 34.5 | 2 | 0.015625 | 0.25 | 0.015625 | | [35,36[ | 35.5 | 3 | 0.023438 | 0.273438 | 0.023438 | | [36,37[ | 36.5 | 5 | 0.039062 | 0.3125 | 0.039062 | | [37,38[ | 37.5 | 8 | 0.0625 | 0.375 | 0.0625 | | [38,39[ | 38.5 | 2 | 0.015625 | 0.390625 | 0.015625 | | [39,40[ | 39.5 | 2 | 0.015625 | 0.40625 | 0.015625 | | [40,41[ | 40.5 | 4 | 0.03125 | 0.4375 | 0.03125 | | [41,42[ | 41.5 | 6 | 0.046875 | 0.484375 | 0.046875 | | [42,43[ | 42.5 | 9 | 0.070312 | 0.554688 | 0.070312 | | [43,44[ | 43.5 | 4 | 0.03125 | 0.585938 | 0.03125 | | [44,45[ | 44.5 | 5 | 0.039062 | 0.625 | 0.039062 | | [45,46[ | 45.5 | 5 | 0.039062 | 0.664062 | 0.039062 | | [46,47[ | 46.5 | 1 | 0.007812 | 0.671875 | 0.007812 | | [47,48[ | 47.5 | 1 | 0.007812 | 0.679688 | 0.007812 | | [48,49[ | 48.5 | 4 | 0.03125 | 0.710938 | 0.03125 | | [49,50[ | 49.5 | 3 | 0.023438 | 0.734375 | 0.023438 | | [50,51[ | 50.5 | 2 | 0.015625 | 0.75 | 0.015625 | | [51,52[ | 51.5 | 3 | 0.023438 | 0.773438 | 0.023438 | | [52,53[ | 52.5 | 4 | 0.03125 | 0.804688 | 0.03125 | | [53,54[ | 53.5 | 3 | 0.023438 | 0.828125 | 0.023438 | | [54,55[ | 54.5 | 3 | 0.023438 | 0.851562 | 0.023438 | | [55,56[ | 55.5 | 3 | 0.023438 | 0.875 | 0.023438 | | [56,57[ | 56.5 | 4 | 0.03125 | 0.90625 | 0.03125 | | [57,58[ | 57.5 | 1 | 0.007812 | 0.914062 | 0.007812 | | [58,59[ | 58.5 | 0 | 0 | 0.914062 | 0 | | [59,60[ | 59.5 | 3 | 0.023438 | 0.9375 | 0.023438 | | [60,61[ | 60.5 | 1 | 0.007812 | 0.945312 | 0.007812 | | [61,62[ | 61.5 | 1 | 0.007812 | 0.953125 | 0.007812 | | [62,63[ | 62.5 | 0 | 0 | 0.953125 | 0 | | [63,64[ | 63.5 | 2 | 0.015625 | 0.96875 | 0.015625 | | [64,65[ | 64.5 | 0 | 0 | 0.96875 | 0 | | [65,66[ | 65.5 | 1 | 0.007812 | 0.976562 | 0.007812 | | [66,67[ | 66.5 | 2 | 0.015625 | 0.992188 | 0.015625 | | [67,68] | 67.5 | 1 | 0.007812 | 1 | 0.007812 |
\begin{tabular}{lllllllll}
\hline
Frequency Table (Histogram) \tabularnewline
Bins & Midpoint & Abs. Frequency & Rel. Frequency & Cumul. Rel. Freq. & Density \tabularnewline
[0,1[ & 0.5 & 3 & 0.023438 & 0.023438 & 0.023438 \tabularnewline
[1,2[ & 1.5 & 0 & 0 & 0.023438 & 0 \tabularnewline
[2,3[ & 2.5 & 0 & 0 & 0.023438 & 0 \tabularnewline
[3,4[ & 3.5 & 0 & 0 & 0.023438 & 0 \tabularnewline
[4,5[ & 4.5 & 1 & 0.007812 & 0.03125 & 0.007812 \tabularnewline
[5,6[ & 5.5 & 0 & 0 & 0.03125 & 0 \tabularnewline
[6,7[ & 6.5 & 0 & 0 & 0.03125 & 0 \tabularnewline
[7,8[ & 7.5 & 0 & 0 & 0.03125 & 0 \tabularnewline
[8,9[ & 8.5 & 0 & 0 & 0.03125 & 0 \tabularnewline
[9,10[ & 9.5 & 0 & 0 & 0.03125 & 0 \tabularnewline
[10,11[ & 10.5 & 0 & 0 & 0.03125 & 0 \tabularnewline
[11,12[ & 11.5 & 0 & 0 & 0.03125 & 0 \tabularnewline
[12,13[ & 12.5 & 0 & 0 & 0.03125 & 0 \tabularnewline
[13,14[ & 13.5 & 0 & 0 & 0.03125 & 0 \tabularnewline
[14,15[ & 14.5 & 1 & 0.007812 & 0.039062 & 0.007812 \tabularnewline
[15,16[ & 15.5 & 0 & 0 & 0.039062 & 0 \tabularnewline
[16,17[ & 16.5 & 0 & 0 & 0.039062 & 0 \tabularnewline
[17,18[ & 17.5 & 0 & 0 & 0.039062 & 0 \tabularnewline
[18,19[ & 18.5 & 0 & 0 & 0.039062 & 0 \tabularnewline
[19,20[ & 19.5 & 0 & 0 & 0.039062 & 0 \tabularnewline
[20,21[ & 20.5 & 1 & 0.007812 & 0.046875 & 0.007812 \tabularnewline
[21,22[ & 21.5 & 1 & 0.007812 & 0.054688 & 0.007812 \tabularnewline
[22,23[ & 22.5 & 0 & 0 & 0.054688 & 0 \tabularnewline
[23,24[ & 23.5 & 0 & 0 & 0.054688 & 0 \tabularnewline
[24,25[ & 24.5 & 2 & 0.015625 & 0.070312 & 0.015625 \tabularnewline
[25,26[ & 25.5 & 0 & 0 & 0.070312 & 0 \tabularnewline
[26,27[ & 26.5 & 3 & 0.023438 & 0.09375 & 0.023438 \tabularnewline
[27,28[ & 27.5 & 0 & 0 & 0.09375 & 0 \tabularnewline
[28,29[ & 28.5 & 2 & 0.015625 & 0.109375 & 0.015625 \tabularnewline
[29,30[ & 29.5 & 1 & 0.007812 & 0.117188 & 0.007812 \tabularnewline
[30,31[ & 30.5 & 6 & 0.046875 & 0.164062 & 0.046875 \tabularnewline
[31,32[ & 31.5 & 4 & 0.03125 & 0.195312 & 0.03125 \tabularnewline
[32,33[ & 32.5 & 2 & 0.015625 & 0.210938 & 0.015625 \tabularnewline
[33,34[ & 33.5 & 3 & 0.023438 & 0.234375 & 0.023438 \tabularnewline
[34,35[ & 34.5 & 2 & 0.015625 & 0.25 & 0.015625 \tabularnewline
[35,36[ & 35.5 & 3 & 0.023438 & 0.273438 & 0.023438 \tabularnewline
[36,37[ & 36.5 & 5 & 0.039062 & 0.3125 & 0.039062 \tabularnewline
[37,38[ & 37.5 & 8 & 0.0625 & 0.375 & 0.0625 \tabularnewline
[38,39[ & 38.5 & 2 & 0.015625 & 0.390625 & 0.015625 \tabularnewline
[39,40[ & 39.5 & 2 & 0.015625 & 0.40625 & 0.015625 \tabularnewline
[40,41[ & 40.5 & 4 & 0.03125 & 0.4375 & 0.03125 \tabularnewline
[41,42[ & 41.5 & 6 & 0.046875 & 0.484375 & 0.046875 \tabularnewline
[42,43[ & 42.5 & 9 & 0.070312 & 0.554688 & 0.070312 \tabularnewline
[43,44[ & 43.5 & 4 & 0.03125 & 0.585938 & 0.03125 \tabularnewline
[44,45[ & 44.5 & 5 & 0.039062 & 0.625 & 0.039062 \tabularnewline
[45,46[ & 45.5 & 5 & 0.039062 & 0.664062 & 0.039062 \tabularnewline
[46,47[ & 46.5 & 1 & 0.007812 & 0.671875 & 0.007812 \tabularnewline
[47,48[ & 47.5 & 1 & 0.007812 & 0.679688 & 0.007812 \tabularnewline
[48,49[ & 48.5 & 4 & 0.03125 & 0.710938 & 0.03125 \tabularnewline
[49,50[ & 49.5 & 3 & 0.023438 & 0.734375 & 0.023438 \tabularnewline
[50,51[ & 50.5 & 2 & 0.015625 & 0.75 & 0.015625 \tabularnewline
[51,52[ & 51.5 & 3 & 0.023438 & 0.773438 & 0.023438 \tabularnewline
[52,53[ & 52.5 & 4 & 0.03125 & 0.804688 & 0.03125 \tabularnewline
[53,54[ & 53.5 & 3 & 0.023438 & 0.828125 & 0.023438 \tabularnewline
[54,55[ & 54.5 & 3 & 0.023438 & 0.851562 & 0.023438 \tabularnewline
[55,56[ & 55.5 & 3 & 0.023438 & 0.875 & 0.023438 \tabularnewline
[56,57[ & 56.5 & 4 & 0.03125 & 0.90625 & 0.03125 \tabularnewline
[57,58[ & 57.5 & 1 & 0.007812 & 0.914062 & 0.007812 \tabularnewline
[58,59[ & 58.5 & 0 & 0 & 0.914062 & 0 \tabularnewline
[59,60[ & 59.5 & 3 & 0.023438 & 0.9375 & 0.023438 \tabularnewline
[60,61[ & 60.5 & 1 & 0.007812 & 0.945312 & 0.007812 \tabularnewline
[61,62[ & 61.5 & 1 & 0.007812 & 0.953125 & 0.007812 \tabularnewline
[62,63[ & 62.5 & 0 & 0 & 0.953125 & 0 \tabularnewline
[63,64[ & 63.5 & 2 & 0.015625 & 0.96875 & 0.015625 \tabularnewline
[64,65[ & 64.5 & 0 & 0 & 0.96875 & 0 \tabularnewline
[65,66[ & 65.5 & 1 & 0.007812 & 0.976562 & 0.007812 \tabularnewline
[66,67[ & 66.5 & 2 & 0.015625 & 0.992188 & 0.015625 \tabularnewline
[67,68] & 67.5 & 1 & 0.007812 & 1 & 0.007812 \tabularnewline
\hline
\end{tabular}
%Source: https://freestatistics.org/blog/index.php?pk=210815&T=1
[TABLE]
[ROW][C]Frequency Table (Histogram)[/C][/ROW]
[ROW][C]Bins[/C][C]Midpoint[/C][C]Abs. Frequency[/C][C]Rel. Frequency[/C][C]Cumul. Rel. Freq.[/C][C]Density[/C][/ROW]
[ROW][C][0,1[[/C][C]0.5[/C][C]3[/C][C]0.023438[/C][C]0.023438[/C][C]0.023438[/C][/ROW]
[ROW][C][1,2[[/C][C]1.5[/C][C]0[/C][C]0[/C][C]0.023438[/C][C]0[/C][/ROW]
[ROW][C][2,3[[/C][C]2.5[/C][C]0[/C][C]0[/C][C]0.023438[/C][C]0[/C][/ROW]
[ROW][C][3,4[[/C][C]3.5[/C][C]0[/C][C]0[/C][C]0.023438[/C][C]0[/C][/ROW]
[ROW][C][4,5[[/C][C]4.5[/C][C]1[/C][C]0.007812[/C][C]0.03125[/C][C]0.007812[/C][/ROW]
[ROW][C][5,6[[/C][C]5.5[/C][C]0[/C][C]0[/C][C]0.03125[/C][C]0[/C][/ROW]
[ROW][C][6,7[[/C][C]6.5[/C][C]0[/C][C]0[/C][C]0.03125[/C][C]0[/C][/ROW]
[ROW][C][7,8[[/C][C]7.5[/C][C]0[/C][C]0[/C][C]0.03125[/C][C]0[/C][/ROW]
[ROW][C][8,9[[/C][C]8.5[/C][C]0[/C][C]0[/C][C]0.03125[/C][C]0[/C][/ROW]
[ROW][C][9,10[[/C][C]9.5[/C][C]0[/C][C]0[/C][C]0.03125[/C][C]0[/C][/ROW]
[ROW][C][10,11[[/C][C]10.5[/C][C]0[/C][C]0[/C][C]0.03125[/C][C]0[/C][/ROW]
[ROW][C][11,12[[/C][C]11.5[/C][C]0[/C][C]0[/C][C]0.03125[/C][C]0[/C][/ROW]
[ROW][C][12,13[[/C][C]12.5[/C][C]0[/C][C]0[/C][C]0.03125[/C][C]0[/C][/ROW]
[ROW][C][13,14[[/C][C]13.5[/C][C]0[/C][C]0[/C][C]0.03125[/C][C]0[/C][/ROW]
[ROW][C][14,15[[/C][C]14.5[/C][C]1[/C][C]0.007812[/C][C]0.039062[/C][C]0.007812[/C][/ROW]
[ROW][C][15,16[[/C][C]15.5[/C][C]0[/C][C]0[/C][C]0.039062[/C][C]0[/C][/ROW]
[ROW][C][16,17[[/C][C]16.5[/C][C]0[/C][C]0[/C][C]0.039062[/C][C]0[/C][/ROW]
[ROW][C][17,18[[/C][C]17.5[/C][C]0[/C][C]0[/C][C]0.039062[/C][C]0[/C][/ROW]
[ROW][C][18,19[[/C][C]18.5[/C][C]0[/C][C]0[/C][C]0.039062[/C][C]0[/C][/ROW]
[ROW][C][19,20[[/C][C]19.5[/C][C]0[/C][C]0[/C][C]0.039062[/C][C]0[/C][/ROW]
[ROW][C][20,21[[/C][C]20.5[/C][C]1[/C][C]0.007812[/C][C]0.046875[/C][C]0.007812[/C][/ROW]
[ROW][C][21,22[[/C][C]21.5[/C][C]1[/C][C]0.007812[/C][C]0.054688[/C][C]0.007812[/C][/ROW]
[ROW][C][22,23[[/C][C]22.5[/C][C]0[/C][C]0[/C][C]0.054688[/C][C]0[/C][/ROW]
[ROW][C][23,24[[/C][C]23.5[/C][C]0[/C][C]0[/C][C]0.054688[/C][C]0[/C][/ROW]
[ROW][C][24,25[[/C][C]24.5[/C][C]2[/C][C]0.015625[/C][C]0.070312[/C][C]0.015625[/C][/ROW]
[ROW][C][25,26[[/C][C]25.5[/C][C]0[/C][C]0[/C][C]0.070312[/C][C]0[/C][/ROW]
[ROW][C][26,27[[/C][C]26.5[/C][C]3[/C][C]0.023438[/C][C]0.09375[/C][C]0.023438[/C][/ROW]
[ROW][C][27,28[[/C][C]27.5[/C][C]0[/C][C]0[/C][C]0.09375[/C][C]0[/C][/ROW]
[ROW][C][28,29[[/C][C]28.5[/C][C]2[/C][C]0.015625[/C][C]0.109375[/C][C]0.015625[/C][/ROW]
[ROW][C][29,30[[/C][C]29.5[/C][C]1[/C][C]0.007812[/C][C]0.117188[/C][C]0.007812[/C][/ROW]
[ROW][C][30,31[[/C][C]30.5[/C][C]6[/C][C]0.046875[/C][C]0.164062[/C][C]0.046875[/C][/ROW]
[ROW][C][31,32[[/C][C]31.5[/C][C]4[/C][C]0.03125[/C][C]0.195312[/C][C]0.03125[/C][/ROW]
[ROW][C][32,33[[/C][C]32.5[/C][C]2[/C][C]0.015625[/C][C]0.210938[/C][C]0.015625[/C][/ROW]
[ROW][C][33,34[[/C][C]33.5[/C][C]3[/C][C]0.023438[/C][C]0.234375[/C][C]0.023438[/C][/ROW]
[ROW][C][34,35[[/C][C]34.5[/C][C]2[/C][C]0.015625[/C][C]0.25[/C][C]0.015625[/C][/ROW]
[ROW][C][35,36[[/C][C]35.5[/C][C]3[/C][C]0.023438[/C][C]0.273438[/C][C]0.023438[/C][/ROW]
[ROW][C][36,37[[/C][C]36.5[/C][C]5[/C][C]0.039062[/C][C]0.3125[/C][C]0.039062[/C][/ROW]
[ROW][C][37,38[[/C][C]37.5[/C][C]8[/C][C]0.0625[/C][C]0.375[/C][C]0.0625[/C][/ROW]
[ROW][C][38,39[[/C][C]38.5[/C][C]2[/C][C]0.015625[/C][C]0.390625[/C][C]0.015625[/C][/ROW]
[ROW][C][39,40[[/C][C]39.5[/C][C]2[/C][C]0.015625[/C][C]0.40625[/C][C]0.015625[/C][/ROW]
[ROW][C][40,41[[/C][C]40.5[/C][C]4[/C][C]0.03125[/C][C]0.4375[/C][C]0.03125[/C][/ROW]
[ROW][C][41,42[[/C][C]41.5[/C][C]6[/C][C]0.046875[/C][C]0.484375[/C][C]0.046875[/C][/ROW]
[ROW][C][42,43[[/C][C]42.5[/C][C]9[/C][C]0.070312[/C][C]0.554688[/C][C]0.070312[/C][/ROW]
[ROW][C][43,44[[/C][C]43.5[/C][C]4[/C][C]0.03125[/C][C]0.585938[/C][C]0.03125[/C][/ROW]
[ROW][C][44,45[[/C][C]44.5[/C][C]5[/C][C]0.039062[/C][C]0.625[/C][C]0.039062[/C][/ROW]
[ROW][C][45,46[[/C][C]45.5[/C][C]5[/C][C]0.039062[/C][C]0.664062[/C][C]0.039062[/C][/ROW]
[ROW][C][46,47[[/C][C]46.5[/C][C]1[/C][C]0.007812[/C][C]0.671875[/C][C]0.007812[/C][/ROW]
[ROW][C][47,48[[/C][C]47.5[/C][C]1[/C][C]0.007812[/C][C]0.679688[/C][C]0.007812[/C][/ROW]
[ROW][C][48,49[[/C][C]48.5[/C][C]4[/C][C]0.03125[/C][C]0.710938[/C][C]0.03125[/C][/ROW]
[ROW][C][49,50[[/C][C]49.5[/C][C]3[/C][C]0.023438[/C][C]0.734375[/C][C]0.023438[/C][/ROW]
[ROW][C][50,51[[/C][C]50.5[/C][C]2[/C][C]0.015625[/C][C]0.75[/C][C]0.015625[/C][/ROW]
[ROW][C][51,52[[/C][C]51.5[/C][C]3[/C][C]0.023438[/C][C]0.773438[/C][C]0.023438[/C][/ROW]
[ROW][C][52,53[[/C][C]52.5[/C][C]4[/C][C]0.03125[/C][C]0.804688[/C][C]0.03125[/C][/ROW]
[ROW][C][53,54[[/C][C]53.5[/C][C]3[/C][C]0.023438[/C][C]0.828125[/C][C]0.023438[/C][/ROW]
[ROW][C][54,55[[/C][C]54.5[/C][C]3[/C][C]0.023438[/C][C]0.851562[/C][C]0.023438[/C][/ROW]
[ROW][C][55,56[[/C][C]55.5[/C][C]3[/C][C]0.023438[/C][C]0.875[/C][C]0.023438[/C][/ROW]
[ROW][C][56,57[[/C][C]56.5[/C][C]4[/C][C]0.03125[/C][C]0.90625[/C][C]0.03125[/C][/ROW]
[ROW][C][57,58[[/C][C]57.5[/C][C]1[/C][C]0.007812[/C][C]0.914062[/C][C]0.007812[/C][/ROW]
[ROW][C][58,59[[/C][C]58.5[/C][C]0[/C][C]0[/C][C]0.914062[/C][C]0[/C][/ROW]
[ROW][C][59,60[[/C][C]59.5[/C][C]3[/C][C]0.023438[/C][C]0.9375[/C][C]0.023438[/C][/ROW]
[ROW][C][60,61[[/C][C]60.5[/C][C]1[/C][C]0.007812[/C][C]0.945312[/C][C]0.007812[/C][/ROW]
[ROW][C][61,62[[/C][C]61.5[/C][C]1[/C][C]0.007812[/C][C]0.953125[/C][C]0.007812[/C][/ROW]
[ROW][C][62,63[[/C][C]62.5[/C][C]0[/C][C]0[/C][C]0.953125[/C][C]0[/C][/ROW]
[ROW][C][63,64[[/C][C]63.5[/C][C]2[/C][C]0.015625[/C][C]0.96875[/C][C]0.015625[/C][/ROW]
[ROW][C][64,65[[/C][C]64.5[/C][C]0[/C][C]0[/C][C]0.96875[/C][C]0[/C][/ROW]
[ROW][C][65,66[[/C][C]65.5[/C][C]1[/C][C]0.007812[/C][C]0.976562[/C][C]0.007812[/C][/ROW]
[ROW][C][66,67[[/C][C]66.5[/C][C]2[/C][C]0.015625[/C][C]0.992188[/C][C]0.015625[/C][/ROW]
[ROW][C][67,68][/C][C]67.5[/C][C]1[/C][C]0.007812[/C][C]1[/C][C]0.007812[/C][/ROW]
[/TABLE]
Source: https://freestatistics.org/blog/index.php?pk=210815&T=1
Globally Unique Identifier (entire table): ba.freestatistics.org/blog/index.php?pk=210815&T=1
As an alternative you can also use a QR Code:
The GUIDs for individual cells are displayed in the table below:
| Frequency Table (Histogram) | | Bins | Midpoint | Abs. Frequency | Rel. Frequency | Cumul. Rel. Freq. | Density | | [0,1[ | 0.5 | 3 | 0.023438 | 0.023438 | 0.023438 | | [1,2[ | 1.5 | 0 | 0 | 0.023438 | 0 | | [2,3[ | 2.5 | 0 | 0 | 0.023438 | 0 | | [3,4[ | 3.5 | 0 | 0 | 0.023438 | 0 | | [4,5[ | 4.5 | 1 | 0.007812 | 0.03125 | 0.007812 | | [5,6[ | 5.5 | 0 | 0 | 0.03125 | 0 | | [6,7[ | 6.5 | 0 | 0 | 0.03125 | 0 | | [7,8[ | 7.5 | 0 | 0 | 0.03125 | 0 | | [8,9[ | 8.5 | 0 | 0 | 0.03125 | 0 | | [9,10[ | 9.5 | 0 | 0 | 0.03125 | 0 | | [10,11[ | 10.5 | 0 | 0 | 0.03125 | 0 | | [11,12[ | 11.5 | 0 | 0 | 0.03125 | 0 | | [12,13[ | 12.5 | 0 | 0 | 0.03125 | 0 | | [13,14[ | 13.5 | 0 | 0 | 0.03125 | 0 | | [14,15[ | 14.5 | 1 | 0.007812 | 0.039062 | 0.007812 | | [15,16[ | 15.5 | 0 | 0 | 0.039062 | 0 | | [16,17[ | 16.5 | 0 | 0 | 0.039062 | 0 | | [17,18[ | 17.5 | 0 | 0 | 0.039062 | 0 | | [18,19[ | 18.5 | 0 | 0 | 0.039062 | 0 | | [19,20[ | 19.5 | 0 | 0 | 0.039062 | 0 | | [20,21[ | 20.5 | 1 | 0.007812 | 0.046875 | 0.007812 | | [21,22[ | 21.5 | 1 | 0.007812 | 0.054688 | 0.007812 | | [22,23[ | 22.5 | 0 | 0 | 0.054688 | 0 | | [23,24[ | 23.5 | 0 | 0 | 0.054688 | 0 | | [24,25[ | 24.5 | 2 | 0.015625 | 0.070312 | 0.015625 | | [25,26[ | 25.5 | 0 | 0 | 0.070312 | 0 | | [26,27[ | 26.5 | 3 | 0.023438 | 0.09375 | 0.023438 | | [27,28[ | 27.5 | 0 | 0 | 0.09375 | 0 | | [28,29[ | 28.5 | 2 | 0.015625 | 0.109375 | 0.015625 | | [29,30[ | 29.5 | 1 | 0.007812 | 0.117188 | 0.007812 | | [30,31[ | 30.5 | 6 | 0.046875 | 0.164062 | 0.046875 | | [31,32[ | 31.5 | 4 | 0.03125 | 0.195312 | 0.03125 | | [32,33[ | 32.5 | 2 | 0.015625 | 0.210938 | 0.015625 | | [33,34[ | 33.5 | 3 | 0.023438 | 0.234375 | 0.023438 | | [34,35[ | 34.5 | 2 | 0.015625 | 0.25 | 0.015625 | | [35,36[ | 35.5 | 3 | 0.023438 | 0.273438 | 0.023438 | | [36,37[ | 36.5 | 5 | 0.039062 | 0.3125 | 0.039062 | | [37,38[ | 37.5 | 8 | 0.0625 | 0.375 | 0.0625 | | [38,39[ | 38.5 | 2 | 0.015625 | 0.390625 | 0.015625 | | [39,40[ | 39.5 | 2 | 0.015625 | 0.40625 | 0.015625 | | [40,41[ | 40.5 | 4 | 0.03125 | 0.4375 | 0.03125 | | [41,42[ | 41.5 | 6 | 0.046875 | 0.484375 | 0.046875 | | [42,43[ | 42.5 | 9 | 0.070312 | 0.554688 | 0.070312 | | [43,44[ | 43.5 | 4 | 0.03125 | 0.585938 | 0.03125 | | [44,45[ | 44.5 | 5 | 0.039062 | 0.625 | 0.039062 | | [45,46[ | 45.5 | 5 | 0.039062 | 0.664062 | 0.039062 | | [46,47[ | 46.5 | 1 | 0.007812 | 0.671875 | 0.007812 | | [47,48[ | 47.5 | 1 | 0.007812 | 0.679688 | 0.007812 | | [48,49[ | 48.5 | 4 | 0.03125 | 0.710938 | 0.03125 | | [49,50[ | 49.5 | 3 | 0.023438 | 0.734375 | 0.023438 | | [50,51[ | 50.5 | 2 | 0.015625 | 0.75 | 0.015625 | | [51,52[ | 51.5 | 3 | 0.023438 | 0.773438 | 0.023438 | | [52,53[ | 52.5 | 4 | 0.03125 | 0.804688 | 0.03125 | | [53,54[ | 53.5 | 3 | 0.023438 | 0.828125 | 0.023438 | | [54,55[ | 54.5 | 3 | 0.023438 | 0.851562 | 0.023438 | | [55,56[ | 55.5 | 3 | 0.023438 | 0.875 | 0.023438 | | [56,57[ | 56.5 | 4 | 0.03125 | 0.90625 | 0.03125 | | [57,58[ | 57.5 | 1 | 0.007812 | 0.914062 | 0.007812 | | [58,59[ | 58.5 | 0 | 0 | 0.914062 | 0 | | [59,60[ | 59.5 | 3 | 0.023438 | 0.9375 | 0.023438 | | [60,61[ | 60.5 | 1 | 0.007812 | 0.945312 | 0.007812 | | [61,62[ | 61.5 | 1 | 0.007812 | 0.953125 | 0.007812 | | [62,63[ | 62.5 | 0 | 0 | 0.953125 | 0 | | [63,64[ | 63.5 | 2 | 0.015625 | 0.96875 | 0.015625 | | [64,65[ | 64.5 | 0 | 0 | 0.96875 | 0 | | [65,66[ | 65.5 | 1 | 0.007812 | 0.976562 | 0.007812 | | [66,67[ | 66.5 | 2 | 0.015625 | 0.992188 | 0.015625 | | [67,68] | 67.5 | 1 | 0.007812 | 1 | 0.007812 |
If you paste this QR Code into your document, anyone with a smartphone or tablet will be able to scan it and view this table in a browser.
If you paste this QR Code into your document, anyone with a smartphone or tablet will be able to scan it and view this table in a browser.
If you paste this QR Code into your document, anyone with a smartphone or tablet will be able to scan it and view this table in a browser.
If you paste this QR Code into your document, anyone with a smartphone or tablet will be able to scan it and view this table in a browser.
If you paste this QR Code into your document, anyone with a smartphone or tablet will be able to scan it and view this table in a browser.
|