Free Statistics

of Irreproducible Research!

Author's title

Author*Unverified author*
R Software Modulerwasp_autocorrelation.wasp
Title produced by software(Partial) Autocorrelation Function
Date of computationFri, 05 Jul 2013 08:50:19 -0400
Cite this page as followsStatistical Computations at FreeStatistics.org, Office for Research Development and Education, URL https://freestatistics.org/blog/index.php?v=date/2013/Jul/05/t1373028681q6jo0o8a9b7j32n.htm/, Retrieved Mon, 29 Apr 2024 18:08:40 +0000
Statistical Computations at FreeStatistics.org, Office for Research Development and Education, URL https://freestatistics.org/blog/index.php?pk=210783, Retrieved Mon, 29 Apr 2024 18:08:40 +0000
QR Codes:

Original text written by user:
IsPrivate?No (this computation is public)
User-defined keywordsJeroen Biesemans
Estimated Impact184
Family? (F = Feedback message, R = changed R code, M = changed R Module, P = changed Parameters, D = changed Data)
-       [(Partial) Autocorrelation Function] [Tijdreeks 1 stap 21] [2013-07-05 12:50:19] [09688f513f3d2798cb35a3603f8bd204] [Current]
Feedback Forum

Post a new message
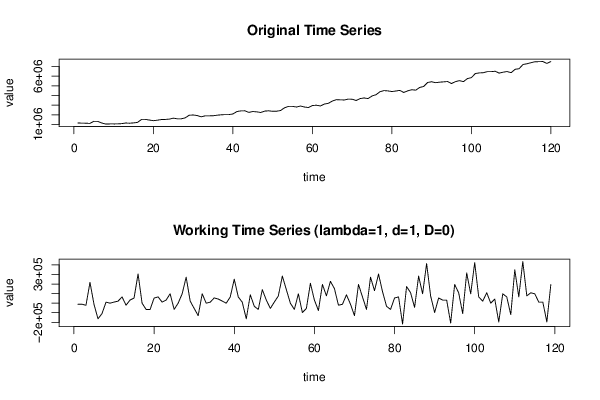
Dataseries X:
1155168
1144638
1133976
1111920
1330188
1318626
1155168
1046484
1056978
1056978
1068672
1089696
1155168
1133976
1166694
1220472
1526400
1526400
1461096
1395624
1449402
1514838
1526400
1559118
1657302
1591836
1591836
1690020
1962198
1984254
1929480
1798572
1896726
1896726
1907256
1962198
2005446
2027502
2027502
2092938
2344086
2409390
2419884
2256426
2344086
2311368
2245902
2387334
2419884
2365110
2376672
2452638
2736510
2877744
2877744
2812440
2910492
2812440
2757528
2965434
2997984
2920992
3117198
3194196
3423126
3575052
3554034
3542334
3629994
3619332
3488592
3684768
3750240
3684768
3956946
4087854
4392612
4512858
4480272
4414800
4469610
4535046
4316646
4490766
4600518
4556238
4839942
4937958
5352606
5428566
5330544
5385324
5418042
5450760
5242854
5439066
5547744
5439066
5755650
5853708
6278808
6344280
6365304
6475020
6475020
6518268
6322056
6420246
6485550
6365304
6714474
6779916
7215582
7292580
7401258
7499448
7509942
7521504
7325298
7521504


Summary of computational transaction
Raw Inputview raw input (R code)
Raw Outputview raw output of R engine
Computing time3 seconds
R Server'Sir Maurice George Kendall' @ kendall.wessa.net

\begin{tabular}{lllllllll}
\hline
Summary of computational transaction \tabularnewline
Raw Input & view raw input (R code)  \tabularnewline
Raw Output & view raw output of R engine  \tabularnewline
Computing time & 3 seconds \tabularnewline
R Server & 'Sir Maurice George Kendall' @ kendall.wessa.net \tabularnewline
\hline
\end{tabular}
%Source: https://freestatistics.org/blog/index.php?pk=210783&T=0

[TABLE]
[ROW][C]Summary of computational transaction[/C][/ROW]
[ROW][C]Raw Input[/C][C]view raw input (R code) [/C][/ROW]
[ROW][C]Raw Output[/C][C]view raw output of R engine [/C][/ROW]
[ROW][C]Computing time[/C][C]3 seconds[/C][/ROW]
[ROW][C]R Server[/C][C]'Sir Maurice George Kendall' @ kendall.wessa.net[/C][/ROW]
[/TABLE]
Source: https://freestatistics.org/blog/index.php?pk=210783&T=0

Globally Unique Identifier (entire table): ba.freestatistics.org/blog/index.php?pk=210783&T=0

As an alternative you can also use a QR Code:  

The GUIDs for individual cells are displayed in the table below:

Summary of computational transaction
Raw Inputview raw input (R code)
Raw Outputview raw output of R engine
Computing time3 seconds
R Server'Sir Maurice George Kendall' @ kendall.wessa.net


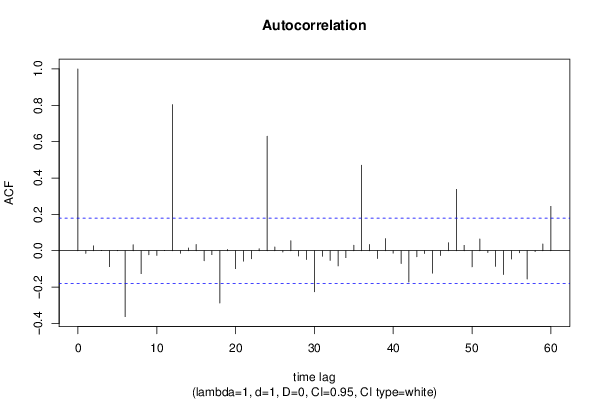
Autocorrelation Function
Time lag kACF(k)T-STATP-value
1-0.014627-0.15960.436749
20.0264420.28840.386753
30.0011250.01230.495114
4-0.087593-0.95550.170625
50.0018350.020.492032
6-0.3629-3.95886.4e-05
70.0332190.36240.358858
8-0.126057-1.37510.085839
9-0.022567-0.24620.402984
10-0.025881-0.28230.38909
110.0012080.01320.494752
120.803778.76810
13-0.013925-0.15190.439759
140.0145790.1590.436955
150.0342160.37330.354811
16-0.055765-0.60830.272065
17-0.021585-0.23550.407125
18-0.288234-3.14430.001051
190.0067260.07340.470817
20-0.098668-1.07630.141975
21-0.057543-0.62770.265695
22-0.044121-0.48130.315593
230.0108760.11860.452881
240.6293916.86580
250.0199280.21740.414141
26-0.00704-0.07680.469458
270.0545660.59520.276406
28-0.028791-0.31410.377009
29-0.048223-0.5260.299917
30-0.225764-2.46280.007609
31-0.030162-0.3290.371355
32-0.053341-0.58190.280872
33-0.083727-0.91340.181452
34-0.038177-0.41650.338911
350.0303920.33150.370411
360.4700265.12741e-06
370.0338830.36960.35616
38-0.043313-0.47250.31872
390.0664680.72510.234915
40-0.013455-0.14680.441778
41-0.070124-0.7650.222903
42-0.17248-1.88150.031171
43-0.032952-0.35950.359942
44-0.01502-0.16380.435065
45-0.123415-1.34630.090382
46-0.026288-0.28680.387394
470.0440590.48060.315833
480.3372943.67940.000176
490.0292830.31940.374978
50-0.088875-0.96950.167127
510.0642030.70040.242532
52-0.009555-0.10420.458579
53-0.086186-0.94020.174515
54-0.130714-1.42590.078254
55-0.045865-0.50030.308884
56-0.011203-0.12220.451468
57-0.155568-1.69710.04615
58-0.005-0.05450.478297
590.0371610.40540.342965
600.2439892.66160.004426

\begin{tabular}{lllllllll}
\hline
Autocorrelation Function \tabularnewline
Time lag k & ACF(k) & T-STAT & P-value \tabularnewline
1 & -0.014627 & -0.1596 & 0.436749 \tabularnewline
2 & 0.026442 & 0.2884 & 0.386753 \tabularnewline
3 & 0.001125 & 0.0123 & 0.495114 \tabularnewline
4 & -0.087593 & -0.9555 & 0.170625 \tabularnewline
5 & 0.001835 & 0.02 & 0.492032 \tabularnewline
6 & -0.3629 & -3.9588 & 6.4e-05 \tabularnewline
7 & 0.033219 & 0.3624 & 0.358858 \tabularnewline
8 & -0.126057 & -1.3751 & 0.085839 \tabularnewline
9 & -0.022567 & -0.2462 & 0.402984 \tabularnewline
10 & -0.025881 & -0.2823 & 0.38909 \tabularnewline
11 & 0.001208 & 0.0132 & 0.494752 \tabularnewline
12 & 0.80377 & 8.7681 & 0 \tabularnewline
13 & -0.013925 & -0.1519 & 0.439759 \tabularnewline
14 & 0.014579 & 0.159 & 0.436955 \tabularnewline
15 & 0.034216 & 0.3733 & 0.354811 \tabularnewline
16 & -0.055765 & -0.6083 & 0.272065 \tabularnewline
17 & -0.021585 & -0.2355 & 0.407125 \tabularnewline
18 & -0.288234 & -3.1443 & 0.001051 \tabularnewline
19 & 0.006726 & 0.0734 & 0.470817 \tabularnewline
20 & -0.098668 & -1.0763 & 0.141975 \tabularnewline
21 & -0.057543 & -0.6277 & 0.265695 \tabularnewline
22 & -0.044121 & -0.4813 & 0.315593 \tabularnewline
23 & 0.010876 & 0.1186 & 0.452881 \tabularnewline
24 & 0.629391 & 6.8658 & 0 \tabularnewline
25 & 0.019928 & 0.2174 & 0.414141 \tabularnewline
26 & -0.00704 & -0.0768 & 0.469458 \tabularnewline
27 & 0.054566 & 0.5952 & 0.276406 \tabularnewline
28 & -0.028791 & -0.3141 & 0.377009 \tabularnewline
29 & -0.048223 & -0.526 & 0.299917 \tabularnewline
30 & -0.225764 & -2.4628 & 0.007609 \tabularnewline
31 & -0.030162 & -0.329 & 0.371355 \tabularnewline
32 & -0.053341 & -0.5819 & 0.280872 \tabularnewline
33 & -0.083727 & -0.9134 & 0.181452 \tabularnewline
34 & -0.038177 & -0.4165 & 0.338911 \tabularnewline
35 & 0.030392 & 0.3315 & 0.370411 \tabularnewline
36 & 0.470026 & 5.1274 & 1e-06 \tabularnewline
37 & 0.033883 & 0.3696 & 0.35616 \tabularnewline
38 & -0.043313 & -0.4725 & 0.31872 \tabularnewline
39 & 0.066468 & 0.7251 & 0.234915 \tabularnewline
40 & -0.013455 & -0.1468 & 0.441778 \tabularnewline
41 & -0.070124 & -0.765 & 0.222903 \tabularnewline
42 & -0.17248 & -1.8815 & 0.031171 \tabularnewline
43 & -0.032952 & -0.3595 & 0.359942 \tabularnewline
44 & -0.01502 & -0.1638 & 0.435065 \tabularnewline
45 & -0.123415 & -1.3463 & 0.090382 \tabularnewline
46 & -0.026288 & -0.2868 & 0.387394 \tabularnewline
47 & 0.044059 & 0.4806 & 0.315833 \tabularnewline
48 & 0.337294 & 3.6794 & 0.000176 \tabularnewline
49 & 0.029283 & 0.3194 & 0.374978 \tabularnewline
50 & -0.088875 & -0.9695 & 0.167127 \tabularnewline
51 & 0.064203 & 0.7004 & 0.242532 \tabularnewline
52 & -0.009555 & -0.1042 & 0.458579 \tabularnewline
53 & -0.086186 & -0.9402 & 0.174515 \tabularnewline
54 & -0.130714 & -1.4259 & 0.078254 \tabularnewline
55 & -0.045865 & -0.5003 & 0.308884 \tabularnewline
56 & -0.011203 & -0.1222 & 0.451468 \tabularnewline
57 & -0.155568 & -1.6971 & 0.04615 \tabularnewline
58 & -0.005 & -0.0545 & 0.478297 \tabularnewline
59 & 0.037161 & 0.4054 & 0.342965 \tabularnewline
60 & 0.243989 & 2.6616 & 0.004426 \tabularnewline
\hline
\end{tabular}
%Source: https://freestatistics.org/blog/index.php?pk=210783&T=1

[TABLE]
[ROW][C]Autocorrelation Function[/C][/ROW]
[ROW][C]Time lag k[/C][C]ACF(k)[/C][C]T-STAT[/C][C]P-value[/C][/ROW]
[ROW][C]1[/C][C]-0.014627[/C][C]-0.1596[/C][C]0.436749[/C][/ROW]
[ROW][C]2[/C][C]0.026442[/C][C]0.2884[/C][C]0.386753[/C][/ROW]
[ROW][C]3[/C][C]0.001125[/C][C]0.0123[/C][C]0.495114[/C][/ROW]
[ROW][C]4[/C][C]-0.087593[/C][C]-0.9555[/C][C]0.170625[/C][/ROW]
[ROW][C]5[/C][C]0.001835[/C][C]0.02[/C][C]0.492032[/C][/ROW]
[ROW][C]6[/C][C]-0.3629[/C][C]-3.9588[/C][C]6.4e-05[/C][/ROW]
[ROW][C]7[/C][C]0.033219[/C][C]0.3624[/C][C]0.358858[/C][/ROW]
[ROW][C]8[/C][C]-0.126057[/C][C]-1.3751[/C][C]0.085839[/C][/ROW]
[ROW][C]9[/C][C]-0.022567[/C][C]-0.2462[/C][C]0.402984[/C][/ROW]
[ROW][C]10[/C][C]-0.025881[/C][C]-0.2823[/C][C]0.38909[/C][/ROW]
[ROW][C]11[/C][C]0.001208[/C][C]0.0132[/C][C]0.494752[/C][/ROW]
[ROW][C]12[/C][C]0.80377[/C][C]8.7681[/C][C]0[/C][/ROW]
[ROW][C]13[/C][C]-0.013925[/C][C]-0.1519[/C][C]0.439759[/C][/ROW]
[ROW][C]14[/C][C]0.014579[/C][C]0.159[/C][C]0.436955[/C][/ROW]
[ROW][C]15[/C][C]0.034216[/C][C]0.3733[/C][C]0.354811[/C][/ROW]
[ROW][C]16[/C][C]-0.055765[/C][C]-0.6083[/C][C]0.272065[/C][/ROW]
[ROW][C]17[/C][C]-0.021585[/C][C]-0.2355[/C][C]0.407125[/C][/ROW]
[ROW][C]18[/C][C]-0.288234[/C][C]-3.1443[/C][C]0.001051[/C][/ROW]
[ROW][C]19[/C][C]0.006726[/C][C]0.0734[/C][C]0.470817[/C][/ROW]
[ROW][C]20[/C][C]-0.098668[/C][C]-1.0763[/C][C]0.141975[/C][/ROW]
[ROW][C]21[/C][C]-0.057543[/C][C]-0.6277[/C][C]0.265695[/C][/ROW]
[ROW][C]22[/C][C]-0.044121[/C][C]-0.4813[/C][C]0.315593[/C][/ROW]
[ROW][C]23[/C][C]0.010876[/C][C]0.1186[/C][C]0.452881[/C][/ROW]
[ROW][C]24[/C][C]0.629391[/C][C]6.8658[/C][C]0[/C][/ROW]
[ROW][C]25[/C][C]0.019928[/C][C]0.2174[/C][C]0.414141[/C][/ROW]
[ROW][C]26[/C][C]-0.00704[/C][C]-0.0768[/C][C]0.469458[/C][/ROW]
[ROW][C]27[/C][C]0.054566[/C][C]0.5952[/C][C]0.276406[/C][/ROW]
[ROW][C]28[/C][C]-0.028791[/C][C]-0.3141[/C][C]0.377009[/C][/ROW]
[ROW][C]29[/C][C]-0.048223[/C][C]-0.526[/C][C]0.299917[/C][/ROW]
[ROW][C]30[/C][C]-0.225764[/C][C]-2.4628[/C][C]0.007609[/C][/ROW]
[ROW][C]31[/C][C]-0.030162[/C][C]-0.329[/C][C]0.371355[/C][/ROW]
[ROW][C]32[/C][C]-0.053341[/C][C]-0.5819[/C][C]0.280872[/C][/ROW]
[ROW][C]33[/C][C]-0.083727[/C][C]-0.9134[/C][C]0.181452[/C][/ROW]
[ROW][C]34[/C][C]-0.038177[/C][C]-0.4165[/C][C]0.338911[/C][/ROW]
[ROW][C]35[/C][C]0.030392[/C][C]0.3315[/C][C]0.370411[/C][/ROW]
[ROW][C]36[/C][C]0.470026[/C][C]5.1274[/C][C]1e-06[/C][/ROW]
[ROW][C]37[/C][C]0.033883[/C][C]0.3696[/C][C]0.35616[/C][/ROW]
[ROW][C]38[/C][C]-0.043313[/C][C]-0.4725[/C][C]0.31872[/C][/ROW]
[ROW][C]39[/C][C]0.066468[/C][C]0.7251[/C][C]0.234915[/C][/ROW]
[ROW][C]40[/C][C]-0.013455[/C][C]-0.1468[/C][C]0.441778[/C][/ROW]
[ROW][C]41[/C][C]-0.070124[/C][C]-0.765[/C][C]0.222903[/C][/ROW]
[ROW][C]42[/C][C]-0.17248[/C][C]-1.8815[/C][C]0.031171[/C][/ROW]
[ROW][C]43[/C][C]-0.032952[/C][C]-0.3595[/C][C]0.359942[/C][/ROW]
[ROW][C]44[/C][C]-0.01502[/C][C]-0.1638[/C][C]0.435065[/C][/ROW]
[ROW][C]45[/C][C]-0.123415[/C][C]-1.3463[/C][C]0.090382[/C][/ROW]
[ROW][C]46[/C][C]-0.026288[/C][C]-0.2868[/C][C]0.387394[/C][/ROW]
[ROW][C]47[/C][C]0.044059[/C][C]0.4806[/C][C]0.315833[/C][/ROW]
[ROW][C]48[/C][C]0.337294[/C][C]3.6794[/C][C]0.000176[/C][/ROW]
[ROW][C]49[/C][C]0.029283[/C][C]0.3194[/C][C]0.374978[/C][/ROW]
[ROW][C]50[/C][C]-0.088875[/C][C]-0.9695[/C][C]0.167127[/C][/ROW]
[ROW][C]51[/C][C]0.064203[/C][C]0.7004[/C][C]0.242532[/C][/ROW]
[ROW][C]52[/C][C]-0.009555[/C][C]-0.1042[/C][C]0.458579[/C][/ROW]
[ROW][C]53[/C][C]-0.086186[/C][C]-0.9402[/C][C]0.174515[/C][/ROW]
[ROW][C]54[/C][C]-0.130714[/C][C]-1.4259[/C][C]0.078254[/C][/ROW]
[ROW][C]55[/C][C]-0.045865[/C][C]-0.5003[/C][C]0.308884[/C][/ROW]
[ROW][C]56[/C][C]-0.011203[/C][C]-0.1222[/C][C]0.451468[/C][/ROW]
[ROW][C]57[/C][C]-0.155568[/C][C]-1.6971[/C][C]0.04615[/C][/ROW]
[ROW][C]58[/C][C]-0.005[/C][C]-0.0545[/C][C]0.478297[/C][/ROW]
[ROW][C]59[/C][C]0.037161[/C][C]0.4054[/C][C]0.342965[/C][/ROW]
[ROW][C]60[/C][C]0.243989[/C][C]2.6616[/C][C]0.004426[/C][/ROW]
[/TABLE]
Source: https://freestatistics.org/blog/index.php?pk=210783&T=1

Globally Unique Identifier (entire table): ba.freestatistics.org/blog/index.php?pk=210783&T=1

As an alternative you can also use a QR Code:  

The GUIDs for individual cells are displayed in the table below:

Autocorrelation Function
Time lag kACF(k)T-STATP-value
1-0.014627-0.15960.436749
20.0264420.28840.386753
30.0011250.01230.495114
4-0.087593-0.95550.170625
50.0018350.020.492032
6-0.3629-3.95886.4e-05
70.0332190.36240.358858
8-0.126057-1.37510.085839
9-0.022567-0.24620.402984
10-0.025881-0.28230.38909
110.0012080.01320.494752
120.803778.76810
13-0.013925-0.15190.439759
140.0145790.1590.436955
150.0342160.37330.354811
16-0.055765-0.60830.272065
17-0.021585-0.23550.407125
18-0.288234-3.14430.001051
190.0067260.07340.470817
20-0.098668-1.07630.141975
21-0.057543-0.62770.265695
22-0.044121-0.48130.315593
230.0108760.11860.452881
240.6293916.86580
250.0199280.21740.414141
26-0.00704-0.07680.469458
270.0545660.59520.276406
28-0.028791-0.31410.377009
29-0.048223-0.5260.299917
30-0.225764-2.46280.007609
31-0.030162-0.3290.371355
32-0.053341-0.58190.280872
33-0.083727-0.91340.181452
34-0.038177-0.41650.338911
350.0303920.33150.370411
360.4700265.12741e-06
370.0338830.36960.35616
38-0.043313-0.47250.31872
390.0664680.72510.234915
40-0.013455-0.14680.441778
41-0.070124-0.7650.222903
42-0.17248-1.88150.031171
43-0.032952-0.35950.359942
44-0.01502-0.16380.435065
45-0.123415-1.34630.090382
46-0.026288-0.28680.387394
470.0440590.48060.315833
480.3372943.67940.000176
490.0292830.31940.374978
50-0.088875-0.96950.167127
510.0642030.70040.242532
52-0.009555-0.10420.458579
53-0.086186-0.94020.174515
54-0.130714-1.42590.078254
55-0.045865-0.50030.308884
56-0.011203-0.12220.451468
57-0.155568-1.69710.04615
58-0.005-0.05450.478297
590.0371610.40540.342965
600.2439892.66160.004426


Partial Autocorrelation Function
Time lag kPACF(k)T-STATP-value
1-0.014627-0.15960.436749
20.0262340.28620.387621
30.0018870.02060.491805
4-0.088323-0.96350.168627
5-0.00075-0.00820.496744
6-0.361189-3.94016.9e-05
70.0266980.29120.385687
8-0.1439-1.56980.059563
9-0.027005-0.29460.38441
10-0.110665-1.20720.114872
110.0023990.02620.489582
120.7698338.39790
130.0390930.42640.335275
14-0.157368-1.71670.044319
150.0358490.39110.348223
160.0104580.11410.454682
17-0.012306-0.13420.446718
180.1507181.64410.051393
19-0.131131-1.43050.077602
200.0779160.850.198525
210.0041510.04530.48198
22-0.009725-0.10610.457844
230.0163770.17870.429257
24-0.031502-0.34370.365858
250.0572220.62420.266841
260.0271350.2960.383869
27-0.078098-0.85190.197978
280.0477140.52050.301842
29-0.046967-0.51230.304679
30-0.011936-0.13020.44831
31-0.014163-0.15450.438739
320.0325270.35480.361672
330.0063960.06980.472247
340.0501230.54680.292779
350.0115440.12590.450002
36-0.065548-0.7150.237989
37-0.057205-0.6240.2669
38-0.020567-0.22440.41143
39-0.016994-0.18540.42662
400.0218090.23790.40618
41-0.029212-0.31870.375268
42-0.00739-0.08060.46794
430.0652320.71160.239053
44-0.001472-0.01610.493608
45-0.098405-1.07350.142616
460.0101440.11070.456038
470.0052420.05720.477248
48-0.02503-0.2730.392645
49-0.029964-0.32690.372169
50-0.109988-1.19980.116295
51-0.036426-0.39740.345905
520.027930.30470.380572
53-0.033944-0.37030.355915
54-0.00661-0.07210.471321
55-0.069591-0.75910.224634
56-0.086259-0.9410.174313
57-0.018158-0.19810.421661
58-0.001059-0.01160.495401
59-0.085149-0.92890.177419
60-0.001381-0.01510.494005

\begin{tabular}{lllllllll}
\hline
Partial Autocorrelation Function \tabularnewline
Time lag k & PACF(k) & T-STAT & P-value \tabularnewline
1 & -0.014627 & -0.1596 & 0.436749 \tabularnewline
2 & 0.026234 & 0.2862 & 0.387621 \tabularnewline
3 & 0.001887 & 0.0206 & 0.491805 \tabularnewline
4 & -0.088323 & -0.9635 & 0.168627 \tabularnewline
5 & -0.00075 & -0.0082 & 0.496744 \tabularnewline
6 & -0.361189 & -3.9401 & 6.9e-05 \tabularnewline
7 & 0.026698 & 0.2912 & 0.385687 \tabularnewline
8 & -0.1439 & -1.5698 & 0.059563 \tabularnewline
9 & -0.027005 & -0.2946 & 0.38441 \tabularnewline
10 & -0.110665 & -1.2072 & 0.114872 \tabularnewline
11 & 0.002399 & 0.0262 & 0.489582 \tabularnewline
12 & 0.769833 & 8.3979 & 0 \tabularnewline
13 & 0.039093 & 0.4264 & 0.335275 \tabularnewline
14 & -0.157368 & -1.7167 & 0.044319 \tabularnewline
15 & 0.035849 & 0.3911 & 0.348223 \tabularnewline
16 & 0.010458 & 0.1141 & 0.454682 \tabularnewline
17 & -0.012306 & -0.1342 & 0.446718 \tabularnewline
18 & 0.150718 & 1.6441 & 0.051393 \tabularnewline
19 & -0.131131 & -1.4305 & 0.077602 \tabularnewline
20 & 0.077916 & 0.85 & 0.198525 \tabularnewline
21 & 0.004151 & 0.0453 & 0.48198 \tabularnewline
22 & -0.009725 & -0.1061 & 0.457844 \tabularnewline
23 & 0.016377 & 0.1787 & 0.429257 \tabularnewline
24 & -0.031502 & -0.3437 & 0.365858 \tabularnewline
25 & 0.057222 & 0.6242 & 0.266841 \tabularnewline
26 & 0.027135 & 0.296 & 0.383869 \tabularnewline
27 & -0.078098 & -0.8519 & 0.197978 \tabularnewline
28 & 0.047714 & 0.5205 & 0.301842 \tabularnewline
29 & -0.046967 & -0.5123 & 0.304679 \tabularnewline
30 & -0.011936 & -0.1302 & 0.44831 \tabularnewline
31 & -0.014163 & -0.1545 & 0.438739 \tabularnewline
32 & 0.032527 & 0.3548 & 0.361672 \tabularnewline
33 & 0.006396 & 0.0698 & 0.472247 \tabularnewline
34 & 0.050123 & 0.5468 & 0.292779 \tabularnewline
35 & 0.011544 & 0.1259 & 0.450002 \tabularnewline
36 & -0.065548 & -0.715 & 0.237989 \tabularnewline
37 & -0.057205 & -0.624 & 0.2669 \tabularnewline
38 & -0.020567 & -0.2244 & 0.41143 \tabularnewline
39 & -0.016994 & -0.1854 & 0.42662 \tabularnewline
40 & 0.021809 & 0.2379 & 0.40618 \tabularnewline
41 & -0.029212 & -0.3187 & 0.375268 \tabularnewline
42 & -0.00739 & -0.0806 & 0.46794 \tabularnewline
43 & 0.065232 & 0.7116 & 0.239053 \tabularnewline
44 & -0.001472 & -0.0161 & 0.493608 \tabularnewline
45 & -0.098405 & -1.0735 & 0.142616 \tabularnewline
46 & 0.010144 & 0.1107 & 0.456038 \tabularnewline
47 & 0.005242 & 0.0572 & 0.477248 \tabularnewline
48 & -0.02503 & -0.273 & 0.392645 \tabularnewline
49 & -0.029964 & -0.3269 & 0.372169 \tabularnewline
50 & -0.109988 & -1.1998 & 0.116295 \tabularnewline
51 & -0.036426 & -0.3974 & 0.345905 \tabularnewline
52 & 0.02793 & 0.3047 & 0.380572 \tabularnewline
53 & -0.033944 & -0.3703 & 0.355915 \tabularnewline
54 & -0.00661 & -0.0721 & 0.471321 \tabularnewline
55 & -0.069591 & -0.7591 & 0.224634 \tabularnewline
56 & -0.086259 & -0.941 & 0.174313 \tabularnewline
57 & -0.018158 & -0.1981 & 0.421661 \tabularnewline
58 & -0.001059 & -0.0116 & 0.495401 \tabularnewline
59 & -0.085149 & -0.9289 & 0.177419 \tabularnewline
60 & -0.001381 & -0.0151 & 0.494005 \tabularnewline
\hline
\end{tabular}
%Source: https://freestatistics.org/blog/index.php?pk=210783&T=2

[TABLE]
[ROW][C]Partial Autocorrelation Function[/C][/ROW]
[ROW][C]Time lag k[/C][C]PACF(k)[/C][C]T-STAT[/C][C]P-value[/C][/ROW]
[ROW][C]1[/C][C]-0.014627[/C][C]-0.1596[/C][C]0.436749[/C][/ROW]
[ROW][C]2[/C][C]0.026234[/C][C]0.2862[/C][C]0.387621[/C][/ROW]
[ROW][C]3[/C][C]0.001887[/C][C]0.0206[/C][C]0.491805[/C][/ROW]
[ROW][C]4[/C][C]-0.088323[/C][C]-0.9635[/C][C]0.168627[/C][/ROW]
[ROW][C]5[/C][C]-0.00075[/C][C]-0.0082[/C][C]0.496744[/C][/ROW]
[ROW][C]6[/C][C]-0.361189[/C][C]-3.9401[/C][C]6.9e-05[/C][/ROW]
[ROW][C]7[/C][C]0.026698[/C][C]0.2912[/C][C]0.385687[/C][/ROW]
[ROW][C]8[/C][C]-0.1439[/C][C]-1.5698[/C][C]0.059563[/C][/ROW]
[ROW][C]9[/C][C]-0.027005[/C][C]-0.2946[/C][C]0.38441[/C][/ROW]
[ROW][C]10[/C][C]-0.110665[/C][C]-1.2072[/C][C]0.114872[/C][/ROW]
[ROW][C]11[/C][C]0.002399[/C][C]0.0262[/C][C]0.489582[/C][/ROW]
[ROW][C]12[/C][C]0.769833[/C][C]8.3979[/C][C]0[/C][/ROW]
[ROW][C]13[/C][C]0.039093[/C][C]0.4264[/C][C]0.335275[/C][/ROW]
[ROW][C]14[/C][C]-0.157368[/C][C]-1.7167[/C][C]0.044319[/C][/ROW]
[ROW][C]15[/C][C]0.035849[/C][C]0.3911[/C][C]0.348223[/C][/ROW]
[ROW][C]16[/C][C]0.010458[/C][C]0.1141[/C][C]0.454682[/C][/ROW]
[ROW][C]17[/C][C]-0.012306[/C][C]-0.1342[/C][C]0.446718[/C][/ROW]
[ROW][C]18[/C][C]0.150718[/C][C]1.6441[/C][C]0.051393[/C][/ROW]
[ROW][C]19[/C][C]-0.131131[/C][C]-1.4305[/C][C]0.077602[/C][/ROW]
[ROW][C]20[/C][C]0.077916[/C][C]0.85[/C][C]0.198525[/C][/ROW]
[ROW][C]21[/C][C]0.004151[/C][C]0.0453[/C][C]0.48198[/C][/ROW]
[ROW][C]22[/C][C]-0.009725[/C][C]-0.1061[/C][C]0.457844[/C][/ROW]
[ROW][C]23[/C][C]0.016377[/C][C]0.1787[/C][C]0.429257[/C][/ROW]
[ROW][C]24[/C][C]-0.031502[/C][C]-0.3437[/C][C]0.365858[/C][/ROW]
[ROW][C]25[/C][C]0.057222[/C][C]0.6242[/C][C]0.266841[/C][/ROW]
[ROW][C]26[/C][C]0.027135[/C][C]0.296[/C][C]0.383869[/C][/ROW]
[ROW][C]27[/C][C]-0.078098[/C][C]-0.8519[/C][C]0.197978[/C][/ROW]
[ROW][C]28[/C][C]0.047714[/C][C]0.5205[/C][C]0.301842[/C][/ROW]
[ROW][C]29[/C][C]-0.046967[/C][C]-0.5123[/C][C]0.304679[/C][/ROW]
[ROW][C]30[/C][C]-0.011936[/C][C]-0.1302[/C][C]0.44831[/C][/ROW]
[ROW][C]31[/C][C]-0.014163[/C][C]-0.1545[/C][C]0.438739[/C][/ROW]
[ROW][C]32[/C][C]0.032527[/C][C]0.3548[/C][C]0.361672[/C][/ROW]
[ROW][C]33[/C][C]0.006396[/C][C]0.0698[/C][C]0.472247[/C][/ROW]
[ROW][C]34[/C][C]0.050123[/C][C]0.5468[/C][C]0.292779[/C][/ROW]
[ROW][C]35[/C][C]0.011544[/C][C]0.1259[/C][C]0.450002[/C][/ROW]
[ROW][C]36[/C][C]-0.065548[/C][C]-0.715[/C][C]0.237989[/C][/ROW]
[ROW][C]37[/C][C]-0.057205[/C][C]-0.624[/C][C]0.2669[/C][/ROW]
[ROW][C]38[/C][C]-0.020567[/C][C]-0.2244[/C][C]0.41143[/C][/ROW]
[ROW][C]39[/C][C]-0.016994[/C][C]-0.1854[/C][C]0.42662[/C][/ROW]
[ROW][C]40[/C][C]0.021809[/C][C]0.2379[/C][C]0.40618[/C][/ROW]
[ROW][C]41[/C][C]-0.029212[/C][C]-0.3187[/C][C]0.375268[/C][/ROW]
[ROW][C]42[/C][C]-0.00739[/C][C]-0.0806[/C][C]0.46794[/C][/ROW]
[ROW][C]43[/C][C]0.065232[/C][C]0.7116[/C][C]0.239053[/C][/ROW]
[ROW][C]44[/C][C]-0.001472[/C][C]-0.0161[/C][C]0.493608[/C][/ROW]
[ROW][C]45[/C][C]-0.098405[/C][C]-1.0735[/C][C]0.142616[/C][/ROW]
[ROW][C]46[/C][C]0.010144[/C][C]0.1107[/C][C]0.456038[/C][/ROW]
[ROW][C]47[/C][C]0.005242[/C][C]0.0572[/C][C]0.477248[/C][/ROW]
[ROW][C]48[/C][C]-0.02503[/C][C]-0.273[/C][C]0.392645[/C][/ROW]
[ROW][C]49[/C][C]-0.029964[/C][C]-0.3269[/C][C]0.372169[/C][/ROW]
[ROW][C]50[/C][C]-0.109988[/C][C]-1.1998[/C][C]0.116295[/C][/ROW]
[ROW][C]51[/C][C]-0.036426[/C][C]-0.3974[/C][C]0.345905[/C][/ROW]
[ROW][C]52[/C][C]0.02793[/C][C]0.3047[/C][C]0.380572[/C][/ROW]
[ROW][C]53[/C][C]-0.033944[/C][C]-0.3703[/C][C]0.355915[/C][/ROW]
[ROW][C]54[/C][C]-0.00661[/C][C]-0.0721[/C][C]0.471321[/C][/ROW]
[ROW][C]55[/C][C]-0.069591[/C][C]-0.7591[/C][C]0.224634[/C][/ROW]
[ROW][C]56[/C][C]-0.086259[/C][C]-0.941[/C][C]0.174313[/C][/ROW]
[ROW][C]57[/C][C]-0.018158[/C][C]-0.1981[/C][C]0.421661[/C][/ROW]
[ROW][C]58[/C][C]-0.001059[/C][C]-0.0116[/C][C]0.495401[/C][/ROW]
[ROW][C]59[/C][C]-0.085149[/C][C]-0.9289[/C][C]0.177419[/C][/ROW]
[ROW][C]60[/C][C]-0.001381[/C][C]-0.0151[/C][C]0.494005[/C][/ROW]
[/TABLE]
Source: https://freestatistics.org/blog/index.php?pk=210783&T=2

Globally Unique Identifier (entire table): ba.freestatistics.org/blog/index.php?pk=210783&T=2

As an alternative you can also use a QR Code:  

The GUIDs for individual cells are displayed in the table below:

Partial Autocorrelation Function
Time lag kPACF(k)T-STATP-value
1-0.014627-0.15960.436749
20.0262340.28620.387621
30.0018870.02060.491805
4-0.088323-0.96350.168627
5-0.00075-0.00820.496744
6-0.361189-3.94016.9e-05
70.0266980.29120.385687
8-0.1439-1.56980.059563
9-0.027005-0.29460.38441
10-0.110665-1.20720.114872
110.0023990.02620.489582
120.7698338.39790
130.0390930.42640.335275
14-0.157368-1.71670.044319
150.0358490.39110.348223
160.0104580.11410.454682
17-0.012306-0.13420.446718
180.1507181.64410.051393
19-0.131131-1.43050.077602
200.0779160.850.198525
210.0041510.04530.48198
22-0.009725-0.10610.457844
230.0163770.17870.429257
24-0.031502-0.34370.365858
250.0572220.62420.266841
260.0271350.2960.383869
27-0.078098-0.85190.197978
280.0477140.52050.301842
29-0.046967-0.51230.304679
30-0.011936-0.13020.44831
31-0.014163-0.15450.438739
320.0325270.35480.361672
330.0063960.06980.472247
340.0501230.54680.292779
350.0115440.12590.450002
36-0.065548-0.7150.237989
37-0.057205-0.6240.2669
38-0.020567-0.22440.41143
39-0.016994-0.18540.42662
400.0218090.23790.40618
41-0.029212-0.31870.375268
42-0.00739-0.08060.46794
430.0652320.71160.239053
44-0.001472-0.01610.493608
45-0.098405-1.07350.142616
460.0101440.11070.456038
470.0052420.05720.477248
48-0.02503-0.2730.392645
49-0.029964-0.32690.372169
50-0.109988-1.19980.116295
51-0.036426-0.39740.345905
520.027930.30470.380572
53-0.033944-0.37030.355915
54-0.00661-0.07210.471321
55-0.069591-0.75910.224634
56-0.086259-0.9410.174313
57-0.018158-0.19810.421661
58-0.001059-0.01160.495401
59-0.085149-0.92890.177419
60-0.001381-0.01510.494005


Parameters (Session):
par1 = 60 ; par2 = 1 ; par3 = 1 ; par4 = 0 ; par5 = 12 ; par6 = White Noise ; par7 = 0.95 ;
Parameters (R input):
par1 = 60 ; par2 = 1 ; par3 = 1 ; par4 = 0 ; par5 = 12 ; par6 = White Noise ; par7 = 0.95 ; par8 = ;
R code (references can be found in the software module):
par8 <- ''
par7 <- '0.95'
par6 <- 'White Noise'
par5 <- '12'
par4 <- '0'
par3 <- '0'
par2 <- '1'
par1 <- '60'
if (par1 == 'Default') {
par1 = 10*log10(length(x))
} else {
par1 <- as.numeric(par1)
}
par2 <- as.numeric(par2)
par3 <- as.numeric(par3)
par4 <- as.numeric(par4)
par5 <- as.numeric(par5)
if (par6 == 'White Noise') par6 <- 'white' else par6 <- 'ma'
par7 <- as.numeric(par7)
if (par8 != '') par8 <- as.numeric(par8)
ox <- x
if (par8 == '') {
if (par2 == 0) {
x <- log(x)
} else {
x <- (x ^ par2 - 1) / par2
}
} else {
x <- log(x,base=par8)
}
if (par3 > 0) x <- diff(x,lag=1,difference=par3)
if (par4 > 0) x <- diff(x,lag=par5,difference=par4)
bitmap(file='picts.png')
op <- par(mfrow=c(2,1))
plot(ox,type='l',main='Original Time Series',xlab='time',ylab='value')
if (par8=='') {
mytitle <- paste('Working Time Series (lambda=',par2,', d=',par3,', D=',par4,')',sep='')
mysub <- paste('(lambda=',par2,', d=',par3,', D=',par4,', CI=', par7, ', CI type=',par6,')',sep='')
} else {
mytitle <- paste('Working Time Series (base=',par8,', d=',par3,', D=',par4,')',sep='')
mysub <- paste('(base=',par8,', d=',par3,', D=',par4,', CI=', par7, ', CI type=',par6,')',sep='')
}
plot(x,type='l', main=mytitle,xlab='time',ylab='value')
par(op)
dev.off()
bitmap(file='pic1.png')
racf <- acf(x, par1, main='Autocorrelation', xlab='time lag', ylab='ACF', ci.type=par6, ci=par7, sub=mysub)
dev.off()
bitmap(file='pic2.png')
rpacf <- pacf(x,par1,main='Partial Autocorrelation',xlab='lags',ylab='PACF',sub=mysub)
dev.off()
(myacf <- c(racf$acf))
(mypacf <- c(rpacf$acf))
lengthx <- length(x)
sqrtn <- sqrt(lengthx)
load(file='createtable')
a<-table.start()
a<-table.row.start(a)
a<-table.element(a,'Autocorrelation Function',4,TRUE)
a<-table.row.end(a)
a<-table.row.start(a)
a<-table.element(a,'Time lag k',header=TRUE)
a<-table.element(a,hyperlink('basics.htm','ACF(k)','click here for more information about the Autocorrelation Function'),header=TRUE)
a<-table.element(a,'T-STAT',header=TRUE)
a<-table.element(a,'P-value',header=TRUE)
a<-table.row.end(a)
for (i in 2:(par1+1)) {
a<-table.row.start(a)
a<-table.element(a,i-1,header=TRUE)
a<-table.element(a,round(myacf[i],6))
mytstat <- myacf[i]*sqrtn
a<-table.element(a,round(mytstat,4))
a<-table.element(a,round(1-pt(abs(mytstat),lengthx),6))
a<-table.row.end(a)
}
a<-table.end(a)
table.save(a,file='mytable.tab')
a<-table.start()
a<-table.row.start(a)
a<-table.element(a,'Partial Autocorrelation Function',4,TRUE)
a<-table.row.end(a)
a<-table.row.start(a)
a<-table.element(a,'Time lag k',header=TRUE)
a<-table.element(a,hyperlink('basics.htm','PACF(k)','click here for more information about the Partial Autocorrelation Function'),header=TRUE)
a<-table.element(a,'T-STAT',header=TRUE)
a<-table.element(a,'P-value',header=TRUE)
a<-table.row.end(a)
for (i in 1:par1) {
a<-table.row.start(a)
a<-table.element(a,i,header=TRUE)
a<-table.element(a,round(mypacf[i],6))
mytstat <- mypacf[i]*sqrtn
a<-table.element(a,round(mytstat,4))
a<-table.element(a,round(1-pt(abs(mytstat),lengthx),6))
a<-table.row.end(a)
}
a<-table.end(a)
table.save(a,file='mytable1.tab')