Free Statistics

of Irreproducible Research!

Author's title

Author*Unverified author*
R Software Modulerwasp_autocorrelation.wasp
Title produced by software(Partial) Autocorrelation Function
Date of computationSat, 12 Jan 2013 17:45:36 -0500
Cite this page as followsStatistical Computations at FreeStatistics.org, Office for Research Development and Education, URL https://freestatistics.org/blog/index.php?v=date/2013/Jan/12/t1358030781okamqudjl6q77we.htm/, Retrieved Sat, 27 Apr 2024 23:18:06 +0000
Statistical Computations at FreeStatistics.org, Office for Research Development and Education, URL https://freestatistics.org/blog/index.php?pk=205260, Retrieved Sat, 27 Apr 2024 23:18:06 +0000
QR Codes:

Original text written by user:
IsPrivate?No (this computation is public)
User-defined keywords
Estimated Impact113
Family? (F = Feedback message, R = changed R code, M = changed R Module, P = changed Parameters, D = changed Data)
-     [Mean Plot] [] [2012-10-19 07:37:37] [873b10c79bed0b14ae85834791a7b7d7]
- RMPD    [(Partial) Autocorrelation Function] [] [2013-01-12 22:45:36] [6f8d6446e5f32bdf63bde1c9ab07ce03] [Current]
Feedback Forum

Post a new message
Dataseries X:
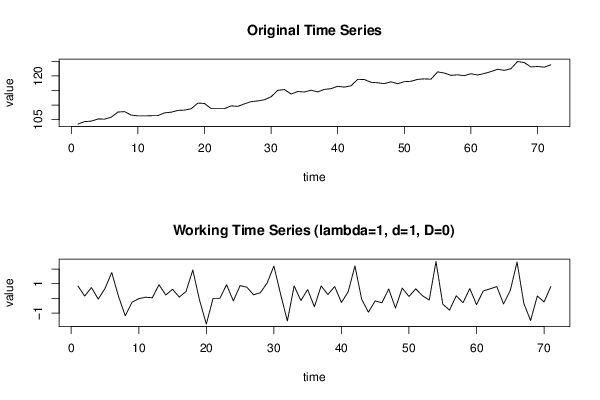
103.51
104.35
104.51
105.25
105.2
105.87
107.63
107.77
106.58
106.32
106.3
106.38
106.42
107.35
107.58
108.2
108.29
108.76
110.69
110.56
108.81
108.81
108.81
109.74
109.57
110.44
111.2
111.44
111.83
112.87
115.07
115.35
113.81
114.66
114.51
115.11
114.54
115.39
115.65
116.46
116.18
116.63
118.84
118.77
117.83
117.66
117.36
118
117.34
118.04
118.17
118.82
119
118.89
121.4
121.01
120.21
120.39
120.09
120.76
120.33
120.84
121.49
122.29
121.91
122.46
124.94
124.6
123.09
123.25
123.01
123.82


Summary of computational transaction
Raw Inputview raw input (R code)
Raw Outputview raw output of R engine
Computing time4 seconds
R Server'George Udny Yule' @ yule.wessa.net

\begin{tabular}{lllllllll}
\hline
Summary of computational transaction \tabularnewline
Raw Input & view raw input (R code)  \tabularnewline
Raw Output & view raw output of R engine  \tabularnewline
Computing time & 4 seconds \tabularnewline
R Server & 'George Udny Yule' @ yule.wessa.net \tabularnewline
\hline
\end{tabular}
%Source: https://freestatistics.org/blog/index.php?pk=205260&T=0

[TABLE]
[ROW][C]Summary of computational transaction[/C][/ROW]
[ROW][C]Raw Input[/C][C]view raw input (R code) [/C][/ROW]
[ROW][C]Raw Output[/C][C]view raw output of R engine [/C][/ROW]
[ROW][C]Computing time[/C][C]4 seconds[/C][/ROW]
[ROW][C]R Server[/C][C]'George Udny Yule' @ yule.wessa.net[/C][/ROW]
[/TABLE]
Source: https://freestatistics.org/blog/index.php?pk=205260&T=0

Globally Unique Identifier (entire table): ba.freestatistics.org/blog/index.php?pk=205260&T=0

As an alternative you can also use a QR Code:  

The GUIDs for individual cells are displayed in the table below:

Summary of computational transaction
Raw Inputview raw input (R code)
Raw Outputview raw output of R engine
Computing time4 seconds
R Server'George Udny Yule' @ yule.wessa.net


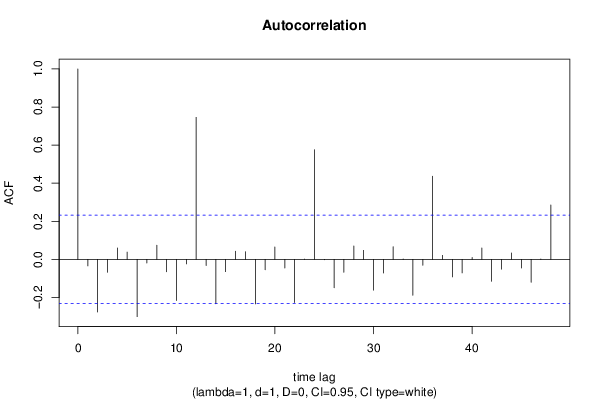
Autocorrelation Function
Time lag kACF(k)T-STATP-value
1-0.034172-0.28790.387118
2-0.27648-2.32970.011336
3-0.067956-0.57260.28436
40.0596390.50250.308426
50.0381060.32110.374545
6-0.300717-2.53390.006744
7-0.018989-0.160.436665
80.0744240.62710.266301
9-0.065169-0.54910.292322
10-0.216283-1.82240.0363
11-0.023666-0.19940.421254
120.7459566.28550
13-0.032066-0.27020.393898
14-0.232746-1.96120.026892
15-0.064371-0.54240.294621
160.042940.36180.35928
170.0400940.33780.368242
18-0.233712-1.96930.026411
19-0.054912-0.46270.322499
200.065440.55140.291544
21-0.045415-0.38270.351552
22-0.226639-1.90970.030107
230.0007930.00670.497343
240.5753724.84824e-06
25-0.002031-0.01710.493198
26-0.148803-1.25380.107007
27-0.06739-0.56780.285967
280.0702730.59210.277823
290.0472160.39780.345968
30-0.161341-1.35950.089148
31-0.071491-0.60240.274417
320.0665870.56110.288257
330.0024080.02030.491934
34-0.188224-1.5860.058591
35-0.030788-0.25940.398029
360.4362833.67620.000228
370.021150.17820.429531
38-0.092078-0.77590.220203
39-0.070978-0.59810.275848
400.0100640.08480.466331
410.0602190.50740.306717
42-0.114605-0.96570.168741
43-0.051153-0.4310.33388
440.0334720.2820.389366
45-0.045619-0.38440.350919
46-0.120273-1.01340.157146
470.0024980.02110.491632
480.2858592.40870.009304

\begin{tabular}{lllllllll}
\hline
Autocorrelation Function \tabularnewline
Time lag k & ACF(k) & T-STAT & P-value \tabularnewline
1 & -0.034172 & -0.2879 & 0.387118 \tabularnewline
2 & -0.27648 & -2.3297 & 0.011336 \tabularnewline
3 & -0.067956 & -0.5726 & 0.28436 \tabularnewline
4 & 0.059639 & 0.5025 & 0.308426 \tabularnewline
5 & 0.038106 & 0.3211 & 0.374545 \tabularnewline
6 & -0.300717 & -2.5339 & 0.006744 \tabularnewline
7 & -0.018989 & -0.16 & 0.436665 \tabularnewline
8 & 0.074424 & 0.6271 & 0.266301 \tabularnewline
9 & -0.065169 & -0.5491 & 0.292322 \tabularnewline
10 & -0.216283 & -1.8224 & 0.0363 \tabularnewline
11 & -0.023666 & -0.1994 & 0.421254 \tabularnewline
12 & 0.745956 & 6.2855 & 0 \tabularnewline
13 & -0.032066 & -0.2702 & 0.393898 \tabularnewline
14 & -0.232746 & -1.9612 & 0.026892 \tabularnewline
15 & -0.064371 & -0.5424 & 0.294621 \tabularnewline
16 & 0.04294 & 0.3618 & 0.35928 \tabularnewline
17 & 0.040094 & 0.3378 & 0.368242 \tabularnewline
18 & -0.233712 & -1.9693 & 0.026411 \tabularnewline
19 & -0.054912 & -0.4627 & 0.322499 \tabularnewline
20 & 0.06544 & 0.5514 & 0.291544 \tabularnewline
21 & -0.045415 & -0.3827 & 0.351552 \tabularnewline
22 & -0.226639 & -1.9097 & 0.030107 \tabularnewline
23 & 0.000793 & 0.0067 & 0.497343 \tabularnewline
24 & 0.575372 & 4.8482 & 4e-06 \tabularnewline
25 & -0.002031 & -0.0171 & 0.493198 \tabularnewline
26 & -0.148803 & -1.2538 & 0.107007 \tabularnewline
27 & -0.06739 & -0.5678 & 0.285967 \tabularnewline
28 & 0.070273 & 0.5921 & 0.277823 \tabularnewline
29 & 0.047216 & 0.3978 & 0.345968 \tabularnewline
30 & -0.161341 & -1.3595 & 0.089148 \tabularnewline
31 & -0.071491 & -0.6024 & 0.274417 \tabularnewline
32 & 0.066587 & 0.5611 & 0.288257 \tabularnewline
33 & 0.002408 & 0.0203 & 0.491934 \tabularnewline
34 & -0.188224 & -1.586 & 0.058591 \tabularnewline
35 & -0.030788 & -0.2594 & 0.398029 \tabularnewline
36 & 0.436283 & 3.6762 & 0.000228 \tabularnewline
37 & 0.02115 & 0.1782 & 0.429531 \tabularnewline
38 & -0.092078 & -0.7759 & 0.220203 \tabularnewline
39 & -0.070978 & -0.5981 & 0.275848 \tabularnewline
40 & 0.010064 & 0.0848 & 0.466331 \tabularnewline
41 & 0.060219 & 0.5074 & 0.306717 \tabularnewline
42 & -0.114605 & -0.9657 & 0.168741 \tabularnewline
43 & -0.051153 & -0.431 & 0.33388 \tabularnewline
44 & 0.033472 & 0.282 & 0.389366 \tabularnewline
45 & -0.045619 & -0.3844 & 0.350919 \tabularnewline
46 & -0.120273 & -1.0134 & 0.157146 \tabularnewline
47 & 0.002498 & 0.0211 & 0.491632 \tabularnewline
48 & 0.285859 & 2.4087 & 0.009304 \tabularnewline
\hline
\end{tabular}
%Source: https://freestatistics.org/blog/index.php?pk=205260&T=1

[TABLE]
[ROW][C]Autocorrelation Function[/C][/ROW]
[ROW][C]Time lag k[/C][C]ACF(k)[/C][C]T-STAT[/C][C]P-value[/C][/ROW]
[ROW][C]1[/C][C]-0.034172[/C][C]-0.2879[/C][C]0.387118[/C][/ROW]
[ROW][C]2[/C][C]-0.27648[/C][C]-2.3297[/C][C]0.011336[/C][/ROW]
[ROW][C]3[/C][C]-0.067956[/C][C]-0.5726[/C][C]0.28436[/C][/ROW]
[ROW][C]4[/C][C]0.059639[/C][C]0.5025[/C][C]0.308426[/C][/ROW]
[ROW][C]5[/C][C]0.038106[/C][C]0.3211[/C][C]0.374545[/C][/ROW]
[ROW][C]6[/C][C]-0.300717[/C][C]-2.5339[/C][C]0.006744[/C][/ROW]
[ROW][C]7[/C][C]-0.018989[/C][C]-0.16[/C][C]0.436665[/C][/ROW]
[ROW][C]8[/C][C]0.074424[/C][C]0.6271[/C][C]0.266301[/C][/ROW]
[ROW][C]9[/C][C]-0.065169[/C][C]-0.5491[/C][C]0.292322[/C][/ROW]
[ROW][C]10[/C][C]-0.216283[/C][C]-1.8224[/C][C]0.0363[/C][/ROW]
[ROW][C]11[/C][C]-0.023666[/C][C]-0.1994[/C][C]0.421254[/C][/ROW]
[ROW][C]12[/C][C]0.745956[/C][C]6.2855[/C][C]0[/C][/ROW]
[ROW][C]13[/C][C]-0.032066[/C][C]-0.2702[/C][C]0.393898[/C][/ROW]
[ROW][C]14[/C][C]-0.232746[/C][C]-1.9612[/C][C]0.026892[/C][/ROW]
[ROW][C]15[/C][C]-0.064371[/C][C]-0.5424[/C][C]0.294621[/C][/ROW]
[ROW][C]16[/C][C]0.04294[/C][C]0.3618[/C][C]0.35928[/C][/ROW]
[ROW][C]17[/C][C]0.040094[/C][C]0.3378[/C][C]0.368242[/C][/ROW]
[ROW][C]18[/C][C]-0.233712[/C][C]-1.9693[/C][C]0.026411[/C][/ROW]
[ROW][C]19[/C][C]-0.054912[/C][C]-0.4627[/C][C]0.322499[/C][/ROW]
[ROW][C]20[/C][C]0.06544[/C][C]0.5514[/C][C]0.291544[/C][/ROW]
[ROW][C]21[/C][C]-0.045415[/C][C]-0.3827[/C][C]0.351552[/C][/ROW]
[ROW][C]22[/C][C]-0.226639[/C][C]-1.9097[/C][C]0.030107[/C][/ROW]
[ROW][C]23[/C][C]0.000793[/C][C]0.0067[/C][C]0.497343[/C][/ROW]
[ROW][C]24[/C][C]0.575372[/C][C]4.8482[/C][C]4e-06[/C][/ROW]
[ROW][C]25[/C][C]-0.002031[/C][C]-0.0171[/C][C]0.493198[/C][/ROW]
[ROW][C]26[/C][C]-0.148803[/C][C]-1.2538[/C][C]0.107007[/C][/ROW]
[ROW][C]27[/C][C]-0.06739[/C][C]-0.5678[/C][C]0.285967[/C][/ROW]
[ROW][C]28[/C][C]0.070273[/C][C]0.5921[/C][C]0.277823[/C][/ROW]
[ROW][C]29[/C][C]0.047216[/C][C]0.3978[/C][C]0.345968[/C][/ROW]
[ROW][C]30[/C][C]-0.161341[/C][C]-1.3595[/C][C]0.089148[/C][/ROW]
[ROW][C]31[/C][C]-0.071491[/C][C]-0.6024[/C][C]0.274417[/C][/ROW]
[ROW][C]32[/C][C]0.066587[/C][C]0.5611[/C][C]0.288257[/C][/ROW]
[ROW][C]33[/C][C]0.002408[/C][C]0.0203[/C][C]0.491934[/C][/ROW]
[ROW][C]34[/C][C]-0.188224[/C][C]-1.586[/C][C]0.058591[/C][/ROW]
[ROW][C]35[/C][C]-0.030788[/C][C]-0.2594[/C][C]0.398029[/C][/ROW]
[ROW][C]36[/C][C]0.436283[/C][C]3.6762[/C][C]0.000228[/C][/ROW]
[ROW][C]37[/C][C]0.02115[/C][C]0.1782[/C][C]0.429531[/C][/ROW]
[ROW][C]38[/C][C]-0.092078[/C][C]-0.7759[/C][C]0.220203[/C][/ROW]
[ROW][C]39[/C][C]-0.070978[/C][C]-0.5981[/C][C]0.275848[/C][/ROW]
[ROW][C]40[/C][C]0.010064[/C][C]0.0848[/C][C]0.466331[/C][/ROW]
[ROW][C]41[/C][C]0.060219[/C][C]0.5074[/C][C]0.306717[/C][/ROW]
[ROW][C]42[/C][C]-0.114605[/C][C]-0.9657[/C][C]0.168741[/C][/ROW]
[ROW][C]43[/C][C]-0.051153[/C][C]-0.431[/C][C]0.33388[/C][/ROW]
[ROW][C]44[/C][C]0.033472[/C][C]0.282[/C][C]0.389366[/C][/ROW]
[ROW][C]45[/C][C]-0.045619[/C][C]-0.3844[/C][C]0.350919[/C][/ROW]
[ROW][C]46[/C][C]-0.120273[/C][C]-1.0134[/C][C]0.157146[/C][/ROW]
[ROW][C]47[/C][C]0.002498[/C][C]0.0211[/C][C]0.491632[/C][/ROW]
[ROW][C]48[/C][C]0.285859[/C][C]2.4087[/C][C]0.009304[/C][/ROW]
[/TABLE]
Source: https://freestatistics.org/blog/index.php?pk=205260&T=1

Globally Unique Identifier (entire table): ba.freestatistics.org/blog/index.php?pk=205260&T=1

As an alternative you can also use a QR Code:  

The GUIDs for individual cells are displayed in the table below:

Autocorrelation Function
Time lag kACF(k)T-STATP-value
1-0.034172-0.28790.387118
2-0.27648-2.32970.011336
3-0.067956-0.57260.28436
40.0596390.50250.308426
50.0381060.32110.374545
6-0.300717-2.53390.006744
7-0.018989-0.160.436665
80.0744240.62710.266301
9-0.065169-0.54910.292322
10-0.216283-1.82240.0363
11-0.023666-0.19940.421254
120.7459566.28550
13-0.032066-0.27020.393898
14-0.232746-1.96120.026892
15-0.064371-0.54240.294621
160.042940.36180.35928
170.0400940.33780.368242
18-0.233712-1.96930.026411
19-0.054912-0.46270.322499
200.065440.55140.291544
21-0.045415-0.38270.351552
22-0.226639-1.90970.030107
230.0007930.00670.497343
240.5753724.84824e-06
25-0.002031-0.01710.493198
26-0.148803-1.25380.107007
27-0.06739-0.56780.285967
280.0702730.59210.277823
290.0472160.39780.345968
30-0.161341-1.35950.089148
31-0.071491-0.60240.274417
320.0665870.56110.288257
330.0024080.02030.491934
34-0.188224-1.5860.058591
35-0.030788-0.25940.398029
360.4362833.67620.000228
370.021150.17820.429531
38-0.092078-0.77590.220203
39-0.070978-0.59810.275848
400.0100640.08480.466331
410.0602190.50740.306717
42-0.114605-0.96570.168741
43-0.051153-0.4310.33388
440.0334720.2820.389366
45-0.045619-0.38440.350919
46-0.120273-1.01340.157146
470.0024980.02110.491632
480.2858592.40870.009304


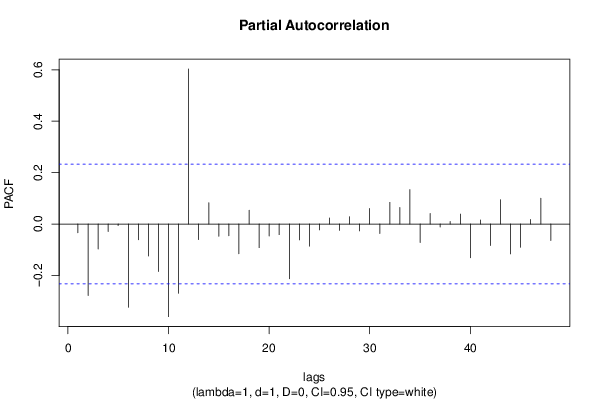
Partial Autocorrelation Function
Time lag kPACF(k)T-STATP-value
1-0.034172-0.28790.387118
2-0.277972-2.34220.010989
3-0.097139-0.81850.207903
4-0.029037-0.24470.403708
5-0.006208-0.05230.479214
6-0.32427-2.73230.003965
7-0.061426-0.51760.303177
8-0.124718-1.05090.148436
9-0.18511-1.55980.061631
10-0.360537-3.03790.001666
11-0.269204-2.26830.013175
120.6034565.08481e-06
13-0.060685-0.51130.30535
140.0827660.69740.243916
15-0.047673-0.40170.344557
16-0.0459-0.38680.350044
17-0.115942-0.97690.165957
180.0535930.45160.326473
19-0.091828-0.77380.220823
20-0.046653-0.39310.34771
21-0.041455-0.34930.363945
22-0.213207-1.79650.038333
23-0.061855-0.52120.301923
24-0.08604-0.7250.235422
25-0.022852-0.19260.423927
260.0234440.19750.421984
27-0.024818-0.20910.417476
280.0279830.23580.407139
29-0.026849-0.22620.410834
300.0607160.51160.305259
31-0.036653-0.30880.379173
320.0842320.70980.240091
330.0643440.54220.2947
340.1338011.12740.131678
35-0.071739-0.60450.273726
360.0407910.34370.366041
37-0.011726-0.09880.460787
380.0100880.0850.466248
390.0386470.32560.372826
40-0.131497-1.1080.135798
410.0156460.13180.447744
42-0.083539-0.70390.241894
430.0943220.79480.214697
44-0.11626-0.97960.165299
45-0.090605-0.76350.223862
460.0172650.14550.442374
470.1003670.84570.200278
48-0.064246-0.54130.294981

\begin{tabular}{lllllllll}
\hline
Partial Autocorrelation Function \tabularnewline
Time lag k & PACF(k) & T-STAT & P-value \tabularnewline
1 & -0.034172 & -0.2879 & 0.387118 \tabularnewline
2 & -0.277972 & -2.3422 & 0.010989 \tabularnewline
3 & -0.097139 & -0.8185 & 0.207903 \tabularnewline
4 & -0.029037 & -0.2447 & 0.403708 \tabularnewline
5 & -0.006208 & -0.0523 & 0.479214 \tabularnewline
6 & -0.32427 & -2.7323 & 0.003965 \tabularnewline
7 & -0.061426 & -0.5176 & 0.303177 \tabularnewline
8 & -0.124718 & -1.0509 & 0.148436 \tabularnewline
9 & -0.18511 & -1.5598 & 0.061631 \tabularnewline
10 & -0.360537 & -3.0379 & 0.001666 \tabularnewline
11 & -0.269204 & -2.2683 & 0.013175 \tabularnewline
12 & 0.603456 & 5.0848 & 1e-06 \tabularnewline
13 & -0.060685 & -0.5113 & 0.30535 \tabularnewline
14 & 0.082766 & 0.6974 & 0.243916 \tabularnewline
15 & -0.047673 & -0.4017 & 0.344557 \tabularnewline
16 & -0.0459 & -0.3868 & 0.350044 \tabularnewline
17 & -0.115942 & -0.9769 & 0.165957 \tabularnewline
18 & 0.053593 & 0.4516 & 0.326473 \tabularnewline
19 & -0.091828 & -0.7738 & 0.220823 \tabularnewline
20 & -0.046653 & -0.3931 & 0.34771 \tabularnewline
21 & -0.041455 & -0.3493 & 0.363945 \tabularnewline
22 & -0.213207 & -1.7965 & 0.038333 \tabularnewline
23 & -0.061855 & -0.5212 & 0.301923 \tabularnewline
24 & -0.08604 & -0.725 & 0.235422 \tabularnewline
25 & -0.022852 & -0.1926 & 0.423927 \tabularnewline
26 & 0.023444 & 0.1975 & 0.421984 \tabularnewline
27 & -0.024818 & -0.2091 & 0.417476 \tabularnewline
28 & 0.027983 & 0.2358 & 0.407139 \tabularnewline
29 & -0.026849 & -0.2262 & 0.410834 \tabularnewline
30 & 0.060716 & 0.5116 & 0.305259 \tabularnewline
31 & -0.036653 & -0.3088 & 0.379173 \tabularnewline
32 & 0.084232 & 0.7098 & 0.240091 \tabularnewline
33 & 0.064344 & 0.5422 & 0.2947 \tabularnewline
34 & 0.133801 & 1.1274 & 0.131678 \tabularnewline
35 & -0.071739 & -0.6045 & 0.273726 \tabularnewline
36 & 0.040791 & 0.3437 & 0.366041 \tabularnewline
37 & -0.011726 & -0.0988 & 0.460787 \tabularnewline
38 & 0.010088 & 0.085 & 0.466248 \tabularnewline
39 & 0.038647 & 0.3256 & 0.372826 \tabularnewline
40 & -0.131497 & -1.108 & 0.135798 \tabularnewline
41 & 0.015646 & 0.1318 & 0.447744 \tabularnewline
42 & -0.083539 & -0.7039 & 0.241894 \tabularnewline
43 & 0.094322 & 0.7948 & 0.214697 \tabularnewline
44 & -0.11626 & -0.9796 & 0.165299 \tabularnewline
45 & -0.090605 & -0.7635 & 0.223862 \tabularnewline
46 & 0.017265 & 0.1455 & 0.442374 \tabularnewline
47 & 0.100367 & 0.8457 & 0.200278 \tabularnewline
48 & -0.064246 & -0.5413 & 0.294981 \tabularnewline
\hline
\end{tabular}
%Source: https://freestatistics.org/blog/index.php?pk=205260&T=2

[TABLE]
[ROW][C]Partial Autocorrelation Function[/C][/ROW]
[ROW][C]Time lag k[/C][C]PACF(k)[/C][C]T-STAT[/C][C]P-value[/C][/ROW]
[ROW][C]1[/C][C]-0.034172[/C][C]-0.2879[/C][C]0.387118[/C][/ROW]
[ROW][C]2[/C][C]-0.277972[/C][C]-2.3422[/C][C]0.010989[/C][/ROW]
[ROW][C]3[/C][C]-0.097139[/C][C]-0.8185[/C][C]0.207903[/C][/ROW]
[ROW][C]4[/C][C]-0.029037[/C][C]-0.2447[/C][C]0.403708[/C][/ROW]
[ROW][C]5[/C][C]-0.006208[/C][C]-0.0523[/C][C]0.479214[/C][/ROW]
[ROW][C]6[/C][C]-0.32427[/C][C]-2.7323[/C][C]0.003965[/C][/ROW]
[ROW][C]7[/C][C]-0.061426[/C][C]-0.5176[/C][C]0.303177[/C][/ROW]
[ROW][C]8[/C][C]-0.124718[/C][C]-1.0509[/C][C]0.148436[/C][/ROW]
[ROW][C]9[/C][C]-0.18511[/C][C]-1.5598[/C][C]0.061631[/C][/ROW]
[ROW][C]10[/C][C]-0.360537[/C][C]-3.0379[/C][C]0.001666[/C][/ROW]
[ROW][C]11[/C][C]-0.269204[/C][C]-2.2683[/C][C]0.013175[/C][/ROW]
[ROW][C]12[/C][C]0.603456[/C][C]5.0848[/C][C]1e-06[/C][/ROW]
[ROW][C]13[/C][C]-0.060685[/C][C]-0.5113[/C][C]0.30535[/C][/ROW]
[ROW][C]14[/C][C]0.082766[/C][C]0.6974[/C][C]0.243916[/C][/ROW]
[ROW][C]15[/C][C]-0.047673[/C][C]-0.4017[/C][C]0.344557[/C][/ROW]
[ROW][C]16[/C][C]-0.0459[/C][C]-0.3868[/C][C]0.350044[/C][/ROW]
[ROW][C]17[/C][C]-0.115942[/C][C]-0.9769[/C][C]0.165957[/C][/ROW]
[ROW][C]18[/C][C]0.053593[/C][C]0.4516[/C][C]0.326473[/C][/ROW]
[ROW][C]19[/C][C]-0.091828[/C][C]-0.7738[/C][C]0.220823[/C][/ROW]
[ROW][C]20[/C][C]-0.046653[/C][C]-0.3931[/C][C]0.34771[/C][/ROW]
[ROW][C]21[/C][C]-0.041455[/C][C]-0.3493[/C][C]0.363945[/C][/ROW]
[ROW][C]22[/C][C]-0.213207[/C][C]-1.7965[/C][C]0.038333[/C][/ROW]
[ROW][C]23[/C][C]-0.061855[/C][C]-0.5212[/C][C]0.301923[/C][/ROW]
[ROW][C]24[/C][C]-0.08604[/C][C]-0.725[/C][C]0.235422[/C][/ROW]
[ROW][C]25[/C][C]-0.022852[/C][C]-0.1926[/C][C]0.423927[/C][/ROW]
[ROW][C]26[/C][C]0.023444[/C][C]0.1975[/C][C]0.421984[/C][/ROW]
[ROW][C]27[/C][C]-0.024818[/C][C]-0.2091[/C][C]0.417476[/C][/ROW]
[ROW][C]28[/C][C]0.027983[/C][C]0.2358[/C][C]0.407139[/C][/ROW]
[ROW][C]29[/C][C]-0.026849[/C][C]-0.2262[/C][C]0.410834[/C][/ROW]
[ROW][C]30[/C][C]0.060716[/C][C]0.5116[/C][C]0.305259[/C][/ROW]
[ROW][C]31[/C][C]-0.036653[/C][C]-0.3088[/C][C]0.379173[/C][/ROW]
[ROW][C]32[/C][C]0.084232[/C][C]0.7098[/C][C]0.240091[/C][/ROW]
[ROW][C]33[/C][C]0.064344[/C][C]0.5422[/C][C]0.2947[/C][/ROW]
[ROW][C]34[/C][C]0.133801[/C][C]1.1274[/C][C]0.131678[/C][/ROW]
[ROW][C]35[/C][C]-0.071739[/C][C]-0.6045[/C][C]0.273726[/C][/ROW]
[ROW][C]36[/C][C]0.040791[/C][C]0.3437[/C][C]0.366041[/C][/ROW]
[ROW][C]37[/C][C]-0.011726[/C][C]-0.0988[/C][C]0.460787[/C][/ROW]
[ROW][C]38[/C][C]0.010088[/C][C]0.085[/C][C]0.466248[/C][/ROW]
[ROW][C]39[/C][C]0.038647[/C][C]0.3256[/C][C]0.372826[/C][/ROW]
[ROW][C]40[/C][C]-0.131497[/C][C]-1.108[/C][C]0.135798[/C][/ROW]
[ROW][C]41[/C][C]0.015646[/C][C]0.1318[/C][C]0.447744[/C][/ROW]
[ROW][C]42[/C][C]-0.083539[/C][C]-0.7039[/C][C]0.241894[/C][/ROW]
[ROW][C]43[/C][C]0.094322[/C][C]0.7948[/C][C]0.214697[/C][/ROW]
[ROW][C]44[/C][C]-0.11626[/C][C]-0.9796[/C][C]0.165299[/C][/ROW]
[ROW][C]45[/C][C]-0.090605[/C][C]-0.7635[/C][C]0.223862[/C][/ROW]
[ROW][C]46[/C][C]0.017265[/C][C]0.1455[/C][C]0.442374[/C][/ROW]
[ROW][C]47[/C][C]0.100367[/C][C]0.8457[/C][C]0.200278[/C][/ROW]
[ROW][C]48[/C][C]-0.064246[/C][C]-0.5413[/C][C]0.294981[/C][/ROW]
[/TABLE]
Source: https://freestatistics.org/blog/index.php?pk=205260&T=2

Globally Unique Identifier (entire table): ba.freestatistics.org/blog/index.php?pk=205260&T=2

As an alternative you can also use a QR Code:  

The GUIDs for individual cells are displayed in the table below:

Partial Autocorrelation Function
Time lag kPACF(k)T-STATP-value
1-0.034172-0.28790.387118
2-0.277972-2.34220.010989
3-0.097139-0.81850.207903
4-0.029037-0.24470.403708
5-0.006208-0.05230.479214
6-0.32427-2.73230.003965
7-0.061426-0.51760.303177
8-0.124718-1.05090.148436
9-0.18511-1.55980.061631
10-0.360537-3.03790.001666
11-0.269204-2.26830.013175
120.6034565.08481e-06
13-0.060685-0.51130.30535
140.0827660.69740.243916
15-0.047673-0.40170.344557
16-0.0459-0.38680.350044
17-0.115942-0.97690.165957
180.0535930.45160.326473
19-0.091828-0.77380.220823
20-0.046653-0.39310.34771
21-0.041455-0.34930.363945
22-0.213207-1.79650.038333
23-0.061855-0.52120.301923
24-0.08604-0.7250.235422
25-0.022852-0.19260.423927
260.0234440.19750.421984
27-0.024818-0.20910.417476
280.0279830.23580.407139
29-0.026849-0.22620.410834
300.0607160.51160.305259
31-0.036653-0.30880.379173
320.0842320.70980.240091
330.0643440.54220.2947
340.1338011.12740.131678
35-0.071739-0.60450.273726
360.0407910.34370.366041
37-0.011726-0.09880.460787
380.0100880.0850.466248
390.0386470.32560.372826
40-0.131497-1.1080.135798
410.0156460.13180.447744
42-0.083539-0.70390.241894
430.0943220.79480.214697
44-0.11626-0.97960.165299
45-0.090605-0.76350.223862
460.0172650.14550.442374
470.1003670.84570.200278
48-0.064246-0.54130.294981


Parameters (Session):
par1 = 48 ; par2 = 1 ; par3 = 1 ; par4 = 0 ; par5 = 12 ; par6 = White Noise ; par7 = 0.95 ;
Parameters (R input):
par1 = 48 ; par2 = 1 ; par3 = 1 ; par4 = 0 ; par5 = 12 ; par6 = White Noise ; par7 = 0.95 ; par8 = ;
R code (references can be found in the software module):
if (par1 == 'Default') {
par1 = 10*log10(length(x))
} else {
par1 <- as.numeric(par1)
}
par2 <- as.numeric(par2)
par3 <- as.numeric(par3)
par4 <- as.numeric(par4)
par5 <- as.numeric(par5)
if (par6 == 'White Noise') par6 <- 'white' else par6 <- 'ma'
par7 <- as.numeric(par7)
if (par8 != '') par8 <- as.numeric(par8)
ox <- x
if (par8 == '') {
if (par2 == 0) {
x <- log(x)
} else {
x <- (x ^ par2 - 1) / par2
}
} else {
x <- log(x,base=par8)
}
if (par3 > 0) x <- diff(x,lag=1,difference=par3)
if (par4 > 0) x <- diff(x,lag=par5,difference=par4)
bitmap(file='picts.png')
op <- par(mfrow=c(2,1))
plot(ox,type='l',main='Original Time Series',xlab='time',ylab='value')
if (par8=='') {
mytitle <- paste('Working Time Series (lambda=',par2,', d=',par3,', D=',par4,')',sep='')
mysub <- paste('(lambda=',par2,', d=',par3,', D=',par4,', CI=', par7, ', CI type=',par6,')',sep='')
} else {
mytitle <- paste('Working Time Series (base=',par8,', d=',par3,', D=',par4,')',sep='')
mysub <- paste('(base=',par8,', d=',par3,', D=',par4,', CI=', par7, ', CI type=',par6,')',sep='')
}
plot(x,type='l', main=mytitle,xlab='time',ylab='value')
par(op)
dev.off()
bitmap(file='pic1.png')
racf <- acf(x, par1, main='Autocorrelation', xlab='time lag', ylab='ACF', ci.type=par6, ci=par7, sub=mysub)
dev.off()
bitmap(file='pic2.png')
rpacf <- pacf(x,par1,main='Partial Autocorrelation',xlab='lags',ylab='PACF',sub=mysub)
dev.off()
(myacf <- c(racf$acf))
(mypacf <- c(rpacf$acf))
lengthx <- length(x)
sqrtn <- sqrt(lengthx)
load(file='createtable')
a<-table.start()
a<-table.row.start(a)
a<-table.element(a,'Autocorrelation Function',4,TRUE)
a<-table.row.end(a)
a<-table.row.start(a)
a<-table.element(a,'Time lag k',header=TRUE)
a<-table.element(a,hyperlink('basics.htm','ACF(k)','click here for more information about the Autocorrelation Function'),header=TRUE)
a<-table.element(a,'T-STAT',header=TRUE)
a<-table.element(a,'P-value',header=TRUE)
a<-table.row.end(a)
for (i in 2:(par1+1)) {
a<-table.row.start(a)
a<-table.element(a,i-1,header=TRUE)
a<-table.element(a,round(myacf[i],6))
mytstat <- myacf[i]*sqrtn
a<-table.element(a,round(mytstat,4))
a<-table.element(a,round(1-pt(abs(mytstat),lengthx),6))
a<-table.row.end(a)
}
a<-table.end(a)
table.save(a,file='mytable.tab')
a<-table.start()
a<-table.row.start(a)
a<-table.element(a,'Partial Autocorrelation Function',4,TRUE)
a<-table.row.end(a)
a<-table.row.start(a)
a<-table.element(a,'Time lag k',header=TRUE)
a<-table.element(a,hyperlink('basics.htm','PACF(k)','click here for more information about the Partial Autocorrelation Function'),header=TRUE)
a<-table.element(a,'T-STAT',header=TRUE)
a<-table.element(a,'P-value',header=TRUE)
a<-table.row.end(a)
for (i in 1:par1) {
a<-table.row.start(a)
a<-table.element(a,i,header=TRUE)
a<-table.element(a,round(mypacf[i],6))
mytstat <- mypacf[i]*sqrtn
a<-table.element(a,round(mytstat,4))
a<-table.element(a,round(1-pt(abs(mytstat),lengthx),6))
a<-table.row.end(a)
}
a<-table.end(a)
table.save(a,file='mytable1.tab')