Free Statistics

of Irreproducible Research!

Author's title

Author*Unverified author*
R Software Modulerwasp_autocorrelation.wasp
Title produced by software(Partial) Autocorrelation Function
Date of computationSat, 12 Jan 2013 17:30:12 -0500
Cite this page as followsStatistical Computations at FreeStatistics.org, Office for Research Development and Education, URL https://freestatistics.org/blog/index.php?v=date/2013/Jan/12/t1358030503fh4g9m8ieik7da8.htm/, Retrieved Sun, 28 Apr 2024 11:41:27 +0000
Statistical Computations at FreeStatistics.org, Office for Research Development and Education, URL https://freestatistics.org/blog/index.php?pk=205259, Retrieved Sun, 28 Apr 2024 11:41:27 +0000
QR Codes:

Original text written by user:
IsPrivate?No (this computation is public)
User-defined keywords
Estimated Impact107
Family? (F = Feedback message, R = changed R code, M = changed R Module, P = changed Parameters, D = changed Data)
-     [Mean Plot] [] [2012-10-19 07:37:37] [873b10c79bed0b14ae85834791a7b7d7]
- RMPD    [(Partial) Autocorrelation Function] [] [2013-01-12 22:30:12] [6f8d6446e5f32bdf63bde1c9ab07ce03] [Current]
- R P       [(Partial) Autocorrelation Function] [] [2013-01-14 09:46:49] [74be16979710d4c4e7c6647856088456]
Feedback Forum

Post a new message
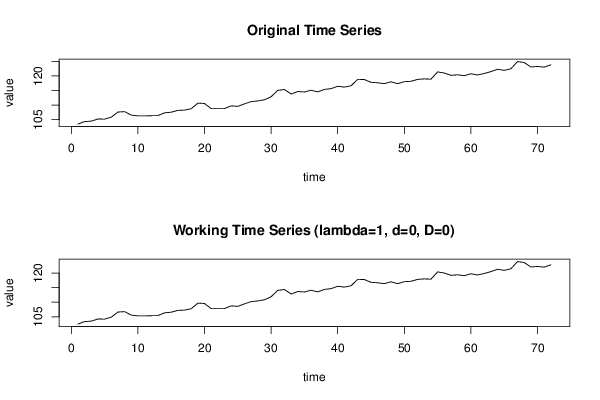
Dataseries X:
103.51
104.35
104.51
105.25
105.2
105.87
107.63
107.77
106.58
106.32
106.3
106.38
106.42
107.35
107.58
108.2
108.29
108.76
110.69
110.56
108.81
108.81
108.81
109.74
109.57
110.44
111.2
111.44
111.83
112.87
115.07
115.35
113.81
114.66
114.51
115.11
114.54
115.39
115.65
116.46
116.18
116.63
118.84
118.77
117.83
117.66
117.36
118
117.34
118.04
118.17
118.82
119
118.89
121.4
121.01
120.21
120.39
120.09
120.76
120.33
120.84
121.49
122.29
121.91
122.46
124.94
124.6
123.09
123.25
123.01
123.82


Summary of computational transaction
Raw Inputview raw input (R code)
Raw Outputview raw output of R engine
Computing time3 seconds
R Server'Herman Ole Andreas Wold' @ wold.wessa.net

\begin{tabular}{lllllllll}
\hline
Summary of computational transaction \tabularnewline
Raw Input & view raw input (R code)  \tabularnewline
Raw Output & view raw output of R engine  \tabularnewline
Computing time & 3 seconds \tabularnewline
R Server & 'Herman Ole Andreas Wold' @ wold.wessa.net \tabularnewline
\hline
\end{tabular}
%Source: https://freestatistics.org/blog/index.php?pk=205259&T=0

[TABLE]
[ROW][C]Summary of computational transaction[/C][/ROW]
[ROW][C]Raw Input[/C][C]view raw input (R code) [/C][/ROW]
[ROW][C]Raw Output[/C][C]view raw output of R engine [/C][/ROW]
[ROW][C]Computing time[/C][C]3 seconds[/C][/ROW]
[ROW][C]R Server[/C][C]'Herman Ole Andreas Wold' @ wold.wessa.net[/C][/ROW]
[/TABLE]
Source: https://freestatistics.org/blog/index.php?pk=205259&T=0

Globally Unique Identifier (entire table): ba.freestatistics.org/blog/index.php?pk=205259&T=0

As an alternative you can also use a QR Code:  

The GUIDs for individual cells are displayed in the table below:

Summary of computational transaction
Raw Inputview raw input (R code)
Raw Outputview raw output of R engine
Computing time3 seconds
R Server'Herman Ole Andreas Wold' @ wold.wessa.net


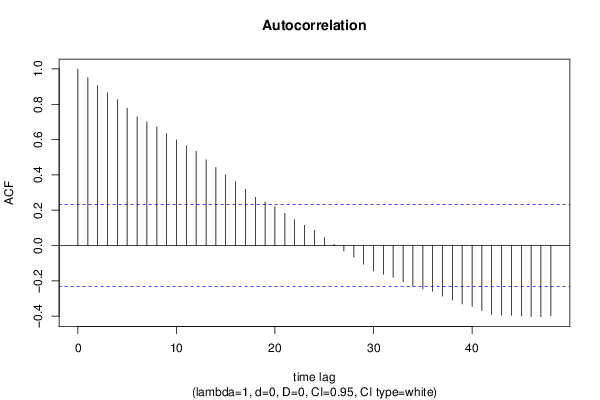
Autocorrelation Function
Time lag kACF(k)T-STATP-value
10.9505818.06590
20.9060727.68830
30.8644387.3350
40.8256627.0060
50.7780256.60180
60.7290246.1860
70.6998315.93830
80.6717725.70020
90.6341585.3810
100.5976065.07091e-06
110.5654184.79774e-06
120.5339614.53081.1e-05
130.4853584.11845e-05
140.4417683.74850.000178
150.4005843.39910.000553
160.3620273.07190.001501
170.3183532.70130.004303
180.2726022.31310.011789
190.246562.09210.019976
200.2191251.85930.033533
210.1822231.54620.063219
220.1468091.24570.108454
230.11440.97070.167471
240.0867440.7360.232047
250.0437070.37090.355913
260.0050290.04270.48304
27-0.030313-0.25720.398874
28-0.065535-0.55610.28994
29-0.105391-0.89430.187077
30-0.143636-1.21880.113451
31-0.163122-1.38410.085296
32-0.179582-1.52380.065969
33-0.205869-1.74690.042464
34-0.226968-1.92590.029034
35-0.245405-2.08230.020433
36-0.258817-2.19610.015652
37-0.285871-2.42570.008893
38-0.308751-2.61980.005361
39-0.330443-2.80390.003242
40-0.345399-2.93080.002264
41-0.368276-3.12490.001282
42-0.390528-3.31370.000721
43-0.394446-3.3470.000651
44-0.394602-3.34830.000648
45-0.398533-3.38170.000584
46-0.402156-3.41240.00053
47-0.40276-3.41750.000521
48-0.398248-3.37920.000588

\begin{tabular}{lllllllll}
\hline
Autocorrelation Function \tabularnewline
Time lag k & ACF(k) & T-STAT & P-value \tabularnewline
1 & 0.950581 & 8.0659 & 0 \tabularnewline
2 & 0.906072 & 7.6883 & 0 \tabularnewline
3 & 0.864438 & 7.335 & 0 \tabularnewline
4 & 0.825662 & 7.006 & 0 \tabularnewline
5 & 0.778025 & 6.6018 & 0 \tabularnewline
6 & 0.729024 & 6.186 & 0 \tabularnewline
7 & 0.699831 & 5.9383 & 0 \tabularnewline
8 & 0.671772 & 5.7002 & 0 \tabularnewline
9 & 0.634158 & 5.381 & 0 \tabularnewline
10 & 0.597606 & 5.0709 & 1e-06 \tabularnewline
11 & 0.565418 & 4.7977 & 4e-06 \tabularnewline
12 & 0.533961 & 4.5308 & 1.1e-05 \tabularnewline
13 & 0.485358 & 4.1184 & 5e-05 \tabularnewline
14 & 0.441768 & 3.7485 & 0.000178 \tabularnewline
15 & 0.400584 & 3.3991 & 0.000553 \tabularnewline
16 & 0.362027 & 3.0719 & 0.001501 \tabularnewline
17 & 0.318353 & 2.7013 & 0.004303 \tabularnewline
18 & 0.272602 & 2.3131 & 0.011789 \tabularnewline
19 & 0.24656 & 2.0921 & 0.019976 \tabularnewline
20 & 0.219125 & 1.8593 & 0.033533 \tabularnewline
21 & 0.182223 & 1.5462 & 0.063219 \tabularnewline
22 & 0.146809 & 1.2457 & 0.108454 \tabularnewline
23 & 0.1144 & 0.9707 & 0.167471 \tabularnewline
24 & 0.086744 & 0.736 & 0.232047 \tabularnewline
25 & 0.043707 & 0.3709 & 0.355913 \tabularnewline
26 & 0.005029 & 0.0427 & 0.48304 \tabularnewline
27 & -0.030313 & -0.2572 & 0.398874 \tabularnewline
28 & -0.065535 & -0.5561 & 0.28994 \tabularnewline
29 & -0.105391 & -0.8943 & 0.187077 \tabularnewline
30 & -0.143636 & -1.2188 & 0.113451 \tabularnewline
31 & -0.163122 & -1.3841 & 0.085296 \tabularnewline
32 & -0.179582 & -1.5238 & 0.065969 \tabularnewline
33 & -0.205869 & -1.7469 & 0.042464 \tabularnewline
34 & -0.226968 & -1.9259 & 0.029034 \tabularnewline
35 & -0.245405 & -2.0823 & 0.020433 \tabularnewline
36 & -0.258817 & -2.1961 & 0.015652 \tabularnewline
37 & -0.285871 & -2.4257 & 0.008893 \tabularnewline
38 & -0.308751 & -2.6198 & 0.005361 \tabularnewline
39 & -0.330443 & -2.8039 & 0.003242 \tabularnewline
40 & -0.345399 & -2.9308 & 0.002264 \tabularnewline
41 & -0.368276 & -3.1249 & 0.001282 \tabularnewline
42 & -0.390528 & -3.3137 & 0.000721 \tabularnewline
43 & -0.394446 & -3.347 & 0.000651 \tabularnewline
44 & -0.394602 & -3.3483 & 0.000648 \tabularnewline
45 & -0.398533 & -3.3817 & 0.000584 \tabularnewline
46 & -0.402156 & -3.4124 & 0.00053 \tabularnewline
47 & -0.40276 & -3.4175 & 0.000521 \tabularnewline
48 & -0.398248 & -3.3792 & 0.000588 \tabularnewline
\hline
\end{tabular}
%Source: https://freestatistics.org/blog/index.php?pk=205259&T=1

[TABLE]
[ROW][C]Autocorrelation Function[/C][/ROW]
[ROW][C]Time lag k[/C][C]ACF(k)[/C][C]T-STAT[/C][C]P-value[/C][/ROW]
[ROW][C]1[/C][C]0.950581[/C][C]8.0659[/C][C]0[/C][/ROW]
[ROW][C]2[/C][C]0.906072[/C][C]7.6883[/C][C]0[/C][/ROW]
[ROW][C]3[/C][C]0.864438[/C][C]7.335[/C][C]0[/C][/ROW]
[ROW][C]4[/C][C]0.825662[/C][C]7.006[/C][C]0[/C][/ROW]
[ROW][C]5[/C][C]0.778025[/C][C]6.6018[/C][C]0[/C][/ROW]
[ROW][C]6[/C][C]0.729024[/C][C]6.186[/C][C]0[/C][/ROW]
[ROW][C]7[/C][C]0.699831[/C][C]5.9383[/C][C]0[/C][/ROW]
[ROW][C]8[/C][C]0.671772[/C][C]5.7002[/C][C]0[/C][/ROW]
[ROW][C]9[/C][C]0.634158[/C][C]5.381[/C][C]0[/C][/ROW]
[ROW][C]10[/C][C]0.597606[/C][C]5.0709[/C][C]1e-06[/C][/ROW]
[ROW][C]11[/C][C]0.565418[/C][C]4.7977[/C][C]4e-06[/C][/ROW]
[ROW][C]12[/C][C]0.533961[/C][C]4.5308[/C][C]1.1e-05[/C][/ROW]
[ROW][C]13[/C][C]0.485358[/C][C]4.1184[/C][C]5e-05[/C][/ROW]
[ROW][C]14[/C][C]0.441768[/C][C]3.7485[/C][C]0.000178[/C][/ROW]
[ROW][C]15[/C][C]0.400584[/C][C]3.3991[/C][C]0.000553[/C][/ROW]
[ROW][C]16[/C][C]0.362027[/C][C]3.0719[/C][C]0.001501[/C][/ROW]
[ROW][C]17[/C][C]0.318353[/C][C]2.7013[/C][C]0.004303[/C][/ROW]
[ROW][C]18[/C][C]0.272602[/C][C]2.3131[/C][C]0.011789[/C][/ROW]
[ROW][C]19[/C][C]0.24656[/C][C]2.0921[/C][C]0.019976[/C][/ROW]
[ROW][C]20[/C][C]0.219125[/C][C]1.8593[/C][C]0.033533[/C][/ROW]
[ROW][C]21[/C][C]0.182223[/C][C]1.5462[/C][C]0.063219[/C][/ROW]
[ROW][C]22[/C][C]0.146809[/C][C]1.2457[/C][C]0.108454[/C][/ROW]
[ROW][C]23[/C][C]0.1144[/C][C]0.9707[/C][C]0.167471[/C][/ROW]
[ROW][C]24[/C][C]0.086744[/C][C]0.736[/C][C]0.232047[/C][/ROW]
[ROW][C]25[/C][C]0.043707[/C][C]0.3709[/C][C]0.355913[/C][/ROW]
[ROW][C]26[/C][C]0.005029[/C][C]0.0427[/C][C]0.48304[/C][/ROW]
[ROW][C]27[/C][C]-0.030313[/C][C]-0.2572[/C][C]0.398874[/C][/ROW]
[ROW][C]28[/C][C]-0.065535[/C][C]-0.5561[/C][C]0.28994[/C][/ROW]
[ROW][C]29[/C][C]-0.105391[/C][C]-0.8943[/C][C]0.187077[/C][/ROW]
[ROW][C]30[/C][C]-0.143636[/C][C]-1.2188[/C][C]0.113451[/C][/ROW]
[ROW][C]31[/C][C]-0.163122[/C][C]-1.3841[/C][C]0.085296[/C][/ROW]
[ROW][C]32[/C][C]-0.179582[/C][C]-1.5238[/C][C]0.065969[/C][/ROW]
[ROW][C]33[/C][C]-0.205869[/C][C]-1.7469[/C][C]0.042464[/C][/ROW]
[ROW][C]34[/C][C]-0.226968[/C][C]-1.9259[/C][C]0.029034[/C][/ROW]
[ROW][C]35[/C][C]-0.245405[/C][C]-2.0823[/C][C]0.020433[/C][/ROW]
[ROW][C]36[/C][C]-0.258817[/C][C]-2.1961[/C][C]0.015652[/C][/ROW]
[ROW][C]37[/C][C]-0.285871[/C][C]-2.4257[/C][C]0.008893[/C][/ROW]
[ROW][C]38[/C][C]-0.308751[/C][C]-2.6198[/C][C]0.005361[/C][/ROW]
[ROW][C]39[/C][C]-0.330443[/C][C]-2.8039[/C][C]0.003242[/C][/ROW]
[ROW][C]40[/C][C]-0.345399[/C][C]-2.9308[/C][C]0.002264[/C][/ROW]
[ROW][C]41[/C][C]-0.368276[/C][C]-3.1249[/C][C]0.001282[/C][/ROW]
[ROW][C]42[/C][C]-0.390528[/C][C]-3.3137[/C][C]0.000721[/C][/ROW]
[ROW][C]43[/C][C]-0.394446[/C][C]-3.347[/C][C]0.000651[/C][/ROW]
[ROW][C]44[/C][C]-0.394602[/C][C]-3.3483[/C][C]0.000648[/C][/ROW]
[ROW][C]45[/C][C]-0.398533[/C][C]-3.3817[/C][C]0.000584[/C][/ROW]
[ROW][C]46[/C][C]-0.402156[/C][C]-3.4124[/C][C]0.00053[/C][/ROW]
[ROW][C]47[/C][C]-0.40276[/C][C]-3.4175[/C][C]0.000521[/C][/ROW]
[ROW][C]48[/C][C]-0.398248[/C][C]-3.3792[/C][C]0.000588[/C][/ROW]
[/TABLE]
Source: https://freestatistics.org/blog/index.php?pk=205259&T=1

Globally Unique Identifier (entire table): ba.freestatistics.org/blog/index.php?pk=205259&T=1

As an alternative you can also use a QR Code:  

The GUIDs for individual cells are displayed in the table below:

Autocorrelation Function
Time lag kACF(k)T-STATP-value
10.9505818.06590
20.9060727.68830
30.8644387.3350
40.8256627.0060
50.7780256.60180
60.7290246.1860
70.6998315.93830
80.6717725.70020
90.6341585.3810
100.5976065.07091e-06
110.5654184.79774e-06
120.5339614.53081.1e-05
130.4853584.11845e-05
140.4417683.74850.000178
150.4005843.39910.000553
160.3620273.07190.001501
170.3183532.70130.004303
180.2726022.31310.011789
190.246562.09210.019976
200.2191251.85930.033533
210.1822231.54620.063219
220.1468091.24570.108454
230.11440.97070.167471
240.0867440.7360.232047
250.0437070.37090.355913
260.0050290.04270.48304
27-0.030313-0.25720.398874
28-0.065535-0.55610.28994
29-0.105391-0.89430.187077
30-0.143636-1.21880.113451
31-0.163122-1.38410.085296
32-0.179582-1.52380.065969
33-0.205869-1.74690.042464
34-0.226968-1.92590.029034
35-0.245405-2.08230.020433
36-0.258817-2.19610.015652
37-0.285871-2.42570.008893
38-0.308751-2.61980.005361
39-0.330443-2.80390.003242
40-0.345399-2.93080.002264
41-0.368276-3.12490.001282
42-0.390528-3.31370.000721
43-0.394446-3.3470.000651
44-0.394602-3.34830.000648
45-0.398533-3.38170.000584
46-0.402156-3.41240.00053
47-0.40276-3.41750.000521
48-0.398248-3.37920.000588


Partial Autocorrelation Function
Time lag kPACF(k)T-STATP-value
10.9505818.06590
20.0255990.21720.414327
30.0088990.07550.47001
40.0102770.08720.465375
5-0.109409-0.92840.178159
6-0.047951-0.40690.342653
70.1739611.47610.072138
80.007480.06350.474784
9-0.104597-0.88750.188872
10-0.004826-0.0410.483723
11-0.009031-0.07660.469564
12-0.026104-0.22150.412666
13-0.15217-1.29120.100382
140.01980.1680.433524
15-0.038771-0.3290.371562
16-0.009616-0.08160.467597
17-0.037262-0.31620.376392
18-0.060189-0.51070.305554
190.1198651.01710.156259
20-0.017333-0.14710.44174
21-0.101743-0.86330.195416
22-0.007963-0.06760.473159
23-0.035014-0.29710.383622
240.0016750.01420.494349
25-0.099594-0.84510.200432
260.000210.00180.49929
27-0.04986-0.42310.336751
28-0.050558-0.4290.334603
29-0.039754-0.33730.368426
30-0.015539-0.13190.447735
310.0866480.73520.232294
320.0349840.29690.383717
33-0.098763-0.8380.202392
340.0160.13580.446193
35-0.03335-0.2830.389001
36-0.003076-0.02610.489623
37-0.054072-0.45880.323875
380.0017420.01480.494125
39-0.085922-0.72910.234162
400.0367930.31220.377896
41-0.070203-0.59570.276626
42-0.032413-0.2750.392039
430.0899320.76310.22395
440.0299660.25430.400007
45-0.02585-0.21930.413501
46-0.022226-0.18860.425471
47-0.025068-0.21270.416079
48-0.007445-0.06320.474901

\begin{tabular}{lllllllll}
\hline
Partial Autocorrelation Function \tabularnewline
Time lag k & PACF(k) & T-STAT & P-value \tabularnewline
1 & 0.950581 & 8.0659 & 0 \tabularnewline
2 & 0.025599 & 0.2172 & 0.414327 \tabularnewline
3 & 0.008899 & 0.0755 & 0.47001 \tabularnewline
4 & 0.010277 & 0.0872 & 0.465375 \tabularnewline
5 & -0.109409 & -0.9284 & 0.178159 \tabularnewline
6 & -0.047951 & -0.4069 & 0.342653 \tabularnewline
7 & 0.173961 & 1.4761 & 0.072138 \tabularnewline
8 & 0.00748 & 0.0635 & 0.474784 \tabularnewline
9 & -0.104597 & -0.8875 & 0.188872 \tabularnewline
10 & -0.004826 & -0.041 & 0.483723 \tabularnewline
11 & -0.009031 & -0.0766 & 0.469564 \tabularnewline
12 & -0.026104 & -0.2215 & 0.412666 \tabularnewline
13 & -0.15217 & -1.2912 & 0.100382 \tabularnewline
14 & 0.0198 & 0.168 & 0.433524 \tabularnewline
15 & -0.038771 & -0.329 & 0.371562 \tabularnewline
16 & -0.009616 & -0.0816 & 0.467597 \tabularnewline
17 & -0.037262 & -0.3162 & 0.376392 \tabularnewline
18 & -0.060189 & -0.5107 & 0.305554 \tabularnewline
19 & 0.119865 & 1.0171 & 0.156259 \tabularnewline
20 & -0.017333 & -0.1471 & 0.44174 \tabularnewline
21 & -0.101743 & -0.8633 & 0.195416 \tabularnewline
22 & -0.007963 & -0.0676 & 0.473159 \tabularnewline
23 & -0.035014 & -0.2971 & 0.383622 \tabularnewline
24 & 0.001675 & 0.0142 & 0.494349 \tabularnewline
25 & -0.099594 & -0.8451 & 0.200432 \tabularnewline
26 & 0.00021 & 0.0018 & 0.49929 \tabularnewline
27 & -0.04986 & -0.4231 & 0.336751 \tabularnewline
28 & -0.050558 & -0.429 & 0.334603 \tabularnewline
29 & -0.039754 & -0.3373 & 0.368426 \tabularnewline
30 & -0.015539 & -0.1319 & 0.447735 \tabularnewline
31 & 0.086648 & 0.7352 & 0.232294 \tabularnewline
32 & 0.034984 & 0.2969 & 0.383717 \tabularnewline
33 & -0.098763 & -0.838 & 0.202392 \tabularnewline
34 & 0.016 & 0.1358 & 0.446193 \tabularnewline
35 & -0.03335 & -0.283 & 0.389001 \tabularnewline
36 & -0.003076 & -0.0261 & 0.489623 \tabularnewline
37 & -0.054072 & -0.4588 & 0.323875 \tabularnewline
38 & 0.001742 & 0.0148 & 0.494125 \tabularnewline
39 & -0.085922 & -0.7291 & 0.234162 \tabularnewline
40 & 0.036793 & 0.3122 & 0.377896 \tabularnewline
41 & -0.070203 & -0.5957 & 0.276626 \tabularnewline
42 & -0.032413 & -0.275 & 0.392039 \tabularnewline
43 & 0.089932 & 0.7631 & 0.22395 \tabularnewline
44 & 0.029966 & 0.2543 & 0.400007 \tabularnewline
45 & -0.02585 & -0.2193 & 0.413501 \tabularnewline
46 & -0.022226 & -0.1886 & 0.425471 \tabularnewline
47 & -0.025068 & -0.2127 & 0.416079 \tabularnewline
48 & -0.007445 & -0.0632 & 0.474901 \tabularnewline
\hline
\end{tabular}
%Source: https://freestatistics.org/blog/index.php?pk=205259&T=2

[TABLE]
[ROW][C]Partial Autocorrelation Function[/C][/ROW]
[ROW][C]Time lag k[/C][C]PACF(k)[/C][C]T-STAT[/C][C]P-value[/C][/ROW]
[ROW][C]1[/C][C]0.950581[/C][C]8.0659[/C][C]0[/C][/ROW]
[ROW][C]2[/C][C]0.025599[/C][C]0.2172[/C][C]0.414327[/C][/ROW]
[ROW][C]3[/C][C]0.008899[/C][C]0.0755[/C][C]0.47001[/C][/ROW]
[ROW][C]4[/C][C]0.010277[/C][C]0.0872[/C][C]0.465375[/C][/ROW]
[ROW][C]5[/C][C]-0.109409[/C][C]-0.9284[/C][C]0.178159[/C][/ROW]
[ROW][C]6[/C][C]-0.047951[/C][C]-0.4069[/C][C]0.342653[/C][/ROW]
[ROW][C]7[/C][C]0.173961[/C][C]1.4761[/C][C]0.072138[/C][/ROW]
[ROW][C]8[/C][C]0.00748[/C][C]0.0635[/C][C]0.474784[/C][/ROW]
[ROW][C]9[/C][C]-0.104597[/C][C]-0.8875[/C][C]0.188872[/C][/ROW]
[ROW][C]10[/C][C]-0.004826[/C][C]-0.041[/C][C]0.483723[/C][/ROW]
[ROW][C]11[/C][C]-0.009031[/C][C]-0.0766[/C][C]0.469564[/C][/ROW]
[ROW][C]12[/C][C]-0.026104[/C][C]-0.2215[/C][C]0.412666[/C][/ROW]
[ROW][C]13[/C][C]-0.15217[/C][C]-1.2912[/C][C]0.100382[/C][/ROW]
[ROW][C]14[/C][C]0.0198[/C][C]0.168[/C][C]0.433524[/C][/ROW]
[ROW][C]15[/C][C]-0.038771[/C][C]-0.329[/C][C]0.371562[/C][/ROW]
[ROW][C]16[/C][C]-0.009616[/C][C]-0.0816[/C][C]0.467597[/C][/ROW]
[ROW][C]17[/C][C]-0.037262[/C][C]-0.3162[/C][C]0.376392[/C][/ROW]
[ROW][C]18[/C][C]-0.060189[/C][C]-0.5107[/C][C]0.305554[/C][/ROW]
[ROW][C]19[/C][C]0.119865[/C][C]1.0171[/C][C]0.156259[/C][/ROW]
[ROW][C]20[/C][C]-0.017333[/C][C]-0.1471[/C][C]0.44174[/C][/ROW]
[ROW][C]21[/C][C]-0.101743[/C][C]-0.8633[/C][C]0.195416[/C][/ROW]
[ROW][C]22[/C][C]-0.007963[/C][C]-0.0676[/C][C]0.473159[/C][/ROW]
[ROW][C]23[/C][C]-0.035014[/C][C]-0.2971[/C][C]0.383622[/C][/ROW]
[ROW][C]24[/C][C]0.001675[/C][C]0.0142[/C][C]0.494349[/C][/ROW]
[ROW][C]25[/C][C]-0.099594[/C][C]-0.8451[/C][C]0.200432[/C][/ROW]
[ROW][C]26[/C][C]0.00021[/C][C]0.0018[/C][C]0.49929[/C][/ROW]
[ROW][C]27[/C][C]-0.04986[/C][C]-0.4231[/C][C]0.336751[/C][/ROW]
[ROW][C]28[/C][C]-0.050558[/C][C]-0.429[/C][C]0.334603[/C][/ROW]
[ROW][C]29[/C][C]-0.039754[/C][C]-0.3373[/C][C]0.368426[/C][/ROW]
[ROW][C]30[/C][C]-0.015539[/C][C]-0.1319[/C][C]0.447735[/C][/ROW]
[ROW][C]31[/C][C]0.086648[/C][C]0.7352[/C][C]0.232294[/C][/ROW]
[ROW][C]32[/C][C]0.034984[/C][C]0.2969[/C][C]0.383717[/C][/ROW]
[ROW][C]33[/C][C]-0.098763[/C][C]-0.838[/C][C]0.202392[/C][/ROW]
[ROW][C]34[/C][C]0.016[/C][C]0.1358[/C][C]0.446193[/C][/ROW]
[ROW][C]35[/C][C]-0.03335[/C][C]-0.283[/C][C]0.389001[/C][/ROW]
[ROW][C]36[/C][C]-0.003076[/C][C]-0.0261[/C][C]0.489623[/C][/ROW]
[ROW][C]37[/C][C]-0.054072[/C][C]-0.4588[/C][C]0.323875[/C][/ROW]
[ROW][C]38[/C][C]0.001742[/C][C]0.0148[/C][C]0.494125[/C][/ROW]
[ROW][C]39[/C][C]-0.085922[/C][C]-0.7291[/C][C]0.234162[/C][/ROW]
[ROW][C]40[/C][C]0.036793[/C][C]0.3122[/C][C]0.377896[/C][/ROW]
[ROW][C]41[/C][C]-0.070203[/C][C]-0.5957[/C][C]0.276626[/C][/ROW]
[ROW][C]42[/C][C]-0.032413[/C][C]-0.275[/C][C]0.392039[/C][/ROW]
[ROW][C]43[/C][C]0.089932[/C][C]0.7631[/C][C]0.22395[/C][/ROW]
[ROW][C]44[/C][C]0.029966[/C][C]0.2543[/C][C]0.400007[/C][/ROW]
[ROW][C]45[/C][C]-0.02585[/C][C]-0.2193[/C][C]0.413501[/C][/ROW]
[ROW][C]46[/C][C]-0.022226[/C][C]-0.1886[/C][C]0.425471[/C][/ROW]
[ROW][C]47[/C][C]-0.025068[/C][C]-0.2127[/C][C]0.416079[/C][/ROW]
[ROW][C]48[/C][C]-0.007445[/C][C]-0.0632[/C][C]0.474901[/C][/ROW]
[/TABLE]
Source: https://freestatistics.org/blog/index.php?pk=205259&T=2

Globally Unique Identifier (entire table): ba.freestatistics.org/blog/index.php?pk=205259&T=2

As an alternative you can also use a QR Code:  

The GUIDs for individual cells are displayed in the table below:

Partial Autocorrelation Function
Time lag kPACF(k)T-STATP-value
10.9505818.06590
20.0255990.21720.414327
30.0088990.07550.47001
40.0102770.08720.465375
5-0.109409-0.92840.178159
6-0.047951-0.40690.342653
70.1739611.47610.072138
80.007480.06350.474784
9-0.104597-0.88750.188872
10-0.004826-0.0410.483723
11-0.009031-0.07660.469564
12-0.026104-0.22150.412666
13-0.15217-1.29120.100382
140.01980.1680.433524
15-0.038771-0.3290.371562
16-0.009616-0.08160.467597
17-0.037262-0.31620.376392
18-0.060189-0.51070.305554
190.1198651.01710.156259
20-0.017333-0.14710.44174
21-0.101743-0.86330.195416
22-0.007963-0.06760.473159
23-0.035014-0.29710.383622
240.0016750.01420.494349
25-0.099594-0.84510.200432
260.000210.00180.49929
27-0.04986-0.42310.336751
28-0.050558-0.4290.334603
29-0.039754-0.33730.368426
30-0.015539-0.13190.447735
310.0866480.73520.232294
320.0349840.29690.383717
33-0.098763-0.8380.202392
340.0160.13580.446193
35-0.03335-0.2830.389001
36-0.003076-0.02610.489623
37-0.054072-0.45880.323875
380.0017420.01480.494125
39-0.085922-0.72910.234162
400.0367930.31220.377896
41-0.070203-0.59570.276626
42-0.032413-0.2750.392039
430.0899320.76310.22395
440.0299660.25430.400007
45-0.02585-0.21930.413501
46-0.022226-0.18860.425471
47-0.025068-0.21270.416079
48-0.007445-0.06320.474901


Parameters (Session):
par1 = 48 ; par2 = 1 ; par3 = 0 ; par4 = 0 ; par5 = 12 ; par6 = White Noise ; par7 = 0.95 ;
Parameters (R input):
par1 = 48 ; par2 = 1 ; par3 = 0 ; par4 = 0 ; par5 = 12 ; par6 = White Noise ; par7 = 0.95 ; par8 = ;
R code (references can be found in the software module):
if (par1 == 'Default') {
par1 = 10*log10(length(x))
} else {
par1 <- as.numeric(par1)
}
par2 <- as.numeric(par2)
par3 <- as.numeric(par3)
par4 <- as.numeric(par4)
par5 <- as.numeric(par5)
if (par6 == 'White Noise') par6 <- 'white' else par6 <- 'ma'
par7 <- as.numeric(par7)
if (par8 != '') par8 <- as.numeric(par8)
ox <- x
if (par8 == '') {
if (par2 == 0) {
x <- log(x)
} else {
x <- (x ^ par2 - 1) / par2
}
} else {
x <- log(x,base=par8)
}
if (par3 > 0) x <- diff(x,lag=1,difference=par3)
if (par4 > 0) x <- diff(x,lag=par5,difference=par4)
bitmap(file='picts.png')
op <- par(mfrow=c(2,1))
plot(ox,type='l',main='Original Time Series',xlab='time',ylab='value')
if (par8=='') {
mytitle <- paste('Working Time Series (lambda=',par2,', d=',par3,', D=',par4,')',sep='')
mysub <- paste('(lambda=',par2,', d=',par3,', D=',par4,', CI=', par7, ', CI type=',par6,')',sep='')
} else {
mytitle <- paste('Working Time Series (base=',par8,', d=',par3,', D=',par4,')',sep='')
mysub <- paste('(base=',par8,', d=',par3,', D=',par4,', CI=', par7, ', CI type=',par6,')',sep='')
}
plot(x,type='l', main=mytitle,xlab='time',ylab='value')
par(op)
dev.off()
bitmap(file='pic1.png')
racf <- acf(x, par1, main='Autocorrelation', xlab='time lag', ylab='ACF', ci.type=par6, ci=par7, sub=mysub)
dev.off()
bitmap(file='pic2.png')
rpacf <- pacf(x,par1,main='Partial Autocorrelation',xlab='lags',ylab='PACF',sub=mysub)
dev.off()
(myacf <- c(racf$acf))
(mypacf <- c(rpacf$acf))
lengthx <- length(x)
sqrtn <- sqrt(lengthx)
load(file='createtable')
a<-table.start()
a<-table.row.start(a)
a<-table.element(a,'Autocorrelation Function',4,TRUE)
a<-table.row.end(a)
a<-table.row.start(a)
a<-table.element(a,'Time lag k',header=TRUE)
a<-table.element(a,hyperlink('basics.htm','ACF(k)','click here for more information about the Autocorrelation Function'),header=TRUE)
a<-table.element(a,'T-STAT',header=TRUE)
a<-table.element(a,'P-value',header=TRUE)
a<-table.row.end(a)
for (i in 2:(par1+1)) {
a<-table.row.start(a)
a<-table.element(a,i-1,header=TRUE)
a<-table.element(a,round(myacf[i],6))
mytstat <- myacf[i]*sqrtn
a<-table.element(a,round(mytstat,4))
a<-table.element(a,round(1-pt(abs(mytstat),lengthx),6))
a<-table.row.end(a)
}
a<-table.end(a)
table.save(a,file='mytable.tab')
a<-table.start()
a<-table.row.start(a)
a<-table.element(a,'Partial Autocorrelation Function',4,TRUE)
a<-table.row.end(a)
a<-table.row.start(a)
a<-table.element(a,'Time lag k',header=TRUE)
a<-table.element(a,hyperlink('basics.htm','PACF(k)','click here for more information about the Partial Autocorrelation Function'),header=TRUE)
a<-table.element(a,'T-STAT',header=TRUE)
a<-table.element(a,'P-value',header=TRUE)
a<-table.row.end(a)
for (i in 1:par1) {
a<-table.row.start(a)
a<-table.element(a,i,header=TRUE)
a<-table.element(a,round(mypacf[i],6))
mytstat <- mypacf[i]*sqrtn
a<-table.element(a,round(mytstat,4))
a<-table.element(a,round(1-pt(abs(mytstat),lengthx),6))
a<-table.row.end(a)
}
a<-table.end(a)
table.save(a,file='mytable1.tab')