Free Statistics
of Irreproducible Research!
Description of Statistical Computation | |||||||||||||||||||||||||||||||||||||||||
|---|---|---|---|---|---|---|---|---|---|---|---|---|---|---|---|---|---|---|---|---|---|---|---|---|---|---|---|---|---|---|---|---|---|---|---|---|---|---|---|---|---|
| Author's title | |||||||||||||||||||||||||||||||||||||||||
| Author | *Unverified author* | ||||||||||||||||||||||||||||||||||||||||
| R Software Module | rwasp_univariatedataseries.wasp | ||||||||||||||||||||||||||||||||||||||||
| Title produced by software | Univariate Data Series | ||||||||||||||||||||||||||||||||||||||||
| Date of computation | Sun, 17 Feb 2013 15:11:28 -0500 | ||||||||||||||||||||||||||||||||||||||||
| Cite this page as follows | Statistical Computations at FreeStatistics.org, Office for Research Development and Education, URL https://freestatistics.org/blog/index.php?v=date/2013/Feb/17/t13611319852unhfhslddtifsh.htm/, Retrieved Thu, 03 Jul 2025 14:45:52 +0000 | ||||||||||||||||||||||||||||||||||||||||
| Statistical Computations at FreeStatistics.org, Office for Research Development and Education, URL https://freestatistics.org/blog/index.php?pk=206535, Retrieved Thu, 03 Jul 2025 14:45:52 +0000 | |||||||||||||||||||||||||||||||||||||||||
| QR Codes: | |||||||||||||||||||||||||||||||||||||||||
|
| |||||||||||||||||||||||||||||||||||||||||
| Original text written by user: | |||||||||||||||||||||||||||||||||||||||||
| IsPrivate? | No (this computation is public) | ||||||||||||||||||||||||||||||||||||||||
| User-defined keywords | yasmien.naciri@student.kdg.be | ||||||||||||||||||||||||||||||||||||||||
| Estimated Impact | 258 | ||||||||||||||||||||||||||||||||||||||||
Tree of Dependent Computations | |||||||||||||||||||||||||||||||||||||||||
| Family? (F = Feedback message, R = changed R code, M = changed R Module, P = changed Parameters, D = changed Data) | |||||||||||||||||||||||||||||||||||||||||
| - [Univariate Data Series] [] [2013-02-17 20:11:28] [d06e8713ea83045a022ab0926c74dd0b] [Current] | |||||||||||||||||||||||||||||||||||||||||
| Feedback Forum | |||||||||||||||||||||||||||||||||||||||||
Post a new message | |||||||||||||||||||||||||||||||||||||||||
Dataset | |||||||||||||||||||||||||||||||||||||||||
| Dataseries X: | |||||||||||||||||||||||||||||||||||||||||
20 25 15 15 25 25 25 21 30 25 20 40 13 30 25 20 25 20 25 20 20 15 15 12 20 5 20 15 25 22 20 22 25 20 20 35 30 25 20 20 20 25 25 15 20 35 25 25 30 23 10 22 25 25 22 30 20 25 25 22 25 25 25 22 25 12 18 20 20 22 30 25 22 20 50 30 25 20 30 22 25 30 22 25 22 22 25 25 25 20 22 15 20 30 20 25 30 35 22 12 30 15 10 30 9 25 20 20 35 25 35 30 12 25 15 25 25 20 20 6 15 40 20 40 25 25 20 15 15 22 24 22 20 25 25 25 35 40 20 22 22 20 25 25 18 25 20 25 30 20 22 35 22 25 25 25 25 22 23 35 15 25 18 22 25 25 28 30 20 25 25 30 22 30 10 10 25 20 22 25 25 15 22 25 25 28 22 30 25 20 25 25 20 30 20 30 50 19 20 28 20 25 35 25 25 15 16 20 20 25 30 20 25 25 25 20 20 25 25 30 22 20 25 25 18 18 20 25 25 30 25 20 25 20 20 20 22 18 22 20 15 25 25 20 25 15 22 25 25 15 12 25 30 22 15 22 25 12 18 30 25 25 40 24 25 15 25 20 25 25 25 20 30 20 25 30 22 25 25 25 50 19 50 25 35 20 20 20 20 20 25 25 25 20 20 20 20 25 18 25 22 22 30 30 8 20 25 30 50 22 20 10 25 25 25 25 18 25 20 25 30 18 20 25 22 22 20 20 25 20 20 20 20 25 20 10 20 25 30 25 50 30 30 50 15 25 25 22 20 22 30 25 18 22 22 30 40 25 20 10 20 9 15 20 15 20 30 12 15 12 20 15 12 25 20 25 25 25 30 20 25 15 15 22 10 15 10 20 25 20 20 38 20 20 20 40 25 25 30 25 10 20 25 12 15 25 20 22 22 20 25 25 25 15 40 20 20 16 25 15 20 25 20 30 50 20 25 20 30 30 25 25 12 25 25 25 20 20 20 15 20 25 15 25 50 30 20 20 25 12 15 20 20 35 22 15 18 30 22 12 12 20 20 15 25 15 20 20 25 18 30 20 25 25 25 20 20 25 20 22 15 15 22 20 10 25 20 20 15 12 20 5 20 15 15 25 25 25 15 25 22 25 20 18 22 25 35 25 25 25 35 30 22 30 50 15 25 24 20 25 25 25 12 15 22 25 25 25 25 15 20 20 15 35 30 20 22 65 20 25 22 20 25 25 20 25 15 20 12 15 10 25 15 30 35 25 25 25 25 25 40 40 25 25 20 25 25 22 25 30 25 25 30 25 25 30 25 25 20 22 22 20 25 22 25 22 40 25 25 25 22 20 35 20 35 25 22 25 25 25 25 25 40 25 30 25 20 25 25 30 22 22 20 15 15 25 25 20 20 15 25 15 20 22 25 15 15 18 5 15 25 18 40 25 25 20 30 20 25 25 25 22 22 25 25 30 25 25 25 25 20 20 25 25 25 25 20 30 25 22 30 20 20 30 25 25 30 20 25 25 24 25 30 18 15 22 22 25 22 22 25 15 20 22 18 35 20 20 20 25 25 30 15 25 22 26 25 20 25 25 25 22 25 25 20 22 30 15 30 25 20 25 25 35 22 20 25 20 20 18 20 22 25 10 20 25 20 20 30 25 20 15 20 25 10 20 25 22 22 25 25 15 25 20 10 25 16 25 35 25 15 25 25 30 25 10 22 20 25 20 20 25 22 18 30 19 25 20 25 20 25 20 22 12 30 12 22 25 25 25 25 30 30 10 22 22 25 20 22 20 25 20 15 25 20 25 20 30 15 40 25 20 22 22 30 20 40 20 25 20 25 20 50 50 25 25 40 30 22 30 20 25 25 30 25 25 20 18 18 28 25 22 15 40 40 12 12 18 12 25 26 18 25 22 15 25 15 15 15 25 15 12 22 20 20 25 20 12 9 15 12 15 25 20 20 15 15 30 21 25 22 22 50 15 25 15 25 22 18 50 20 50 20 20 30 25 20 22 25 50 40 25 25 25 25 30 40 25 30 20 | |||||||||||||||||||||||||||||||||||||||||
Tables (Output of Computation) | |||||||||||||||||||||||||||||||||||||||||
| |||||||||||||||||||||||||||||||||||||||||
Figures (Output of Computation) | |||||||||||||||||||||||||||||||||||||||||
Input Parameters & R Code | |||||||||||||||||||||||||||||||||||||||||
| Parameters (Session): | |||||||||||||||||||||||||||||||||||||||||
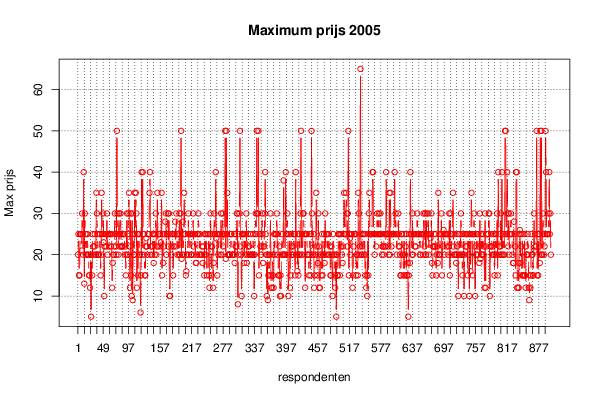
| par1 = Maximum prijs 2005 ; par2 = Gegevens van 2005 (onderzoek uitgevoerd tijdens de Grote Sinterklaasshow) ; par3 = deze reeks bevat het antwoord op de vraag hoeveel de respondenten bereid zijn te betalen voor een ticket van een Studio 100-show. ; par4 = 12 ; | |||||||||||||||||||||||||||||||||||||||||
| Parameters (R input): | |||||||||||||||||||||||||||||||||||||||||
| par1 = Maximum prijs 2005 ; par2 = Gegevens van 2005 (onderzoek uitgevoerd tijdens de Grote Sinterklaasshow) ; par3 = deze reeks bevat het antwoord op de vraag hoeveel de respondenten bereid zijn te betalen voor een ticket van een Studio 100-show. ; par4 = 12 ; | |||||||||||||||||||||||||||||||||||||||||
| R code (references can be found in the software module): | |||||||||||||||||||||||||||||||||||||||||
par4 <- '12' | |||||||||||||||||||||||||||||||||||||||||