Free Statistics

of Irreproducible Research!

Author's title

Author*Unverified author*
R Software Modulerwasp_density.wasp
Title produced by softwareKernel Density Estimation
Date of computationTue, 12 Feb 2013 07:56:43 -0500
Cite this page as followsStatistical Computations at FreeStatistics.org, Office for Research Development and Education, URL https://freestatistics.org/blog/index.php?v=date/2013/Feb/12/t1360673840rnte1fa2nc4v0xf.htm/, Retrieved Sun, 28 Apr 2024 22:12:08 +0000
Statistical Computations at FreeStatistics.org, Office for Research Development and Education, URL https://freestatistics.org/blog/index.php?pk=206347, Retrieved Sun, 28 Apr 2024 22:12:08 +0000
QR Codes:

Original text written by user:
IsPrivate?No (this computation is public)
User-defined keywords
Estimated Impact138
Family? (F = Feedback message, R = changed R code, M = changed R Module, P = changed Parameters, D = changed Data)
-     [Univariate Data Series] [Consumptieprijzen...] [2013-02-01 11:29:49] [f607a989912a6fca40f958aabcb37be8]
- RMPD    [Kernel Density Estimation] [Dichtheidsgrafiek...] [2013-02-12 12:56:43] [4772101fb1e8fea1eb9b6fc7ea4f009e] [Current]
Feedback Forum

Post a new message
Dataseries X:
0.67
0.66
0.66
0.67
0.67
0.67
0.67
0.68
0.68
0.67
0.67
0.67
0.67
0.67
0.69
0.69
0.69
0.69
0.69
0.69
0.7
0.69
0.68
0.7
0.7
0.71
0.69
0.7
0.7
0.71
0.71
0.71
0.71
0.7
0.7
0.71
0.71
0.71
0.71
0.7
0.69
0.7
0.7
0.7
0.71
0.7
0.7
0.69
0.7
0.71
0.71
0.71
0.71
0.71
0.71
0.71
0.71
0.69
0.7
0.7
0.7
0.72
0.7
0.69
0.7
0.71
0.72
0.72
0.73
0.72
0.74
0.75


Summary of computational transaction
Raw Inputview raw input (R code)
Raw Outputview raw output of R engine
Computing time6 seconds
R Server'George Udny Yule' @ yule.wessa.net

\begin{tabular}{lllllllll}
\hline
Summary of computational transaction \tabularnewline
Raw Input & view raw input (R code)  \tabularnewline
Raw Output & view raw output of R engine  \tabularnewline
Computing time & 6 seconds \tabularnewline
R Server & 'George Udny Yule' @ yule.wessa.net \tabularnewline
\hline
\end{tabular}
%Source: https://freestatistics.org/blog/index.php?pk=206347&T=0

[TABLE]
[ROW][C]Summary of computational transaction[/C][/ROW]
[ROW][C]Raw Input[/C][C]view raw input (R code) [/C][/ROW]
[ROW][C]Raw Output[/C][C]view raw output of R engine [/C][/ROW]
[ROW][C]Computing time[/C][C]6 seconds[/C][/ROW]
[ROW][C]R Server[/C][C]'George Udny Yule' @ yule.wessa.net[/C][/ROW]
[/TABLE]
Source: https://freestatistics.org/blog/index.php?pk=206347&T=0

Globally Unique Identifier (entire table): ba.freestatistics.org/blog/index.php?pk=206347&T=0

As an alternative you can also use a QR Code:  

The GUIDs for individual cells are displayed in the table below:

Summary of computational transaction
Raw Inputview raw input (R code)
Raw Outputview raw output of R engine
Computing time6 seconds
R Server'George Udny Yule' @ yule.wessa.net


Properties of Density Trace
Bandwidth0.00571085597295131
#Observations72

\begin{tabular}{lllllllll}
\hline
Properties of Density Trace \tabularnewline
Bandwidth & 0.00571085597295131 \tabularnewline
#Observations & 72 \tabularnewline
\hline
\end{tabular}
%Source: https://freestatistics.org/blog/index.php?pk=206347&T=1

[TABLE]
[ROW][C]Properties of Density Trace[/C][/ROW]
[ROW][C]Bandwidth[/C][C]0.00571085597295131[/C][/ROW]
[ROW][C]#Observations[/C][C]72[/C][/ROW]
[/TABLE]
Source: https://freestatistics.org/blog/index.php?pk=206347&T=1

Globally Unique Identifier (entire table): ba.freestatistics.org/blog/index.php?pk=206347&T=1

As an alternative you can also use a QR Code:  

The GUIDs for individual cells are displayed in the table below:

Properties of Density Trace
Bandwidth0.00571085597295131
#Observations72


Maximum Density Values
Kernelx-valuemax. density
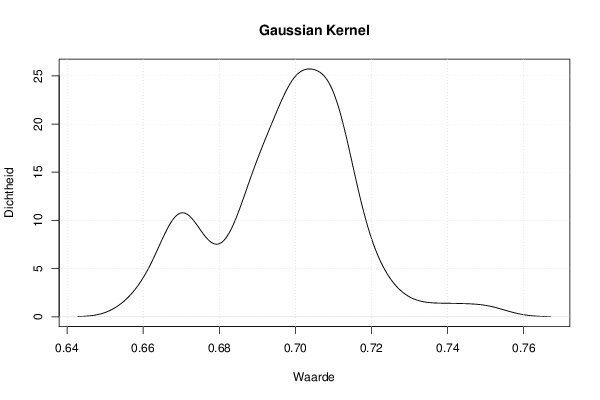
Gaussian0.70366250832268625.7175584266782
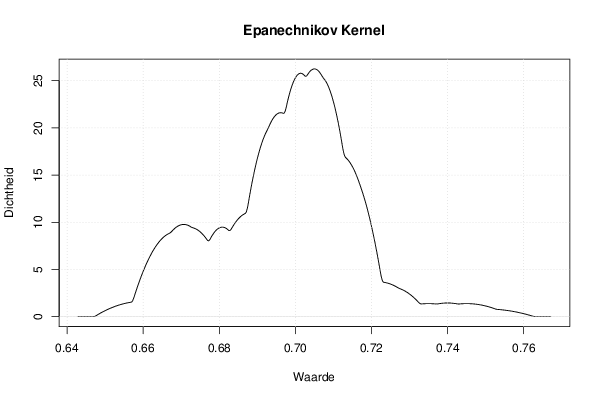
Epanechnikov0.70487840984751726.2440911205937
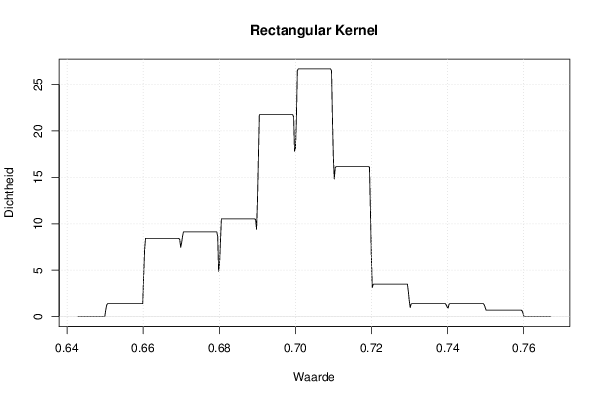
Rectangular0.70074434466309226.6783686644815
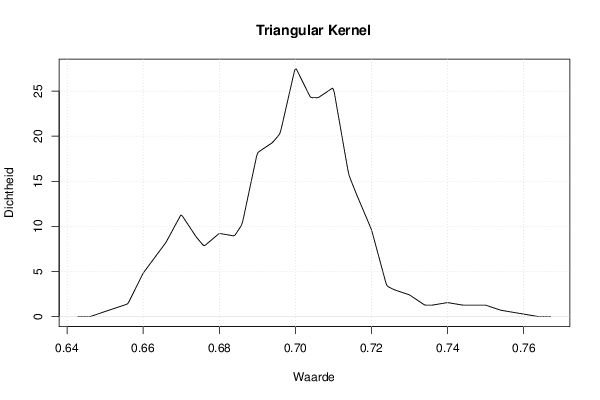
Triangular0.70001480374819427.4451185725052
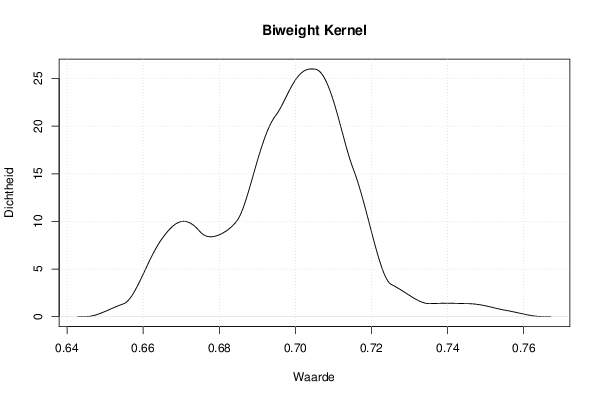
Biweight0.70414886893261826.0006220886991
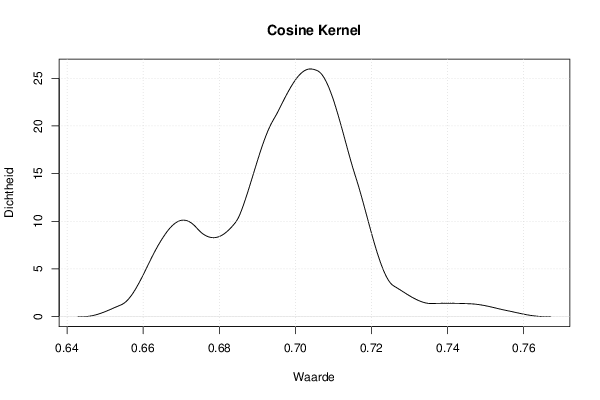
Cosine0.70390568862765225.9791157987169
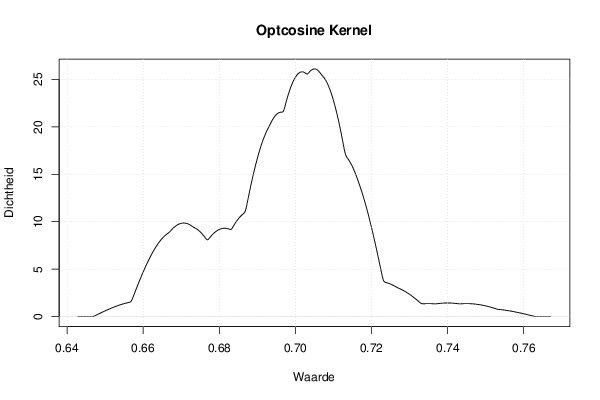
Optcosine0.70487840984751726.098878650513

\begin{tabular}{lllllllll}
\hline
Maximum Density Values \tabularnewline
Kernel & x-value & max. density \tabularnewline
Gaussian & 0.703662508322686 & 25.7175584266782 \tabularnewline
Epanechnikov & 0.704878409847517 & 26.2440911205937 \tabularnewline
Rectangular & 0.700744344663092 & 26.6783686644815 \tabularnewline
Triangular & 0.700014803748194 & 27.4451185725052 \tabularnewline
Biweight & 0.704148868932618 & 26.0006220886991 \tabularnewline
Cosine & 0.703905688627652 & 25.9791157987169 \tabularnewline
Optcosine & 0.704878409847517 & 26.098878650513 \tabularnewline
 \hline
\end{tabular}
%Source: https://freestatistics.org/blog/index.php?pk=206347&T=2

[TABLE]
[ROW][C]Maximum Density Values[/C][/ROW]
[ROW][C]Kernel[/C][C]x-value[/C][C]max. density[/C][/ROW]
[ROW][C]Gaussian[/C][C]0.703662508322686[/C][C]25.7175584266782[/C][/ROW]
[ROW][C]Epanechnikov[/C][C]0.704878409847517[/C][C]26.2440911205937[/C][/ROW]
[ROW][C]Rectangular[/C][C]0.700744344663092[/C][C]26.6783686644815[/C][/ROW]
[ROW][C]Triangular[/C][C]0.700014803748194[/C][C]27.4451185725052[/C][/ROW]
[ROW][C]Biweight[/C][C]0.704148868932618[/C][C]26.0006220886991[/C][/ROW]
[ROW][C]Cosine[/C][C]0.703905688627652[/C][C]25.9791157987169[/C][/ROW]
[ROW][C]Optcosine[/C][C]0.704878409847517[/C][C]26.098878650513[/C][/ROW]
 [/TABLE]
Source: https://freestatistics.org/blog/index.php?pk=206347&T=2

Globally Unique Identifier (entire table): ba.freestatistics.org/blog/index.php?pk=206347&T=2

As an alternative you can also use a QR Code:  

The GUIDs for individual cells are displayed in the table below:

Maximum Density Values
Kernelx-valuemax. density
Gaussian0.70366250832268625.7175584266782
Epanechnikov0.70487840984751726.2440911205937
Rectangular0.70074434466309226.6783686644815
Triangular0.70001480374819427.4451185725052
Biweight0.70414886893261826.0006220886991
Cosine0.70390568862765225.9791157987169
Optcosine0.70487840984751726.098878650513


Maximum Density Values
Kernelx-valuemax. density
Gaussian0.70366250832268625.7175584266782
Epanechnikov0.70487840984751726.2440911205937
Rectangular0.70098752496805826.6783686644815
Triangular0.70001480374819427.4451185725052
Biweight0.70414886893261826.0006220886991
Cosine0.70390568862765225.9791157987169
Optcosine0.70487840984751726.098878650513

\begin{tabular}{lllllllll}
\hline
Maximum Density Values \tabularnewline
Kernel & x-value & max. density \tabularnewline
Gaussian & 0.703662508322686 & 25.7175584266782 \tabularnewline
Epanechnikov & 0.704878409847517 & 26.2440911205937 \tabularnewline
Rectangular & 0.700987524968058 & 26.6783686644815 \tabularnewline
Triangular & 0.700014803748194 & 27.4451185725052 \tabularnewline
Biweight & 0.704148868932618 & 26.0006220886991 \tabularnewline
Cosine & 0.703905688627652 & 25.9791157987169 \tabularnewline
Optcosine & 0.704878409847517 & 26.098878650513 \tabularnewline
 \hline
\end{tabular}
%Source: https://freestatistics.org/blog/index.php?pk=206347&T=3

[TABLE]
[ROW][C]Maximum Density Values[/C][/ROW]
[ROW][C]Kernel[/C][C]x-value[/C][C]max. density[/C][/ROW]
[ROW][C]Gaussian[/C][C]0.703662508322686[/C][C]25.7175584266782[/C][/ROW]
[ROW][C]Epanechnikov[/C][C]0.704878409847517[/C][C]26.2440911205937[/C][/ROW]
[ROW][C]Rectangular[/C][C]0.700987524968058[/C][C]26.6783686644815[/C][/ROW]
[ROW][C]Triangular[/C][C]0.700014803748194[/C][C]27.4451185725052[/C][/ROW]
[ROW][C]Biweight[/C][C]0.704148868932618[/C][C]26.0006220886991[/C][/ROW]
[ROW][C]Cosine[/C][C]0.703905688627652[/C][C]25.9791157987169[/C][/ROW]
[ROW][C]Optcosine[/C][C]0.704878409847517[/C][C]26.098878650513[/C][/ROW]
 [/TABLE]
Source: https://freestatistics.org/blog/index.php?pk=206347&T=3

Globally Unique Identifier (entire table): ba.freestatistics.org/blog/index.php?pk=206347&T=3

As an alternative you can also use a QR Code:  

The GUIDs for individual cells are displayed in the table below:

Maximum Density Values
Kernelx-valuemax. density
Gaussian0.70366250832268625.7175584266782
Epanechnikov0.70487840984751726.2440911205937
Rectangular0.70098752496805826.6783686644815
Triangular0.70001480374819427.4451185725052
Biweight0.70414886893261826.0006220886991
Cosine0.70390568862765225.9791157987169
Optcosine0.70487840984751726.098878650513


Maximum Density Values
Kernelx-valuemax. density
Gaussian0.70366250832268625.7175584266782
Epanechnikov0.70487840984751726.2440911205937
Rectangular0.70123070527302526.6783686644815
Triangular0.70001480374819427.4451185725052
Biweight0.70414886893261826.0006220886991
Cosine0.70390568862765225.9791157987169
Optcosine0.70487840984751726.098878650513

\begin{tabular}{lllllllll}
\hline
Maximum Density Values \tabularnewline
Kernel & x-value & max. density \tabularnewline
Gaussian & 0.703662508322686 & 25.7175584266782 \tabularnewline
Epanechnikov & 0.704878409847517 & 26.2440911205937 \tabularnewline
Rectangular & 0.701230705273025 & 26.6783686644815 \tabularnewline
Triangular & 0.700014803748194 & 27.4451185725052 \tabularnewline
Biweight & 0.704148868932618 & 26.0006220886991 \tabularnewline
Cosine & 0.703905688627652 & 25.9791157987169 \tabularnewline
Optcosine & 0.704878409847517 & 26.098878650513 \tabularnewline
 \hline
\end{tabular}
%Source: https://freestatistics.org/blog/index.php?pk=206347&T=4

[TABLE]
[ROW][C]Maximum Density Values[/C][/ROW]
[ROW][C]Kernel[/C][C]x-value[/C][C]max. density[/C][/ROW]
[ROW][C]Gaussian[/C][C]0.703662508322686[/C][C]25.7175584266782[/C][/ROW]
[ROW][C]Epanechnikov[/C][C]0.704878409847517[/C][C]26.2440911205937[/C][/ROW]
[ROW][C]Rectangular[/C][C]0.701230705273025[/C][C]26.6783686644815[/C][/ROW]
[ROW][C]Triangular[/C][C]0.700014803748194[/C][C]27.4451185725052[/C][/ROW]
[ROW][C]Biweight[/C][C]0.704148868932618[/C][C]26.0006220886991[/C][/ROW]
[ROW][C]Cosine[/C][C]0.703905688627652[/C][C]25.9791157987169[/C][/ROW]
[ROW][C]Optcosine[/C][C]0.704878409847517[/C][C]26.098878650513[/C][/ROW]
 [/TABLE]
Source: https://freestatistics.org/blog/index.php?pk=206347&T=4

Globally Unique Identifier (entire table): ba.freestatistics.org/blog/index.php?pk=206347&T=4

As an alternative you can also use a QR Code:  

The GUIDs for individual cells are displayed in the table below:

Maximum Density Values
Kernelx-valuemax. density
Gaussian0.70366250832268625.7175584266782
Epanechnikov0.70487840984751726.2440911205937
Rectangular0.70123070527302526.6783686644815
Triangular0.70001480374819427.4451185725052
Biweight0.70414886893261826.0006220886991
Cosine0.70390568862765225.9791157987169
Optcosine0.70487840984751726.098878650513


Maximum Density Values
Kernelx-valuemax. density
Gaussian0.70366250832268625.7175584266782
Epanechnikov0.70487840984751726.2440911205937
Rectangular0.70171706588295726.6783686644815
Triangular0.70001480374819427.4451185725052
Biweight0.70414886893261826.0006220886991
Cosine0.70390568862765225.9791157987169
Optcosine0.70487840984751726.098878650513

\begin{tabular}{lllllllll}
\hline
Maximum Density Values \tabularnewline
Kernel & x-value & max. density \tabularnewline
Gaussian & 0.703662508322686 & 25.7175584266782 \tabularnewline
Epanechnikov & 0.704878409847517 & 26.2440911205937 \tabularnewline
Rectangular & 0.701717065882957 & 26.6783686644815 \tabularnewline
Triangular & 0.700014803748194 & 27.4451185725052 \tabularnewline
Biweight & 0.704148868932618 & 26.0006220886991 \tabularnewline
Cosine & 0.703905688627652 & 25.9791157987169 \tabularnewline
Optcosine & 0.704878409847517 & 26.098878650513 \tabularnewline
 \hline
\end{tabular}
%Source: https://freestatistics.org/blog/index.php?pk=206347&T=5

[TABLE]
[ROW][C]Maximum Density Values[/C][/ROW]
[ROW][C]Kernel[/C][C]x-value[/C][C]max. density[/C][/ROW]
[ROW][C]Gaussian[/C][C]0.703662508322686[/C][C]25.7175584266782[/C][/ROW]
[ROW][C]Epanechnikov[/C][C]0.704878409847517[/C][C]26.2440911205937[/C][/ROW]
[ROW][C]Rectangular[/C][C]0.701717065882957[/C][C]26.6783686644815[/C][/ROW]
[ROW][C]Triangular[/C][C]0.700014803748194[/C][C]27.4451185725052[/C][/ROW]
[ROW][C]Biweight[/C][C]0.704148868932618[/C][C]26.0006220886991[/C][/ROW]
[ROW][C]Cosine[/C][C]0.703905688627652[/C][C]25.9791157987169[/C][/ROW]
[ROW][C]Optcosine[/C][C]0.704878409847517[/C][C]26.098878650513[/C][/ROW]
 [/TABLE]
Source: https://freestatistics.org/blog/index.php?pk=206347&T=5

Globally Unique Identifier (entire table): ba.freestatistics.org/blog/index.php?pk=206347&T=5

As an alternative you can also use a QR Code:  

The GUIDs for individual cells are displayed in the table below:

Maximum Density Values
Kernelx-valuemax. density
Gaussian0.70366250832268625.7175584266782
Epanechnikov0.70487840984751726.2440911205937
Rectangular0.70171706588295726.6783686644815
Triangular0.70001480374819427.4451185725052
Biweight0.70414886893261826.0006220886991
Cosine0.70390568862765225.9791157987169
Optcosine0.70487840984751726.098878650513


Maximum Density Values
Kernelx-valuemax. density
Gaussian0.70366250832268625.7175584266782
Epanechnikov0.70487840984751726.2440911205937
Rectangular0.70196024618792326.6783686644815
Triangular0.70001480374819427.4451185725052
Biweight0.70414886893261826.0006220886991
Cosine0.70390568862765225.9791157987169
Optcosine0.70487840984751726.098878650513

\begin{tabular}{lllllllll}
\hline
Maximum Density Values \tabularnewline
Kernel & x-value & max. density \tabularnewline
Gaussian & 0.703662508322686 & 25.7175584266782 \tabularnewline
Epanechnikov & 0.704878409847517 & 26.2440911205937 \tabularnewline
Rectangular & 0.701960246187923 & 26.6783686644815 \tabularnewline
Triangular & 0.700014803748194 & 27.4451185725052 \tabularnewline
Biweight & 0.704148868932618 & 26.0006220886991 \tabularnewline
Cosine & 0.703905688627652 & 25.9791157987169 \tabularnewline
Optcosine & 0.704878409847517 & 26.098878650513 \tabularnewline
 \hline
\end{tabular}
%Source: https://freestatistics.org/blog/index.php?pk=206347&T=6

[TABLE]
[ROW][C]Maximum Density Values[/C][/ROW]
[ROW][C]Kernel[/C][C]x-value[/C][C]max. density[/C][/ROW]
[ROW][C]Gaussian[/C][C]0.703662508322686[/C][C]25.7175584266782[/C][/ROW]
[ROW][C]Epanechnikov[/C][C]0.704878409847517[/C][C]26.2440911205937[/C][/ROW]
[ROW][C]Rectangular[/C][C]0.701960246187923[/C][C]26.6783686644815[/C][/ROW]
[ROW][C]Triangular[/C][C]0.700014803748194[/C][C]27.4451185725052[/C][/ROW]
[ROW][C]Biweight[/C][C]0.704148868932618[/C][C]26.0006220886991[/C][/ROW]
[ROW][C]Cosine[/C][C]0.703905688627652[/C][C]25.9791157987169[/C][/ROW]
[ROW][C]Optcosine[/C][C]0.704878409847517[/C][C]26.098878650513[/C][/ROW]
 [/TABLE]
Source: https://freestatistics.org/blog/index.php?pk=206347&T=6

Globally Unique Identifier (entire table): ba.freestatistics.org/blog/index.php?pk=206347&T=6

As an alternative you can also use a QR Code:  

The GUIDs for individual cells are displayed in the table below:

Maximum Density Values
Kernelx-valuemax. density
Gaussian0.70366250832268625.7175584266782
Epanechnikov0.70487840984751726.2440911205937
Rectangular0.70196024618792326.6783686644815
Triangular0.70001480374819427.4451185725052
Biweight0.70414886893261826.0006220886991
Cosine0.70390568862765225.9791157987169
Optcosine0.70487840984751726.098878650513


Maximum Density Values
Kernelx-valuemax. density
Gaussian0.70366250832268625.7175584266782
Epanechnikov0.70487840984751726.2440911205937
Rectangular0.70220342649288926.6783686644815
Triangular0.70001480374819427.4451185725052
Biweight0.70414886893261826.0006220886991
Cosine0.70390568862765225.9791157987169
Optcosine0.70487840984751726.098878650513

\begin{tabular}{lllllllll}
\hline
Maximum Density Values \tabularnewline
Kernel & x-value & max. density \tabularnewline
Gaussian & 0.703662508322686 & 25.7175584266782 \tabularnewline
Epanechnikov & 0.704878409847517 & 26.2440911205937 \tabularnewline
Rectangular & 0.702203426492889 & 26.6783686644815 \tabularnewline
Triangular & 0.700014803748194 & 27.4451185725052 \tabularnewline
Biweight & 0.704148868932618 & 26.0006220886991 \tabularnewline
Cosine & 0.703905688627652 & 25.9791157987169 \tabularnewline
Optcosine & 0.704878409847517 & 26.098878650513 \tabularnewline
 \hline
\end{tabular}
%Source: https://freestatistics.org/blog/index.php?pk=206347&T=7

[TABLE]
[ROW][C]Maximum Density Values[/C][/ROW]
[ROW][C]Kernel[/C][C]x-value[/C][C]max. density[/C][/ROW]
[ROW][C]Gaussian[/C][C]0.703662508322686[/C][C]25.7175584266782[/C][/ROW]
[ROW][C]Epanechnikov[/C][C]0.704878409847517[/C][C]26.2440911205937[/C][/ROW]
[ROW][C]Rectangular[/C][C]0.702203426492889[/C][C]26.6783686644815[/C][/ROW]
[ROW][C]Triangular[/C][C]0.700014803748194[/C][C]27.4451185725052[/C][/ROW]
[ROW][C]Biweight[/C][C]0.704148868932618[/C][C]26.0006220886991[/C][/ROW]
[ROW][C]Cosine[/C][C]0.703905688627652[/C][C]25.9791157987169[/C][/ROW]
[ROW][C]Optcosine[/C][C]0.704878409847517[/C][C]26.098878650513[/C][/ROW]
 [/TABLE]
Source: https://freestatistics.org/blog/index.php?pk=206347&T=7

Globally Unique Identifier (entire table): ba.freestatistics.org/blog/index.php?pk=206347&T=7

As an alternative you can also use a QR Code:  

The GUIDs for individual cells are displayed in the table below:

Maximum Density Values
Kernelx-valuemax. density
Gaussian0.70366250832268625.7175584266782
Epanechnikov0.70487840984751726.2440911205937
Rectangular0.70220342649288926.6783686644815
Triangular0.70001480374819427.4451185725052
Biweight0.70414886893261826.0006220886991
Cosine0.70390568862765225.9791157987169
Optcosine0.70487840984751726.098878650513


Maximum Density Values
Kernelx-valuemax. density
Gaussian0.70366250832268625.7175584266782
Epanechnikov0.70487840984751726.2440911205937
Rectangular0.70244660679785526.6783686644815
Triangular0.70001480374819427.4451185725052
Biweight0.70414886893261826.0006220886991
Cosine0.70390568862765225.9791157987169
Optcosine0.70487840984751726.098878650513

\begin{tabular}{lllllllll}
\hline
Maximum Density Values \tabularnewline
Kernel & x-value & max. density \tabularnewline
Gaussian & 0.703662508322686 & 25.7175584266782 \tabularnewline
Epanechnikov & 0.704878409847517 & 26.2440911205937 \tabularnewline
Rectangular & 0.702446606797855 & 26.6783686644815 \tabularnewline
Triangular & 0.700014803748194 & 27.4451185725052 \tabularnewline
Biweight & 0.704148868932618 & 26.0006220886991 \tabularnewline
Cosine & 0.703905688627652 & 25.9791157987169 \tabularnewline
Optcosine & 0.704878409847517 & 26.098878650513 \tabularnewline
 \hline
\end{tabular}
%Source: https://freestatistics.org/blog/index.php?pk=206347&T=8

[TABLE]
[ROW][C]Maximum Density Values[/C][/ROW]
[ROW][C]Kernel[/C][C]x-value[/C][C]max. density[/C][/ROW]
[ROW][C]Gaussian[/C][C]0.703662508322686[/C][C]25.7175584266782[/C][/ROW]
[ROW][C]Epanechnikov[/C][C]0.704878409847517[/C][C]26.2440911205937[/C][/ROW]
[ROW][C]Rectangular[/C][C]0.702446606797855[/C][C]26.6783686644815[/C][/ROW]
[ROW][C]Triangular[/C][C]0.700014803748194[/C][C]27.4451185725052[/C][/ROW]
[ROW][C]Biweight[/C][C]0.704148868932618[/C][C]26.0006220886991[/C][/ROW]
[ROW][C]Cosine[/C][C]0.703905688627652[/C][C]25.9791157987169[/C][/ROW]
[ROW][C]Optcosine[/C][C]0.704878409847517[/C][C]26.098878650513[/C][/ROW]
 [/TABLE]
Source: https://freestatistics.org/blog/index.php?pk=206347&T=8

Globally Unique Identifier (entire table): ba.freestatistics.org/blog/index.php?pk=206347&T=8

As an alternative you can also use a QR Code:  

The GUIDs for individual cells are displayed in the table below:

Maximum Density Values
Kernelx-valuemax. density
Gaussian0.70366250832268625.7175584266782
Epanechnikov0.70487840984751726.2440911205937
Rectangular0.70244660679785526.6783686644815
Triangular0.70001480374819427.4451185725052
Biweight0.70414886893261826.0006220886991
Cosine0.70390568862765225.9791157987169
Optcosine0.70487840984751726.098878650513


Maximum Density Values
Kernelx-valuemax. density
Gaussian0.70366250832268625.7175584266782
Epanechnikov0.70487840984751726.2440911205937
Rectangular0.70268978710282126.6783686644815
Triangular0.70001480374819427.4451185725052
Biweight0.70414886893261826.0006220886991
Cosine0.70390568862765225.9791157987169
Optcosine0.70487840984751726.098878650513

\begin{tabular}{lllllllll}
\hline
Maximum Density Values \tabularnewline
Kernel & x-value & max. density \tabularnewline
Gaussian & 0.703662508322686 & 25.7175584266782 \tabularnewline
Epanechnikov & 0.704878409847517 & 26.2440911205937 \tabularnewline
Rectangular & 0.702689787102821 & 26.6783686644815 \tabularnewline
Triangular & 0.700014803748194 & 27.4451185725052 \tabularnewline
Biweight & 0.704148868932618 & 26.0006220886991 \tabularnewline
Cosine & 0.703905688627652 & 25.9791157987169 \tabularnewline
Optcosine & 0.704878409847517 & 26.098878650513 \tabularnewline
 \hline
\end{tabular}
%Source: https://freestatistics.org/blog/index.php?pk=206347&T=9

[TABLE]
[ROW][C]Maximum Density Values[/C][/ROW]
[ROW][C]Kernel[/C][C]x-value[/C][C]max. density[/C][/ROW]
[ROW][C]Gaussian[/C][C]0.703662508322686[/C][C]25.7175584266782[/C][/ROW]
[ROW][C]Epanechnikov[/C][C]0.704878409847517[/C][C]26.2440911205937[/C][/ROW]
[ROW][C]Rectangular[/C][C]0.702689787102821[/C][C]26.6783686644815[/C][/ROW]
[ROW][C]Triangular[/C][C]0.700014803748194[/C][C]27.4451185725052[/C][/ROW]
[ROW][C]Biweight[/C][C]0.704148868932618[/C][C]26.0006220886991[/C][/ROW]
[ROW][C]Cosine[/C][C]0.703905688627652[/C][C]25.9791157987169[/C][/ROW]
[ROW][C]Optcosine[/C][C]0.704878409847517[/C][C]26.098878650513[/C][/ROW]
 [/TABLE]
Source: https://freestatistics.org/blog/index.php?pk=206347&T=9

Globally Unique Identifier (entire table): ba.freestatistics.org/blog/index.php?pk=206347&T=9

As an alternative you can also use a QR Code:  

The GUIDs for individual cells are displayed in the table below:

Maximum Density Values
Kernelx-valuemax. density
Gaussian0.70366250832268625.7175584266782
Epanechnikov0.70487840984751726.2440911205937
Rectangular0.70268978710282126.6783686644815
Triangular0.70001480374819427.4451185725052
Biweight0.70414886893261826.0006220886991
Cosine0.70390568862765225.9791157987169
Optcosine0.70487840984751726.098878650513


Maximum Density Values
Kernelx-valuemax. density
Gaussian0.70366250832268625.7175584266782
Epanechnikov0.70487840984751726.2440911205937
Rectangular0.70293296740778826.6783686644815
Triangular0.70001480374819427.4451185725052
Biweight0.70414886893261826.0006220886991
Cosine0.70390568862765225.9791157987169
Optcosine0.70487840984751726.098878650513

\begin{tabular}{lllllllll}
\hline
Maximum Density Values \tabularnewline
Kernel & x-value & max. density \tabularnewline
Gaussian & 0.703662508322686 & 25.7175584266782 \tabularnewline
Epanechnikov & 0.704878409847517 & 26.2440911205937 \tabularnewline
Rectangular & 0.702932967407788 & 26.6783686644815 \tabularnewline
Triangular & 0.700014803748194 & 27.4451185725052 \tabularnewline
Biweight & 0.704148868932618 & 26.0006220886991 \tabularnewline
Cosine & 0.703905688627652 & 25.9791157987169 \tabularnewline
Optcosine & 0.704878409847517 & 26.098878650513 \tabularnewline
 \hline
\end{tabular}
%Source: https://freestatistics.org/blog/index.php?pk=206347&T=10

[TABLE]
[ROW][C]Maximum Density Values[/C][/ROW]
[ROW][C]Kernel[/C][C]x-value[/C][C]max. density[/C][/ROW]
[ROW][C]Gaussian[/C][C]0.703662508322686[/C][C]25.7175584266782[/C][/ROW]
[ROW][C]Epanechnikov[/C][C]0.704878409847517[/C][C]26.2440911205937[/C][/ROW]
[ROW][C]Rectangular[/C][C]0.702932967407788[/C][C]26.6783686644815[/C][/ROW]
[ROW][C]Triangular[/C][C]0.700014803748194[/C][C]27.4451185725052[/C][/ROW]
[ROW][C]Biweight[/C][C]0.704148868932618[/C][C]26.0006220886991[/C][/ROW]
[ROW][C]Cosine[/C][C]0.703905688627652[/C][C]25.9791157987169[/C][/ROW]
[ROW][C]Optcosine[/C][C]0.704878409847517[/C][C]26.098878650513[/C][/ROW]
 [/TABLE]
Source: https://freestatistics.org/blog/index.php?pk=206347&T=10

Globally Unique Identifier (entire table): ba.freestatistics.org/blog/index.php?pk=206347&T=10

As an alternative you can also use a QR Code:  

The GUIDs for individual cells are displayed in the table below:

Maximum Density Values
Kernelx-valuemax. density
Gaussian0.70366250832268625.7175584266782
Epanechnikov0.70487840984751726.2440911205937
Rectangular0.70293296740778826.6783686644815
Triangular0.70001480374819427.4451185725052
Biweight0.70414886893261826.0006220886991
Cosine0.70390568862765225.9791157987169
Optcosine0.70487840984751726.098878650513


Maximum Density Values
Kernelx-valuemax. density
Gaussian0.70366250832268625.7175584266782
Epanechnikov0.70487840984751726.2440911205937
Rectangular0.7034193280177226.6783686644815
Triangular0.70001480374819427.4451185725052
Biweight0.70414886893261826.0006220886991
Cosine0.70390568862765225.9791157987169
Optcosine0.70487840984751726.098878650513

\begin{tabular}{lllllllll}
\hline
Maximum Density Values \tabularnewline
Kernel & x-value & max. density \tabularnewline
Gaussian & 0.703662508322686 & 25.7175584266782 \tabularnewline
Epanechnikov & 0.704878409847517 & 26.2440911205937 \tabularnewline
Rectangular & 0.70341932801772 & 26.6783686644815 \tabularnewline
Triangular & 0.700014803748194 & 27.4451185725052 \tabularnewline
Biweight & 0.704148868932618 & 26.0006220886991 \tabularnewline
Cosine & 0.703905688627652 & 25.9791157987169 \tabularnewline
Optcosine & 0.704878409847517 & 26.098878650513 \tabularnewline
 \hline
\end{tabular}
%Source: https://freestatistics.org/blog/index.php?pk=206347&T=11

[TABLE]
[ROW][C]Maximum Density Values[/C][/ROW]
[ROW][C]Kernel[/C][C]x-value[/C][C]max. density[/C][/ROW]
[ROW][C]Gaussian[/C][C]0.703662508322686[/C][C]25.7175584266782[/C][/ROW]
[ROW][C]Epanechnikov[/C][C]0.704878409847517[/C][C]26.2440911205937[/C][/ROW]
[ROW][C]Rectangular[/C][C]0.70341932801772[/C][C]26.6783686644815[/C][/ROW]
[ROW][C]Triangular[/C][C]0.700014803748194[/C][C]27.4451185725052[/C][/ROW]
[ROW][C]Biweight[/C][C]0.704148868932618[/C][C]26.0006220886991[/C][/ROW]
[ROW][C]Cosine[/C][C]0.703905688627652[/C][C]25.9791157987169[/C][/ROW]
[ROW][C]Optcosine[/C][C]0.704878409847517[/C][C]26.098878650513[/C][/ROW]
 [/TABLE]
Source: https://freestatistics.org/blog/index.php?pk=206347&T=11

Globally Unique Identifier (entire table): ba.freestatistics.org/blog/index.php?pk=206347&T=11

As an alternative you can also use a QR Code:  

The GUIDs for individual cells are displayed in the table below:

Maximum Density Values
Kernelx-valuemax. density
Gaussian0.70366250832268625.7175584266782
Epanechnikov0.70487840984751726.2440911205937
Rectangular0.7034193280177226.6783686644815
Triangular0.70001480374819427.4451185725052
Biweight0.70414886893261826.0006220886991
Cosine0.70390568862765225.9791157987169
Optcosine0.70487840984751726.098878650513


Maximum Density Values
Kernelx-valuemax. density
Gaussian0.70366250832268625.7175584266782
Epanechnikov0.70487840984751726.2440911205937
Rectangular0.70366250832268626.6783686644815
Triangular0.70001480374819427.4451185725052
Biweight0.70414886893261826.0006220886991
Cosine0.70390568862765225.9791157987169
Optcosine0.70487840984751726.098878650513

\begin{tabular}{lllllllll}
\hline
Maximum Density Values \tabularnewline
Kernel & x-value & max. density \tabularnewline
Gaussian & 0.703662508322686 & 25.7175584266782 \tabularnewline
Epanechnikov & 0.704878409847517 & 26.2440911205937 \tabularnewline
Rectangular & 0.703662508322686 & 26.6783686644815 \tabularnewline
Triangular & 0.700014803748194 & 27.4451185725052 \tabularnewline
Biweight & 0.704148868932618 & 26.0006220886991 \tabularnewline
Cosine & 0.703905688627652 & 25.9791157987169 \tabularnewline
Optcosine & 0.704878409847517 & 26.098878650513 \tabularnewline
 \hline
\end{tabular}
%Source: https://freestatistics.org/blog/index.php?pk=206347&T=12

[TABLE]
[ROW][C]Maximum Density Values[/C][/ROW]
[ROW][C]Kernel[/C][C]x-value[/C][C]max. density[/C][/ROW]
[ROW][C]Gaussian[/C][C]0.703662508322686[/C][C]25.7175584266782[/C][/ROW]
[ROW][C]Epanechnikov[/C][C]0.704878409847517[/C][C]26.2440911205937[/C][/ROW]
[ROW][C]Rectangular[/C][C]0.703662508322686[/C][C]26.6783686644815[/C][/ROW]
[ROW][C]Triangular[/C][C]0.700014803748194[/C][C]27.4451185725052[/C][/ROW]
[ROW][C]Biweight[/C][C]0.704148868932618[/C][C]26.0006220886991[/C][/ROW]
[ROW][C]Cosine[/C][C]0.703905688627652[/C][C]25.9791157987169[/C][/ROW]
[ROW][C]Optcosine[/C][C]0.704878409847517[/C][C]26.098878650513[/C][/ROW]
 [/TABLE]
Source: https://freestatistics.org/blog/index.php?pk=206347&T=12

Globally Unique Identifier (entire table): ba.freestatistics.org/blog/index.php?pk=206347&T=12

As an alternative you can also use a QR Code:  

The GUIDs for individual cells are displayed in the table below:

Maximum Density Values
Kernelx-valuemax. density
Gaussian0.70366250832268625.7175584266782
Epanechnikov0.70487840984751726.2440911205937
Rectangular0.70366250832268626.6783686644815
Triangular0.70001480374819427.4451185725052
Biweight0.70414886893261826.0006220886991
Cosine0.70390568862765225.9791157987169
Optcosine0.70487840984751726.098878650513


Maximum Density Values
Kernelx-valuemax. density
Gaussian0.70366250832268625.7175584266782
Epanechnikov0.70487840984751726.2440911205937
Rectangular0.70414886893261826.6783686644815
Triangular0.70001480374819427.4451185725052
Biweight0.70414886893261826.0006220886991
Cosine0.70390568862765225.9791157987169
Optcosine0.70487840984751726.098878650513

\begin{tabular}{lllllllll}
\hline
Maximum Density Values \tabularnewline
Kernel & x-value & max. density \tabularnewline
Gaussian & 0.703662508322686 & 25.7175584266782 \tabularnewline
Epanechnikov & 0.704878409847517 & 26.2440911205937 \tabularnewline
Rectangular & 0.704148868932618 & 26.6783686644815 \tabularnewline
Triangular & 0.700014803748194 & 27.4451185725052 \tabularnewline
Biweight & 0.704148868932618 & 26.0006220886991 \tabularnewline
Cosine & 0.703905688627652 & 25.9791157987169 \tabularnewline
Optcosine & 0.704878409847517 & 26.098878650513 \tabularnewline
 \hline
\end{tabular}
%Source: https://freestatistics.org/blog/index.php?pk=206347&T=13

[TABLE]
[ROW][C]Maximum Density Values[/C][/ROW]
[ROW][C]Kernel[/C][C]x-value[/C][C]max. density[/C][/ROW]
[ROW][C]Gaussian[/C][C]0.703662508322686[/C][C]25.7175584266782[/C][/ROW]
[ROW][C]Epanechnikov[/C][C]0.704878409847517[/C][C]26.2440911205937[/C][/ROW]
[ROW][C]Rectangular[/C][C]0.704148868932618[/C][C]26.6783686644815[/C][/ROW]
[ROW][C]Triangular[/C][C]0.700014803748194[/C][C]27.4451185725052[/C][/ROW]
[ROW][C]Biweight[/C][C]0.704148868932618[/C][C]26.0006220886991[/C][/ROW]
[ROW][C]Cosine[/C][C]0.703905688627652[/C][C]25.9791157987169[/C][/ROW]
[ROW][C]Optcosine[/C][C]0.704878409847517[/C][C]26.098878650513[/C][/ROW]
 [/TABLE]
Source: https://freestatistics.org/blog/index.php?pk=206347&T=13

Globally Unique Identifier (entire table): ba.freestatistics.org/blog/index.php?pk=206347&T=13

As an alternative you can also use a QR Code:  

The GUIDs for individual cells are displayed in the table below:

Maximum Density Values
Kernelx-valuemax. density
Gaussian0.70366250832268625.7175584266782
Epanechnikov0.70487840984751726.2440911205937
Rectangular0.70414886893261826.6783686644815
Triangular0.70001480374819427.4451185725052
Biweight0.70414886893261826.0006220886991
Cosine0.70390568862765225.9791157987169
Optcosine0.70487840984751726.098878650513


Maximum Density Values
Kernelx-valuemax. density
Gaussian0.70366250832268625.7175584266782
Epanechnikov0.70487840984751726.2440911205937
Rectangular0.70585113106738226.6783686644815
Triangular0.70001480374819427.4451185725052
Biweight0.70414886893261826.0006220886991
Cosine0.70390568862765225.9791157987169
Optcosine0.70487840984751726.098878650513

\begin{tabular}{lllllllll}
\hline
Maximum Density Values \tabularnewline
Kernel & x-value & max. density \tabularnewline
Gaussian & 0.703662508322686 & 25.7175584266782 \tabularnewline
Epanechnikov & 0.704878409847517 & 26.2440911205937 \tabularnewline
Rectangular & 0.705851131067382 & 26.6783686644815 \tabularnewline
Triangular & 0.700014803748194 & 27.4451185725052 \tabularnewline
Biweight & 0.704148868932618 & 26.0006220886991 \tabularnewline
Cosine & 0.703905688627652 & 25.9791157987169 \tabularnewline
Optcosine & 0.704878409847517 & 26.098878650513 \tabularnewline
 \hline
\end{tabular}
%Source: https://freestatistics.org/blog/index.php?pk=206347&T=14

[TABLE]
[ROW][C]Maximum Density Values[/C][/ROW]
[ROW][C]Kernel[/C][C]x-value[/C][C]max. density[/C][/ROW]
[ROW][C]Gaussian[/C][C]0.703662508322686[/C][C]25.7175584266782[/C][/ROW]
[ROW][C]Epanechnikov[/C][C]0.704878409847517[/C][C]26.2440911205937[/C][/ROW]
[ROW][C]Rectangular[/C][C]0.705851131067382[/C][C]26.6783686644815[/C][/ROW]
[ROW][C]Triangular[/C][C]0.700014803748194[/C][C]27.4451185725052[/C][/ROW]
[ROW][C]Biweight[/C][C]0.704148868932618[/C][C]26.0006220886991[/C][/ROW]
[ROW][C]Cosine[/C][C]0.703905688627652[/C][C]25.9791157987169[/C][/ROW]
[ROW][C]Optcosine[/C][C]0.704878409847517[/C][C]26.098878650513[/C][/ROW]
 [/TABLE]
Source: https://freestatistics.org/blog/index.php?pk=206347&T=14

Globally Unique Identifier (entire table): ba.freestatistics.org/blog/index.php?pk=206347&T=14

As an alternative you can also use a QR Code:  

The GUIDs for individual cells are displayed in the table below:

Maximum Density Values
Kernelx-valuemax. density
Gaussian0.70366250832268625.7175584266782
Epanechnikov0.70487840984751726.2440911205937
Rectangular0.70585113106738226.6783686644815
Triangular0.70001480374819427.4451185725052
Biweight0.70414886893261826.0006220886991
Cosine0.70390568862765225.9791157987169
Optcosine0.70487840984751726.098878650513


Maximum Density Values
Kernelx-valuemax. density
Gaussian0.70366250832268625.7175584266782
Epanechnikov0.70487840984751726.2440911205937
Rectangular0.70609431137234826.6783686644815
Triangular0.70001480374819427.4451185725052
Biweight0.70414886893261826.0006220886991
Cosine0.70390568862765225.9791157987169
Optcosine0.70487840984751726.098878650513

\begin{tabular}{lllllllll}
\hline
Maximum Density Values \tabularnewline
Kernel & x-value & max. density \tabularnewline
Gaussian & 0.703662508322686 & 25.7175584266782 \tabularnewline
Epanechnikov & 0.704878409847517 & 26.2440911205937 \tabularnewline
Rectangular & 0.706094311372348 & 26.6783686644815 \tabularnewline
Triangular & 0.700014803748194 & 27.4451185725052 \tabularnewline
Biweight & 0.704148868932618 & 26.0006220886991 \tabularnewline
Cosine & 0.703905688627652 & 25.9791157987169 \tabularnewline
Optcosine & 0.704878409847517 & 26.098878650513 \tabularnewline
 \hline
\end{tabular}
%Source: https://freestatistics.org/blog/index.php?pk=206347&T=15

[TABLE]
[ROW][C]Maximum Density Values[/C][/ROW]
[ROW][C]Kernel[/C][C]x-value[/C][C]max. density[/C][/ROW]
[ROW][C]Gaussian[/C][C]0.703662508322686[/C][C]25.7175584266782[/C][/ROW]
[ROW][C]Epanechnikov[/C][C]0.704878409847517[/C][C]26.2440911205937[/C][/ROW]
[ROW][C]Rectangular[/C][C]0.706094311372348[/C][C]26.6783686644815[/C][/ROW]
[ROW][C]Triangular[/C][C]0.700014803748194[/C][C]27.4451185725052[/C][/ROW]
[ROW][C]Biweight[/C][C]0.704148868932618[/C][C]26.0006220886991[/C][/ROW]
[ROW][C]Cosine[/C][C]0.703905688627652[/C][C]25.9791157987169[/C][/ROW]
[ROW][C]Optcosine[/C][C]0.704878409847517[/C][C]26.098878650513[/C][/ROW]
 [/TABLE]
Source: https://freestatistics.org/blog/index.php?pk=206347&T=15

Globally Unique Identifier (entire table): ba.freestatistics.org/blog/index.php?pk=206347&T=15

As an alternative you can also use a QR Code:  

The GUIDs for individual cells are displayed in the table below:

Maximum Density Values
Kernelx-valuemax. density
Gaussian0.70366250832268625.7175584266782
Epanechnikov0.70487840984751726.2440911205937
Rectangular0.70609431137234826.6783686644815
Triangular0.70001480374819427.4451185725052
Biweight0.70414886893261826.0006220886991
Cosine0.70390568862765225.9791157987169
Optcosine0.70487840984751726.098878650513


Maximum Density Values
Kernelx-valuemax. density
Gaussian0.70366250832268625.7175584266782
Epanechnikov0.70487840984751726.2440911205937
Rectangular0.70633749167731426.6783686644815
Triangular0.70001480374819427.4451185725052
Biweight0.70414886893261826.0006220886991
Cosine0.70390568862765225.9791157987169
Optcosine0.70487840984751726.098878650513

\begin{tabular}{lllllllll}
\hline
Maximum Density Values \tabularnewline
Kernel & x-value & max. density \tabularnewline
Gaussian & 0.703662508322686 & 25.7175584266782 \tabularnewline
Epanechnikov & 0.704878409847517 & 26.2440911205937 \tabularnewline
Rectangular & 0.706337491677314 & 26.6783686644815 \tabularnewline
Triangular & 0.700014803748194 & 27.4451185725052 \tabularnewline
Biweight & 0.704148868932618 & 26.0006220886991 \tabularnewline
Cosine & 0.703905688627652 & 25.9791157987169 \tabularnewline
Optcosine & 0.704878409847517 & 26.098878650513 \tabularnewline
 \hline
\end{tabular}
%Source: https://freestatistics.org/blog/index.php?pk=206347&T=16

[TABLE]
[ROW][C]Maximum Density Values[/C][/ROW]
[ROW][C]Kernel[/C][C]x-value[/C][C]max. density[/C][/ROW]
[ROW][C]Gaussian[/C][C]0.703662508322686[/C][C]25.7175584266782[/C][/ROW]
[ROW][C]Epanechnikov[/C][C]0.704878409847517[/C][C]26.2440911205937[/C][/ROW]
[ROW][C]Rectangular[/C][C]0.706337491677314[/C][C]26.6783686644815[/C][/ROW]
[ROW][C]Triangular[/C][C]0.700014803748194[/C][C]27.4451185725052[/C][/ROW]
[ROW][C]Biweight[/C][C]0.704148868932618[/C][C]26.0006220886991[/C][/ROW]
[ROW][C]Cosine[/C][C]0.703905688627652[/C][C]25.9791157987169[/C][/ROW]
[ROW][C]Optcosine[/C][C]0.704878409847517[/C][C]26.098878650513[/C][/ROW]
 [/TABLE]
Source: https://freestatistics.org/blog/index.php?pk=206347&T=16

Globally Unique Identifier (entire table): ba.freestatistics.org/blog/index.php?pk=206347&T=16

As an alternative you can also use a QR Code:  

The GUIDs for individual cells are displayed in the table below:

Maximum Density Values
Kernelx-valuemax. density
Gaussian0.70366250832268625.7175584266782
Epanechnikov0.70487840984751726.2440911205937
Rectangular0.70633749167731426.6783686644815
Triangular0.70001480374819427.4451185725052
Biweight0.70414886893261826.0006220886991
Cosine0.70390568862765225.9791157987169
Optcosine0.70487840984751726.098878650513


Maximum Density Values
Kernelx-valuemax. density
Gaussian0.70366250832268625.7175584266782
Epanechnikov0.70487840984751726.2440911205937
Rectangular0.7065806719822826.6783686644815
Triangular0.70001480374819427.4451185725052
Biweight0.70414886893261826.0006220886991
Cosine0.70390568862765225.9791157987169
Optcosine0.70487840984751726.098878650513

\begin{tabular}{lllllllll}
\hline
Maximum Density Values \tabularnewline
Kernel & x-value & max. density \tabularnewline
Gaussian & 0.703662508322686 & 25.7175584266782 \tabularnewline
Epanechnikov & 0.704878409847517 & 26.2440911205937 \tabularnewline
Rectangular & 0.70658067198228 & 26.6783686644815 \tabularnewline
Triangular & 0.700014803748194 & 27.4451185725052 \tabularnewline
Biweight & 0.704148868932618 & 26.0006220886991 \tabularnewline
Cosine & 0.703905688627652 & 25.9791157987169 \tabularnewline
Optcosine & 0.704878409847517 & 26.098878650513 \tabularnewline
 \hline
\end{tabular}
%Source: https://freestatistics.org/blog/index.php?pk=206347&T=17

[TABLE]
[ROW][C]Maximum Density Values[/C][/ROW]
[ROW][C]Kernel[/C][C]x-value[/C][C]max. density[/C][/ROW]
[ROW][C]Gaussian[/C][C]0.703662508322686[/C][C]25.7175584266782[/C][/ROW]
[ROW][C]Epanechnikov[/C][C]0.704878409847517[/C][C]26.2440911205937[/C][/ROW]
[ROW][C]Rectangular[/C][C]0.70658067198228[/C][C]26.6783686644815[/C][/ROW]
[ROW][C]Triangular[/C][C]0.700014803748194[/C][C]27.4451185725052[/C][/ROW]
[ROW][C]Biweight[/C][C]0.704148868932618[/C][C]26.0006220886991[/C][/ROW]
[ROW][C]Cosine[/C][C]0.703905688627652[/C][C]25.9791157987169[/C][/ROW]
[ROW][C]Optcosine[/C][C]0.704878409847517[/C][C]26.098878650513[/C][/ROW]
 [/TABLE]
Source: https://freestatistics.org/blog/index.php?pk=206347&T=17

Globally Unique Identifier (entire table): ba.freestatistics.org/blog/index.php?pk=206347&T=17

As an alternative you can also use a QR Code:  

The GUIDs for individual cells are displayed in the table below:

Maximum Density Values
Kernelx-valuemax. density
Gaussian0.70366250832268625.7175584266782
Epanechnikov0.70487840984751726.2440911205937
Rectangular0.7065806719822826.6783686644815
Triangular0.70001480374819427.4451185725052
Biweight0.70414886893261826.0006220886991
Cosine0.70390568862765225.9791157987169
Optcosine0.70487840984751726.098878650513


Maximum Density Values
Kernelx-valuemax. density
Gaussian0.70366250832268625.7175584266782
Epanechnikov0.70487840984751726.2440911205937
Rectangular0.70682385228724626.6783686644815
Triangular0.70001480374819427.4451185725052
Biweight0.70414886893261826.0006220886991
Cosine0.70390568862765225.9791157987169
Optcosine0.70487840984751726.098878650513

\begin{tabular}{lllllllll}
\hline
Maximum Density Values \tabularnewline
Kernel & x-value & max. density \tabularnewline
Gaussian & 0.703662508322686 & 25.7175584266782 \tabularnewline
Epanechnikov & 0.704878409847517 & 26.2440911205937 \tabularnewline
Rectangular & 0.706823852287246 & 26.6783686644815 \tabularnewline
Triangular & 0.700014803748194 & 27.4451185725052 \tabularnewline
Biweight & 0.704148868932618 & 26.0006220886991 \tabularnewline
Cosine & 0.703905688627652 & 25.9791157987169 \tabularnewline
Optcosine & 0.704878409847517 & 26.098878650513 \tabularnewline
 \hline
\end{tabular}
%Source: https://freestatistics.org/blog/index.php?pk=206347&T=18

[TABLE]
[ROW][C]Maximum Density Values[/C][/ROW]
[ROW][C]Kernel[/C][C]x-value[/C][C]max. density[/C][/ROW]
[ROW][C]Gaussian[/C][C]0.703662508322686[/C][C]25.7175584266782[/C][/ROW]
[ROW][C]Epanechnikov[/C][C]0.704878409847517[/C][C]26.2440911205937[/C][/ROW]
[ROW][C]Rectangular[/C][C]0.706823852287246[/C][C]26.6783686644815[/C][/ROW]
[ROW][C]Triangular[/C][C]0.700014803748194[/C][C]27.4451185725052[/C][/ROW]
[ROW][C]Biweight[/C][C]0.704148868932618[/C][C]26.0006220886991[/C][/ROW]
[ROW][C]Cosine[/C][C]0.703905688627652[/C][C]25.9791157987169[/C][/ROW]
[ROW][C]Optcosine[/C][C]0.704878409847517[/C][C]26.098878650513[/C][/ROW]
 [/TABLE]
Source: https://freestatistics.org/blog/index.php?pk=206347&T=18

Globally Unique Identifier (entire table): ba.freestatistics.org/blog/index.php?pk=206347&T=18

As an alternative you can also use a QR Code:  

The GUIDs for individual cells are displayed in the table below:

Maximum Density Values
Kernelx-valuemax. density
Gaussian0.70366250832268625.7175584266782
Epanechnikov0.70487840984751726.2440911205937
Rectangular0.70682385228724626.6783686644815
Triangular0.70001480374819427.4451185725052
Biweight0.70414886893261826.0006220886991
Cosine0.70390568862765225.9791157987169
Optcosine0.70487840984751726.098878650513


Maximum Density Values
Kernelx-valuemax. density
Gaussian0.70366250832268625.7175584266782
Epanechnikov0.70487840984751726.2440911205937
Rectangular0.70706703259221226.6783686644815
Triangular0.70001480374819427.4451185725052
Biweight0.70414886893261826.0006220886991
Cosine0.70390568862765225.9791157987169
Optcosine0.70487840984751726.098878650513

\begin{tabular}{lllllllll}
\hline
Maximum Density Values \tabularnewline
Kernel & x-value & max. density \tabularnewline
Gaussian & 0.703662508322686 & 25.7175584266782 \tabularnewline
Epanechnikov & 0.704878409847517 & 26.2440911205937 \tabularnewline
Rectangular & 0.707067032592212 & 26.6783686644815 \tabularnewline
Triangular & 0.700014803748194 & 27.4451185725052 \tabularnewline
Biweight & 0.704148868932618 & 26.0006220886991 \tabularnewline
Cosine & 0.703905688627652 & 25.9791157987169 \tabularnewline
Optcosine & 0.704878409847517 & 26.098878650513 \tabularnewline
 \hline
\end{tabular}
%Source: https://freestatistics.org/blog/index.php?pk=206347&T=19

[TABLE]
[ROW][C]Maximum Density Values[/C][/ROW]
[ROW][C]Kernel[/C][C]x-value[/C][C]max. density[/C][/ROW]
[ROW][C]Gaussian[/C][C]0.703662508322686[/C][C]25.7175584266782[/C][/ROW]
[ROW][C]Epanechnikov[/C][C]0.704878409847517[/C][C]26.2440911205937[/C][/ROW]
[ROW][C]Rectangular[/C][C]0.707067032592212[/C][C]26.6783686644815[/C][/ROW]
[ROW][C]Triangular[/C][C]0.700014803748194[/C][C]27.4451185725052[/C][/ROW]
[ROW][C]Biweight[/C][C]0.704148868932618[/C][C]26.0006220886991[/C][/ROW]
[ROW][C]Cosine[/C][C]0.703905688627652[/C][C]25.9791157987169[/C][/ROW]
[ROW][C]Optcosine[/C][C]0.704878409847517[/C][C]26.098878650513[/C][/ROW]
 [/TABLE]
Source: https://freestatistics.org/blog/index.php?pk=206347&T=19

Globally Unique Identifier (entire table): ba.freestatistics.org/blog/index.php?pk=206347&T=19

As an alternative you can also use a QR Code:  

The GUIDs for individual cells are displayed in the table below:

Maximum Density Values
Kernelx-valuemax. density
Gaussian0.70366250832268625.7175584266782
Epanechnikov0.70487840984751726.2440911205937
Rectangular0.70706703259221226.6783686644815
Triangular0.70001480374819427.4451185725052
Biweight0.70414886893261826.0006220886991
Cosine0.70390568862765225.9791157987169
Optcosine0.70487840984751726.098878650513


Maximum Density Values
Kernelx-valuemax. density
Gaussian0.70366250832268625.7175584266782
Epanechnikov0.70487840984751726.2440911205937
Rectangular0.70731021289717926.6783686644815
Triangular0.70001480374819427.4451185725052
Biweight0.70414886893261826.0006220886991
Cosine0.70390568862765225.9791157987169
Optcosine0.70487840984751726.098878650513

\begin{tabular}{lllllllll}
\hline
Maximum Density Values \tabularnewline
Kernel & x-value & max. density \tabularnewline
Gaussian & 0.703662508322686 & 25.7175584266782 \tabularnewline
Epanechnikov & 0.704878409847517 & 26.2440911205937 \tabularnewline
Rectangular & 0.707310212897179 & 26.6783686644815 \tabularnewline
Triangular & 0.700014803748194 & 27.4451185725052 \tabularnewline
Biweight & 0.704148868932618 & 26.0006220886991 \tabularnewline
Cosine & 0.703905688627652 & 25.9791157987169 \tabularnewline
Optcosine & 0.704878409847517 & 26.098878650513 \tabularnewline
 \hline
\end{tabular}
%Source: https://freestatistics.org/blog/index.php?pk=206347&T=20

[TABLE]
[ROW][C]Maximum Density Values[/C][/ROW]
[ROW][C]Kernel[/C][C]x-value[/C][C]max. density[/C][/ROW]
[ROW][C]Gaussian[/C][C]0.703662508322686[/C][C]25.7175584266782[/C][/ROW]
[ROW][C]Epanechnikov[/C][C]0.704878409847517[/C][C]26.2440911205937[/C][/ROW]
[ROW][C]Rectangular[/C][C]0.707310212897179[/C][C]26.6783686644815[/C][/ROW]
[ROW][C]Triangular[/C][C]0.700014803748194[/C][C]27.4451185725052[/C][/ROW]
[ROW][C]Biweight[/C][C]0.704148868932618[/C][C]26.0006220886991[/C][/ROW]
[ROW][C]Cosine[/C][C]0.703905688627652[/C][C]25.9791157987169[/C][/ROW]
[ROW][C]Optcosine[/C][C]0.704878409847517[/C][C]26.098878650513[/C][/ROW]
 [/TABLE]
Source: https://freestatistics.org/blog/index.php?pk=206347&T=20

Globally Unique Identifier (entire table): ba.freestatistics.org/blog/index.php?pk=206347&T=20

As an alternative you can also use a QR Code:  

The GUIDs for individual cells are displayed in the table below:

Maximum Density Values
Kernelx-valuemax. density
Gaussian0.70366250832268625.7175584266782
Epanechnikov0.70487840984751726.2440911205937
Rectangular0.70731021289717926.6783686644815
Triangular0.70001480374819427.4451185725052
Biweight0.70414886893261826.0006220886991
Cosine0.70390568862765225.9791157987169
Optcosine0.70487840984751726.098878650513


Maximum Density Values
Kernelx-valuemax. density
Gaussian0.70366250832268625.7175584266782
Epanechnikov0.70487840984751726.2440911205937
Rectangular0.70803975381207726.6783686644815
Triangular0.70001480374819427.4451185725052
Biweight0.70414886893261826.0006220886991
Cosine0.70390568862765225.9791157987169
Optcosine0.70487840984751726.098878650513

\begin{tabular}{lllllllll}
\hline
Maximum Density Values \tabularnewline
Kernel & x-value & max. density \tabularnewline
Gaussian & 0.703662508322686 & 25.7175584266782 \tabularnewline
Epanechnikov & 0.704878409847517 & 26.2440911205937 \tabularnewline
Rectangular & 0.708039753812077 & 26.6783686644815 \tabularnewline
Triangular & 0.700014803748194 & 27.4451185725052 \tabularnewline
Biweight & 0.704148868932618 & 26.0006220886991 \tabularnewline
Cosine & 0.703905688627652 & 25.9791157987169 \tabularnewline
Optcosine & 0.704878409847517 & 26.098878650513 \tabularnewline
 \hline
\end{tabular}
%Source: https://freestatistics.org/blog/index.php?pk=206347&T=21

[TABLE]
[ROW][C]Maximum Density Values[/C][/ROW]
[ROW][C]Kernel[/C][C]x-value[/C][C]max. density[/C][/ROW]
[ROW][C]Gaussian[/C][C]0.703662508322686[/C][C]25.7175584266782[/C][/ROW]
[ROW][C]Epanechnikov[/C][C]0.704878409847517[/C][C]26.2440911205937[/C][/ROW]
[ROW][C]Rectangular[/C][C]0.708039753812077[/C][C]26.6783686644815[/C][/ROW]
[ROW][C]Triangular[/C][C]0.700014803748194[/C][C]27.4451185725052[/C][/ROW]
[ROW][C]Biweight[/C][C]0.704148868932618[/C][C]26.0006220886991[/C][/ROW]
[ROW][C]Cosine[/C][C]0.703905688627652[/C][C]25.9791157987169[/C][/ROW]
[ROW][C]Optcosine[/C][C]0.704878409847517[/C][C]26.098878650513[/C][/ROW]
 [/TABLE]
Source: https://freestatistics.org/blog/index.php?pk=206347&T=21

Globally Unique Identifier (entire table): ba.freestatistics.org/blog/index.php?pk=206347&T=21

As an alternative you can also use a QR Code:  

The GUIDs for individual cells are displayed in the table below:

Maximum Density Values
Kernelx-valuemax. density
Gaussian0.70366250832268625.7175584266782
Epanechnikov0.70487840984751726.2440911205937
Rectangular0.70803975381207726.6783686644815
Triangular0.70001480374819427.4451185725052
Biweight0.70414886893261826.0006220886991
Cosine0.70390568862765225.9791157987169
Optcosine0.70487840984751726.098878650513


Maximum Density Values
Kernelx-valuemax. density
Gaussian0.70366250832268625.7175584266782
Epanechnikov0.70487840984751726.2440911205937
Rectangular0.70828293411704326.6783686644815
Triangular0.70001480374819427.4451185725052
Biweight0.70414886893261826.0006220886991
Cosine0.70390568862765225.9791157987169
Optcosine0.70487840984751726.098878650513

\begin{tabular}{lllllllll}
\hline
Maximum Density Values \tabularnewline
Kernel & x-value & max. density \tabularnewline
Gaussian & 0.703662508322686 & 25.7175584266782 \tabularnewline
Epanechnikov & 0.704878409847517 & 26.2440911205937 \tabularnewline
Rectangular & 0.708282934117043 & 26.6783686644815 \tabularnewline
Triangular & 0.700014803748194 & 27.4451185725052 \tabularnewline
Biweight & 0.704148868932618 & 26.0006220886991 \tabularnewline
Cosine & 0.703905688627652 & 25.9791157987169 \tabularnewline
Optcosine & 0.704878409847517 & 26.098878650513 \tabularnewline
\hline
\end{tabular}
%Source: https://freestatistics.org/blog/index.php?pk=206347&T=22

[TABLE]
[ROW][C]Maximum Density Values[/C][/ROW]
[ROW][C]Kernel[/C][C]x-value[/C][C]max. density[/C][/ROW]
[ROW][C]Gaussian[/C][C]0.703662508322686[/C][C]25.7175584266782[/C][/ROW]
[ROW][C]Epanechnikov[/C][C]0.704878409847517[/C][C]26.2440911205937[/C][/ROW]
[ROW][C]Rectangular[/C][C]0.708282934117043[/C][C]26.6783686644815[/C][/ROW]
[ROW][C]Triangular[/C][C]0.700014803748194[/C][C]27.4451185725052[/C][/ROW]
[ROW][C]Biweight[/C][C]0.704148868932618[/C][C]26.0006220886991[/C][/ROW]
[ROW][C]Cosine[/C][C]0.703905688627652[/C][C]25.9791157987169[/C][/ROW]
[ROW][C]Optcosine[/C][C]0.704878409847517[/C][C]26.098878650513[/C][/ROW]
[/TABLE]
Source: https://freestatistics.org/blog/index.php?pk=206347&T=22

Globally Unique Identifier (entire table): ba.freestatistics.org/blog/index.php?pk=206347&T=22

As an alternative you can also use a QR Code:  

The GUIDs for individual cells are displayed in the table below:

Maximum Density Values
Kernelx-valuemax. density
Gaussian0.70366250832268625.7175584266782
Epanechnikov0.70487840984751726.2440911205937
Rectangular0.70828293411704326.6783686644815
Triangular0.70001480374819427.4451185725052
Biweight0.70414886893261826.0006220886991
Cosine0.70390568862765225.9791157987169
Optcosine0.70487840984751726.098878650513


Parameters (Session):
par2 = grey ; par3 = FALSE ; par4 = Unknown ;
Parameters (R input):
par1 = 0 ; par2 = no ; par3 = 512 ;
R code (references can be found in the software module):
if (par1 == '0') bw <- 'nrd0'
if (par1 != '0') bw <- as.numeric(par1)
par3 <- as.numeric(par3)
mydensity <- array(NA, dim=c(par3,8))
bitmap(file='density1.png')
mydensity1<-density(x,bw=bw,kernel='gaussian',na.rm=TRUE)
mydensity[,8] = signif(mydensity1$x,3)
mydensity[,1] = signif(mydensity1$y,3)
plot(mydensity1,main='Gaussian Kernel',xlab=xlab,ylab=ylab)
grid()
dev.off()
mydensity1
bitmap(file='density2.png')
mydensity2<-density(x,bw=bw,kernel='epanechnikov',na.rm=TRUE)
mydensity[,2] = signif(mydensity2$y,3)
plot(mydensity2,main='Epanechnikov Kernel',xlab=xlab,ylab=ylab)
grid()
dev.off()
bitmap(file='density3.png')
mydensity3<-density(x,bw=bw,kernel='rectangular',na.rm=TRUE)
mydensity[,3] = signif(mydensity3$y,3)
plot(mydensity3,main='Rectangular Kernel',xlab=xlab,ylab=ylab)
grid()
dev.off()
bitmap(file='density4.png')
mydensity4<-density(x,bw=bw,kernel='triangular',na.rm=TRUE)
mydensity[,4] = signif(mydensity4$y,3)
plot(mydensity4,main='Triangular Kernel',xlab=xlab,ylab=ylab)
grid()
dev.off()
bitmap(file='density5.png')
mydensity5<-density(x,bw=bw,kernel='biweight',na.rm=TRUE)
mydensity[,5] = signif(mydensity5$y,3)
plot(mydensity5,main='Biweight Kernel',xlab=xlab,ylab=ylab)
grid()
dev.off()
bitmap(file='density6.png')
mydensity6<-density(x,bw=bw,kernel='cosine',na.rm=TRUE)
mydensity[,6] = signif(mydensity6$y,3)
plot(mydensity6,main='Cosine Kernel',xlab=xlab,ylab=ylab)
grid()
dev.off()
bitmap(file='density7.png')
mydensity7<-density(x,bw=bw,kernel='optcosine',na.rm=TRUE)
mydensity[,7] = signif(mydensity7$y,3)
plot(mydensity7,main='Optcosine Kernel',xlab=xlab,ylab=ylab)
grid()
dev.off()
load(file='createtable')
a<-table.start()
a<-table.row.start(a)
a<-table.element(a,'Properties of Density Trace',2,TRUE)
a<-table.row.end(a)
a<-table.row.start(a)
a<-table.element(a,'Bandwidth',header=TRUE)
a<-table.element(a,mydensity1$bw)
a<-table.row.end(a)
a<-table.row.start(a)
a<-table.element(a,'#Observations',header=TRUE)
a<-table.element(a,mydensity1$n)
a<-table.row.end(a)
a<-table.end(a)
table.save(a,file='mytable.tab')
a<-table.start()
a<-table.row.start(a)
a<-table.element(a,'Maximum Density Values',3,TRUE)
a<-table.row.end(a)
a<-table.row.start(a)
a<-table.element(a,'Kernel',1,TRUE)
a<-table.element(a,'x-value',1,TRUE)
a<-table.element(a,'max. density',1,TRUE)
a<-table.row.end(a)
a<-table.row.start(a)
a<-table.element(a,'Gaussian',1,TRUE)
a<-table.element(a,mydensity1$x[mydensity1$y==max(mydensity1$y)],1)
a<-table.element(a,mydensity1$y[mydensity1$y==max(mydensity1$y)],1)
a<-table.row.end(a)
a<-table.row.start(a)
a<-table.element(a,'Epanechnikov',1,TRUE)
a<-table.element(a,mydensity2$x[mydensity2$y==max(mydensity2$y)],1)
a<-table.element(a,mydensity2$y[mydensity2$y==max(mydensity2$y)],1)
a<-table.row.end(a)
a<-table.row.start(a)
a<-table.element(a,'Rectangular',1,TRUE)
a<-table.element(a,mydensity3$x[mydensity3$y==max(mydensity3$y)],1)
a<-table.element(a,mydensity3$y[mydensity3$y==max(mydensity3$y)],1)
a<-table.row.end(a)
a<-table.row.start(a)
a<-table.element(a,'Triangular',1,TRUE)
a<-table.element(a,mydensity4$x[mydensity4$y==max(mydensity4$y)],1)
a<-table.element(a,mydensity4$y[mydensity4$y==max(mydensity4$y)],1)
a<-table.row.end(a)
a<-table.row.start(a)
a<-table.element(a,'Biweight',1,TRUE)
a<-table.element(a,mydensity5$x[mydensity5$y==max(mydensity5$y)],1)
a<-table.element(a,mydensity5$y[mydensity5$y==max(mydensity5$y)],1)
a<-table.row.end(a)
a<-table.row.start(a)
a<-table.element(a,'Cosine',1,TRUE)
a<-table.element(a,mydensity6$x[mydensity6$y==max(mydensity6$y)],1)
a<-table.element(a,mydensity6$y[mydensity6$y==max(mydensity6$y)],1)
a<-table.row.end(a)
a<-table.row.start(a)
a<-table.element(a,'Optcosine',1,TRUE)
a<-table.element(a,mydensity7$x[mydensity7$y==max(mydensity7$y)],1)
a<-table.element(a,mydensity7$y[mydensity7$y==max(mydensity7$y)],1)
a<-table.row.end(a)
a<-table.end(a)
table.save(a,file='mytable2.tab')
if (par2=='yes') {
a<-table.start()
a<-table.row.start(a)
a<-table.element(a,'Kernel Density Values',8,TRUE)
a<-table.row.end(a)
a<-table.row.start(a)
a<-table.element(a,'x-value',1,TRUE)
a<-table.element(a,'Gaussian',1,TRUE)
a<-table.element(a,'Epanechnikov',1,TRUE)
a<-table.element(a,'Rectangular',1,TRUE)
a<-table.element(a,'Triangular',1,TRUE)
a<-table.element(a,'Biweight',1,TRUE)
a<-table.element(a,'Cosine',1,TRUE)
a<-table.element(a,'Optcosine',1,TRUE)
a<-table.row.end(a)
for(i in 1:par3) {
a<-table.row.start(a)
a<-table.element(a,mydensity[i,8],1,TRUE)
for(j in 1:7) {
a<-table.element(a,mydensity[i,j],1)
}
a<-table.row.end(a)
}
a<-table.end(a)
table.save(a,file='mytable1.tab')
}