Free Statistics
of Irreproducible Research!
Description of Statistical Computation | |||||||||||||||||||||||||||||||||||||||||
|---|---|---|---|---|---|---|---|---|---|---|---|---|---|---|---|---|---|---|---|---|---|---|---|---|---|---|---|---|---|---|---|---|---|---|---|---|---|---|---|---|---|
| Author's title | |||||||||||||||||||||||||||||||||||||||||
| Author | *Unverified author* | ||||||||||||||||||||||||||||||||||||||||
| R Software Module | rwasp_univariatedataseries.wasp | ||||||||||||||||||||||||||||||||||||||||
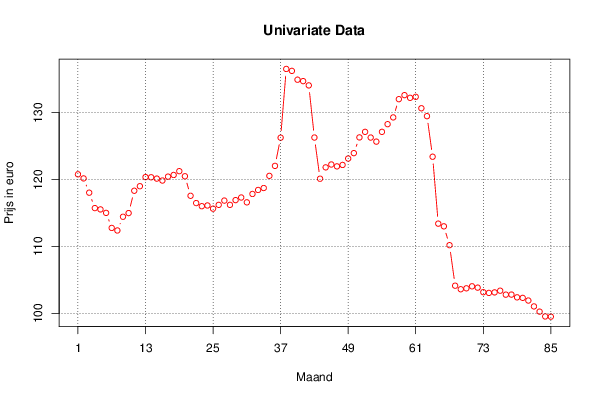
| Title produced by software | Univariate Data Series | ||||||||||||||||||||||||||||||||||||||||
| Date of computation | Thu, 07 Feb 2013 04:48:55 -0500 | ||||||||||||||||||||||||||||||||||||||||
| Cite this page as follows | Statistical Computations at FreeStatistics.org, Office for Research Development and Education, URL https://freestatistics.org/blog/index.php?v=date/2013/Feb/07/t1360230635ujwz4p0n6sirngn.htm/, Retrieved Tue, 30 Apr 2024 12:21:38 +0000 | ||||||||||||||||||||||||||||||||||||||||
| Statistical Computations at FreeStatistics.org, Office for Research Development and Education, URL https://freestatistics.org/blog/index.php?pk=206093, Retrieved Tue, 30 Apr 2024 12:21:38 +0000 | |||||||||||||||||||||||||||||||||||||||||
| QR Codes: | |||||||||||||||||||||||||||||||||||||||||
|
| |||||||||||||||||||||||||||||||||||||||||
| Original text written by user: | |||||||||||||||||||||||||||||||||||||||||
| IsPrivate? | No (this computation is public) | ||||||||||||||||||||||||||||||||||||||||
| User-defined keywords | |||||||||||||||||||||||||||||||||||||||||
| Estimated Impact | 122 | ||||||||||||||||||||||||||||||||||||||||
Tree of Dependent Computations | |||||||||||||||||||||||||||||||||||||||||
| Family? (F = Feedback message, R = changed R code, M = changed R Module, P = changed Parameters, D = changed Data) | |||||||||||||||||||||||||||||||||||||||||
| - [Univariate Data Series] [Gemiddelde consum...] [2013-02-07 09:48:55] [764249a9cc4864d99a8b0ce95556daaa] [Current] | |||||||||||||||||||||||||||||||||||||||||
| Feedback Forum | |||||||||||||||||||||||||||||||||||||||||
Post a new message | |||||||||||||||||||||||||||||||||||||||||
Dataset | |||||||||||||||||||||||||||||||||||||||||
| Dataseries X: | |||||||||||||||||||||||||||||||||||||||||
120,79 120,18 118,04 115,74 115,54 115,02 112,77 112,39 114,44 114,99 118,33 119,01 120,37 120,35 120,15 119,86 120,44 120,69 121,26 120,5 117,58 116,49 116,02 116,13 115,65 116,22 116,86 116,22 116,93 117,32 116,6 117,85 118,45 118,74 120,56 122,05 126,27 136,55 136,26 134,94 134,73 134,09 126,29 120,13 121,83 122,26 121,98 122,19 123,15 123,96 126,31 127,14 126,29 125,68 127,14 128,29 129,3 132,03 132,63 132,23 132,38 130,67 129,49 123,42 113,41 113,01 110,19 104,13 103,6 103,74 104,04 103,84 103,16 103,05 103,13 103,38 102,79 102,8 102,39 102,31 101,91 101,03 100,25 99,53 99,5 | |||||||||||||||||||||||||||||||||||||||||
Tables (Output of Computation) | |||||||||||||||||||||||||||||||||||||||||
| |||||||||||||||||||||||||||||||||||||||||
Figures (Output of Computation) | |||||||||||||||||||||||||||||||||||||||||
Input Parameters & R Code | |||||||||||||||||||||||||||||||||||||||||
| Parameters (Session): | |||||||||||||||||||||||||||||||||||||||||
| par1 = consumptieprijzen van volle melk ; par2 = http://www.nbb.be/belgostat/DataAccesLinker?Lang=N&Code=consum ; par3 = volle melk ; par4 = 12 ; | |||||||||||||||||||||||||||||||||||||||||
| Parameters (R input): | |||||||||||||||||||||||||||||||||||||||||
| par1 = consumptieprijzen van volle melk ; par2 = http://www.nbb.be/belgostat/DataAccesLinker?Lang=N&Code=consum ; par3 = volle melk ; par4 = 12 ; | |||||||||||||||||||||||||||||||||||||||||
| R code (references can be found in the software module): | |||||||||||||||||||||||||||||||||||||||||
if (par4 != 'No season') { | |||||||||||||||||||||||||||||||||||||||||