Free Statistics

of Irreproducible Research!

Author's title

Author*Unverified author*
R Software Modulerwasp_autocorrelation.wasp
Title produced by software(Partial) Autocorrelation Function
Date of computationSun, 29 Dec 2013 13:34:01 -0500
Cite this page as followsStatistical Computations at FreeStatistics.org, Office for Research Development and Education, URL https://freestatistics.org/blog/index.php?v=date/2013/Dec/29/t1388342142seshl79ih0ettye.htm/, Retrieved Thu, 25 Apr 2024 08:34:20 +0000
Statistical Computations at FreeStatistics.org, Office for Research Development and Education, URL https://freestatistics.org/blog/index.php?pk=232658, Retrieved Thu, 25 Apr 2024 08:34:20 +0000
QR Codes:

Original text written by user:
IsPrivate?No (this computation is public)
User-defined keywords
Estimated Impact103
Family? (F = Feedback message, R = changed R code, M = changed R Module, P = changed Parameters, D = changed Data)
-       [(Partial) Autocorrelation Function] [autocorrelatie aa...] [2013-12-29 18:34:01] [a0dc50058fa7049d3ca1c49ed2014afb] [Current]
Feedback Forum

Post a new message
Dataseries X:
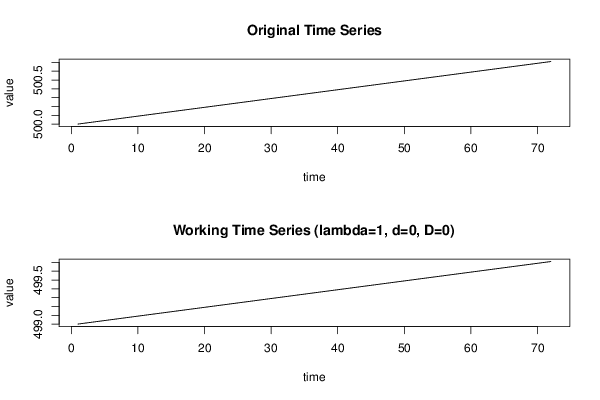
500
500.01
500.02
500.03
500.04
500.05
500.06
500.07
500.08
500.09
500.10
500.11
500.12
500.13
500.14
500.15
500.16
500.17
500.18
500.19
500.20
500.21
500.22
500.23
500.24
500.25
500.26
500.27
500.28
500.29
500.30
500.31
500.32
500.33
500.34
500.35
500.36
500.37
500.38
500.39
500.40
500.41
500.42
500.43
500.44
500.45
500.46
500.47
500.48
500.49
500.50
500.51
500.52
500.53
500.54
500.55
500.56
500.57
500.58
500.59
500.60
500.61
500.62
500.63
500.64
500.65
500.66
500.67
500.68
500.69
500.70
500.71


Summary of computational transaction
Raw Inputview raw input (R code)
Raw Outputview raw output of R engine
Computing time3 seconds
R Server'Gwilym Jenkins' @ jenkins.wessa.net

\begin{tabular}{lllllllll}
\hline
Summary of computational transaction \tabularnewline
Raw Input & view raw input (R code)  \tabularnewline
Raw Output & view raw output of R engine  \tabularnewline
Computing time & 3 seconds \tabularnewline
R Server & 'Gwilym Jenkins' @ jenkins.wessa.net \tabularnewline
\hline
\end{tabular}
%Source: https://freestatistics.org/blog/index.php?pk=232658&T=0

[TABLE]
[ROW][C]Summary of computational transaction[/C][/ROW]
[ROW][C]Raw Input[/C][C]view raw input (R code) [/C][/ROW]
[ROW][C]Raw Output[/C][C]view raw output of R engine [/C][/ROW]
[ROW][C]Computing time[/C][C]3 seconds[/C][/ROW]
[ROW][C]R Server[/C][C]'Gwilym Jenkins' @ jenkins.wessa.net[/C][/ROW]
[/TABLE]
Source: https://freestatistics.org/blog/index.php?pk=232658&T=0

Globally Unique Identifier (entire table): ba.freestatistics.org/blog/index.php?pk=232658&T=0

As an alternative you can also use a QR Code:  

The GUIDs for individual cells are displayed in the table below:

Summary of computational transaction
Raw Inputview raw input (R code)
Raw Outputview raw output of R engine
Computing time3 seconds
R Server'Gwilym Jenkins' @ jenkins.wessa.net


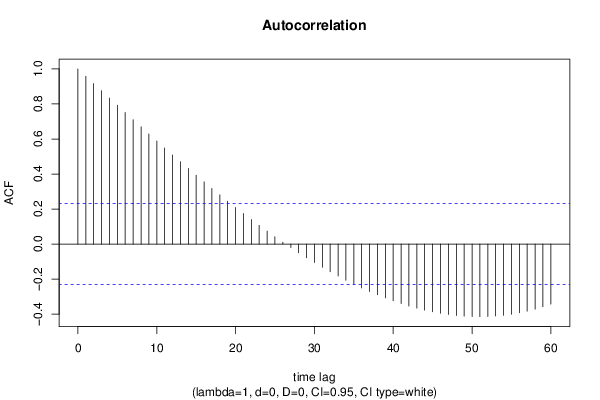
Autocorrelation Function
Time lag kACF(k)T-STATP-value
10.9583338.13170
20.9166997.77840
30.8751297.42570
40.8336557.07380
50.792316.7230
60.7511256.37350
70.7101346.02570
80.6693685.67980
90.6288595.3361e-06
100.5886394.99482e-06
110.5487414.65627e-06
120.5091974.32072.5e-05
130.4700383.98847.9e-05
140.4312983.65970.000239
150.3930083.33480.000676
160.35523.0140.001779
170.3179062.69750.004348
180.281162.38570.009839
190.2449922.07880.020599
200.2094351.77710.039887
210.1745211.48090.071504
220.1402821.19030.118912
230.1067510.90580.184028
240.073960.62760.266136
250.041940.35590.361488
260.0107240.0910.463874
27-0.019656-0.16680.434004
28-0.049167-0.41720.338888
29-0.077778-0.660.255689
30-0.105457-0.89480.186929
31-0.132171-1.12150.132899
32-0.157888-1.33970.092274
33-0.182576-1.54920.062858
34-0.206203-1.74970.042216
35-0.228737-1.94090.028093
36-0.250145-2.12250.018616
37-0.270395-2.29440.012344
38-0.289456-2.45610.008229
39-0.307295-2.60750.005541
40-0.323879-2.74820.003784
41-0.339178-2.8780.002632
42-0.353158-2.99660.001871
43-0.365787-3.10380.001365
44-0.377034-3.19920.001025
45-0.386866-3.28270.000794
46-0.39525-3.35380.000637
47-0.402156-3.41240.00053
48-0.40755-3.45820.000458
49-0.411401-3.49090.000413
50-0.413676-3.51020.000388
51-0.414343-3.51580.000381
52-0.413371-3.50760.000392
53-0.410726-3.48510.000421
54-0.406377-3.44820.000473
55-0.400291-3.39660.000557
56-0.392437-3.32990.000686
57-0.382782-3.2480.000883
58-0.371294-3.15050.001187
59-0.357941-3.03720.001662
60-0.342691-2.90780.002418

\begin{tabular}{lllllllll}
\hline
Autocorrelation Function \tabularnewline
Time lag k & ACF(k) & T-STAT & P-value \tabularnewline
1 & 0.958333 & 8.1317 & 0 \tabularnewline
2 & 0.916699 & 7.7784 & 0 \tabularnewline
3 & 0.875129 & 7.4257 & 0 \tabularnewline
4 & 0.833655 & 7.0738 & 0 \tabularnewline
5 & 0.79231 & 6.723 & 0 \tabularnewline
6 & 0.751125 & 6.3735 & 0 \tabularnewline
7 & 0.710134 & 6.0257 & 0 \tabularnewline
8 & 0.669368 & 5.6798 & 0 \tabularnewline
9 & 0.628859 & 5.336 & 1e-06 \tabularnewline
10 & 0.588639 & 4.9948 & 2e-06 \tabularnewline
11 & 0.548741 & 4.6562 & 7e-06 \tabularnewline
12 & 0.509197 & 4.3207 & 2.5e-05 \tabularnewline
13 & 0.470038 & 3.9884 & 7.9e-05 \tabularnewline
14 & 0.431298 & 3.6597 & 0.000239 \tabularnewline
15 & 0.393008 & 3.3348 & 0.000676 \tabularnewline
16 & 0.3552 & 3.014 & 0.001779 \tabularnewline
17 & 0.317906 & 2.6975 & 0.004348 \tabularnewline
18 & 0.28116 & 2.3857 & 0.009839 \tabularnewline
19 & 0.244992 & 2.0788 & 0.020599 \tabularnewline
20 & 0.209435 & 1.7771 & 0.039887 \tabularnewline
21 & 0.174521 & 1.4809 & 0.071504 \tabularnewline
22 & 0.140282 & 1.1903 & 0.118912 \tabularnewline
23 & 0.106751 & 0.9058 & 0.184028 \tabularnewline
24 & 0.07396 & 0.6276 & 0.266136 \tabularnewline
25 & 0.04194 & 0.3559 & 0.361488 \tabularnewline
26 & 0.010724 & 0.091 & 0.463874 \tabularnewline
27 & -0.019656 & -0.1668 & 0.434004 \tabularnewline
28 & -0.049167 & -0.4172 & 0.338888 \tabularnewline
29 & -0.077778 & -0.66 & 0.255689 \tabularnewline
30 & -0.105457 & -0.8948 & 0.186929 \tabularnewline
31 & -0.132171 & -1.1215 & 0.132899 \tabularnewline
32 & -0.157888 & -1.3397 & 0.092274 \tabularnewline
33 & -0.182576 & -1.5492 & 0.062858 \tabularnewline
34 & -0.206203 & -1.7497 & 0.042216 \tabularnewline
35 & -0.228737 & -1.9409 & 0.028093 \tabularnewline
36 & -0.250145 & -2.1225 & 0.018616 \tabularnewline
37 & -0.270395 & -2.2944 & 0.012344 \tabularnewline
38 & -0.289456 & -2.4561 & 0.008229 \tabularnewline
39 & -0.307295 & -2.6075 & 0.005541 \tabularnewline
40 & -0.323879 & -2.7482 & 0.003784 \tabularnewline
41 & -0.339178 & -2.878 & 0.002632 \tabularnewline
42 & -0.353158 & -2.9966 & 0.001871 \tabularnewline
43 & -0.365787 & -3.1038 & 0.001365 \tabularnewline
44 & -0.377034 & -3.1992 & 0.001025 \tabularnewline
45 & -0.386866 & -3.2827 & 0.000794 \tabularnewline
46 & -0.39525 & -3.3538 & 0.000637 \tabularnewline
47 & -0.402156 & -3.4124 & 0.00053 \tabularnewline
48 & -0.40755 & -3.4582 & 0.000458 \tabularnewline
49 & -0.411401 & -3.4909 & 0.000413 \tabularnewline
50 & -0.413676 & -3.5102 & 0.000388 \tabularnewline
51 & -0.414343 & -3.5158 & 0.000381 \tabularnewline
52 & -0.413371 & -3.5076 & 0.000392 \tabularnewline
53 & -0.410726 & -3.4851 & 0.000421 \tabularnewline
54 & -0.406377 & -3.4482 & 0.000473 \tabularnewline
55 & -0.400291 & -3.3966 & 0.000557 \tabularnewline
56 & -0.392437 & -3.3299 & 0.000686 \tabularnewline
57 & -0.382782 & -3.248 & 0.000883 \tabularnewline
58 & -0.371294 & -3.1505 & 0.001187 \tabularnewline
59 & -0.357941 & -3.0372 & 0.001662 \tabularnewline
60 & -0.342691 & -2.9078 & 0.002418 \tabularnewline
\hline
\end{tabular}
%Source: https://freestatistics.org/blog/index.php?pk=232658&T=1

[TABLE]
[ROW][C]Autocorrelation Function[/C][/ROW]
[ROW][C]Time lag k[/C][C]ACF(k)[/C][C]T-STAT[/C][C]P-value[/C][/ROW]
[ROW][C]1[/C][C]0.958333[/C][C]8.1317[/C][C]0[/C][/ROW]
[ROW][C]2[/C][C]0.916699[/C][C]7.7784[/C][C]0[/C][/ROW]
[ROW][C]3[/C][C]0.875129[/C][C]7.4257[/C][C]0[/C][/ROW]
[ROW][C]4[/C][C]0.833655[/C][C]7.0738[/C][C]0[/C][/ROW]
[ROW][C]5[/C][C]0.79231[/C][C]6.723[/C][C]0[/C][/ROW]
[ROW][C]6[/C][C]0.751125[/C][C]6.3735[/C][C]0[/C][/ROW]
[ROW][C]7[/C][C]0.710134[/C][C]6.0257[/C][C]0[/C][/ROW]
[ROW][C]8[/C][C]0.669368[/C][C]5.6798[/C][C]0[/C][/ROW]
[ROW][C]9[/C][C]0.628859[/C][C]5.336[/C][C]1e-06[/C][/ROW]
[ROW][C]10[/C][C]0.588639[/C][C]4.9948[/C][C]2e-06[/C][/ROW]
[ROW][C]11[/C][C]0.548741[/C][C]4.6562[/C][C]7e-06[/C][/ROW]
[ROW][C]12[/C][C]0.509197[/C][C]4.3207[/C][C]2.5e-05[/C][/ROW]
[ROW][C]13[/C][C]0.470038[/C][C]3.9884[/C][C]7.9e-05[/C][/ROW]
[ROW][C]14[/C][C]0.431298[/C][C]3.6597[/C][C]0.000239[/C][/ROW]
[ROW][C]15[/C][C]0.393008[/C][C]3.3348[/C][C]0.000676[/C][/ROW]
[ROW][C]16[/C][C]0.3552[/C][C]3.014[/C][C]0.001779[/C][/ROW]
[ROW][C]17[/C][C]0.317906[/C][C]2.6975[/C][C]0.004348[/C][/ROW]
[ROW][C]18[/C][C]0.28116[/C][C]2.3857[/C][C]0.009839[/C][/ROW]
[ROW][C]19[/C][C]0.244992[/C][C]2.0788[/C][C]0.020599[/C][/ROW]
[ROW][C]20[/C][C]0.209435[/C][C]1.7771[/C][C]0.039887[/C][/ROW]
[ROW][C]21[/C][C]0.174521[/C][C]1.4809[/C][C]0.071504[/C][/ROW]
[ROW][C]22[/C][C]0.140282[/C][C]1.1903[/C][C]0.118912[/C][/ROW]
[ROW][C]23[/C][C]0.106751[/C][C]0.9058[/C][C]0.184028[/C][/ROW]
[ROW][C]24[/C][C]0.07396[/C][C]0.6276[/C][C]0.266136[/C][/ROW]
[ROW][C]25[/C][C]0.04194[/C][C]0.3559[/C][C]0.361488[/C][/ROW]
[ROW][C]26[/C][C]0.010724[/C][C]0.091[/C][C]0.463874[/C][/ROW]
[ROW][C]27[/C][C]-0.019656[/C][C]-0.1668[/C][C]0.434004[/C][/ROW]
[ROW][C]28[/C][C]-0.049167[/C][C]-0.4172[/C][C]0.338888[/C][/ROW]
[ROW][C]29[/C][C]-0.077778[/C][C]-0.66[/C][C]0.255689[/C][/ROW]
[ROW][C]30[/C][C]-0.105457[/C][C]-0.8948[/C][C]0.186929[/C][/ROW]
[ROW][C]31[/C][C]-0.132171[/C][C]-1.1215[/C][C]0.132899[/C][/ROW]
[ROW][C]32[/C][C]-0.157888[/C][C]-1.3397[/C][C]0.092274[/C][/ROW]
[ROW][C]33[/C][C]-0.182576[/C][C]-1.5492[/C][C]0.062858[/C][/ROW]
[ROW][C]34[/C][C]-0.206203[/C][C]-1.7497[/C][C]0.042216[/C][/ROW]
[ROW][C]35[/C][C]-0.228737[/C][C]-1.9409[/C][C]0.028093[/C][/ROW]
[ROW][C]36[/C][C]-0.250145[/C][C]-2.1225[/C][C]0.018616[/C][/ROW]
[ROW][C]37[/C][C]-0.270395[/C][C]-2.2944[/C][C]0.012344[/C][/ROW]
[ROW][C]38[/C][C]-0.289456[/C][C]-2.4561[/C][C]0.008229[/C][/ROW]
[ROW][C]39[/C][C]-0.307295[/C][C]-2.6075[/C][C]0.005541[/C][/ROW]
[ROW][C]40[/C][C]-0.323879[/C][C]-2.7482[/C][C]0.003784[/C][/ROW]
[ROW][C]41[/C][C]-0.339178[/C][C]-2.878[/C][C]0.002632[/C][/ROW]
[ROW][C]42[/C][C]-0.353158[/C][C]-2.9966[/C][C]0.001871[/C][/ROW]
[ROW][C]43[/C][C]-0.365787[/C][C]-3.1038[/C][C]0.001365[/C][/ROW]
[ROW][C]44[/C][C]-0.377034[/C][C]-3.1992[/C][C]0.001025[/C][/ROW]
[ROW][C]45[/C][C]-0.386866[/C][C]-3.2827[/C][C]0.000794[/C][/ROW]
[ROW][C]46[/C][C]-0.39525[/C][C]-3.3538[/C][C]0.000637[/C][/ROW]
[ROW][C]47[/C][C]-0.402156[/C][C]-3.4124[/C][C]0.00053[/C][/ROW]
[ROW][C]48[/C][C]-0.40755[/C][C]-3.4582[/C][C]0.000458[/C][/ROW]
[ROW][C]49[/C][C]-0.411401[/C][C]-3.4909[/C][C]0.000413[/C][/ROW]
[ROW][C]50[/C][C]-0.413676[/C][C]-3.5102[/C][C]0.000388[/C][/ROW]
[ROW][C]51[/C][C]-0.414343[/C][C]-3.5158[/C][C]0.000381[/C][/ROW]
[ROW][C]52[/C][C]-0.413371[/C][C]-3.5076[/C][C]0.000392[/C][/ROW]
[ROW][C]53[/C][C]-0.410726[/C][C]-3.4851[/C][C]0.000421[/C][/ROW]
[ROW][C]54[/C][C]-0.406377[/C][C]-3.4482[/C][C]0.000473[/C][/ROW]
[ROW][C]55[/C][C]-0.400291[/C][C]-3.3966[/C][C]0.000557[/C][/ROW]
[ROW][C]56[/C][C]-0.392437[/C][C]-3.3299[/C][C]0.000686[/C][/ROW]
[ROW][C]57[/C][C]-0.382782[/C][C]-3.248[/C][C]0.000883[/C][/ROW]
[ROW][C]58[/C][C]-0.371294[/C][C]-3.1505[/C][C]0.001187[/C][/ROW]
[ROW][C]59[/C][C]-0.357941[/C][C]-3.0372[/C][C]0.001662[/C][/ROW]
[ROW][C]60[/C][C]-0.342691[/C][C]-2.9078[/C][C]0.002418[/C][/ROW]
[/TABLE]
Source: https://freestatistics.org/blog/index.php?pk=232658&T=1

Globally Unique Identifier (entire table): ba.freestatistics.org/blog/index.php?pk=232658&T=1

As an alternative you can also use a QR Code:  

The GUIDs for individual cells are displayed in the table below:

Autocorrelation Function
Time lag kACF(k)T-STATP-value
10.9583338.13170
20.9166997.77840
30.8751297.42570
40.8336557.07380
50.792316.7230
60.7511256.37350
70.7101346.02570
80.6693685.67980
90.6288595.3361e-06
100.5886394.99482e-06
110.5487414.65627e-06
120.5091974.32072.5e-05
130.4700383.98847.9e-05
140.4312983.65970.000239
150.3930083.33480.000676
160.35523.0140.001779
170.3179062.69750.004348
180.281162.38570.009839
190.2449922.07880.020599
200.2094351.77710.039887
210.1745211.48090.071504
220.1402821.19030.118912
230.1067510.90580.184028
240.073960.62760.266136
250.041940.35590.361488
260.0107240.0910.463874
27-0.019656-0.16680.434004
28-0.049167-0.41720.338888
29-0.077778-0.660.255689
30-0.105457-0.89480.186929
31-0.132171-1.12150.132899
32-0.157888-1.33970.092274
33-0.182576-1.54920.062858
34-0.206203-1.74970.042216
35-0.228737-1.94090.028093
36-0.250145-2.12250.018616
37-0.270395-2.29440.012344
38-0.289456-2.45610.008229
39-0.307295-2.60750.005541
40-0.323879-2.74820.003784
41-0.339178-2.8780.002632
42-0.353158-2.99660.001871
43-0.365787-3.10380.001365
44-0.377034-3.19920.001025
45-0.386866-3.28270.000794
46-0.39525-3.35380.000637
47-0.402156-3.41240.00053
48-0.40755-3.45820.000458
49-0.411401-3.49090.000413
50-0.413676-3.51020.000388
51-0.414343-3.51580.000381
52-0.413371-3.50760.000392
53-0.410726-3.48510.000421
54-0.406377-3.44820.000473
55-0.400291-3.39660.000557
56-0.392437-3.32990.000686
57-0.382782-3.2480.000883
58-0.371294-3.15050.001187
59-0.357941-3.03720.001662
60-0.342691-2.90780.002418


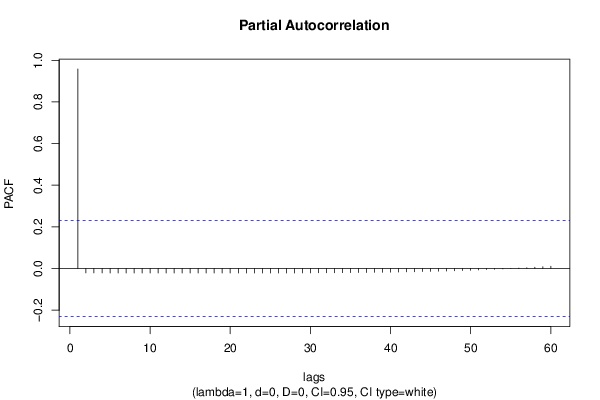
Partial Autocorrelation Function
Time lag kPACF(k)T-STATP-value
10.9583338.13170
2-0.020883-0.17720.429927
3-0.020933-0.17760.429758
4-0.020985-0.17810.429585
5-0.021038-0.17850.429409
6-0.021092-0.1790.429232
7-0.021145-0.17940.429055
8-0.021198-0.17990.42888
9-0.02125-0.18030.428707
10-0.0213-0.18070.42854
11-0.021349-0.18110.42838
12-0.021394-0.18150.428228
13-0.021437-0.18190.428087
14-0.021475-0.18220.42796
15-0.021509-0.18250.427848
16-0.021537-0.18270.427754
17-0.021559-0.18290.427681
18-0.021574-0.18310.427632
19-0.021581-0.18310.42761
20-0.021578-0.18310.427619
21-0.021565-0.1830.427662
22-0.021541-0.18280.427742
23-0.021504-0.18250.427865
24-0.021453-0.1820.428035
25-0.021386-0.18150.428256
26-0.021302-0.18080.428534
27-0.0212-0.17990.428874
28-0.021077-0.17880.429282
29-0.020931-0.17760.429765
30-0.020761-0.17620.430329
31-0.020565-0.17450.430981
32-0.02034-0.17260.43173
33-0.020083-0.17040.432583
34-0.019792-0.16790.433549
35-0.019465-0.16520.434638
36-0.019098-0.16210.435859
37-0.018689-0.15860.437222
38-0.018234-0.15470.438739
39-0.017729-0.15040.44042
40-0.017172-0.14570.442278
41-0.016559-0.14050.444325
42-0.015886-0.13480.446574
43-0.015149-0.12850.449039
44-0.014344-0.12170.451733
45-0.013467-0.11430.454669
46-0.012515-0.10620.457864
47-0.011482-0.09740.46133
48-0.010364-0.08790.465083
49-0.009158-0.07770.469137
50-0.00786-0.06670.473506
51-0.006464-0.05490.478205
52-0.004968-0.04220.483247
53-0.003366-0.02860.488645
54-0.001656-0.01410.494413
550.0001670.00140.499437
560.0021060.01790.492895
570.0041660.03540.485948
580.0063510.05390.478587
590.0086640.07350.470799
600.0111110.09430.462575

\begin{tabular}{lllllllll}
\hline
Partial Autocorrelation Function \tabularnewline
Time lag k & PACF(k) & T-STAT & P-value \tabularnewline
1 & 0.958333 & 8.1317 & 0 \tabularnewline
2 & -0.020883 & -0.1772 & 0.429927 \tabularnewline
3 & -0.020933 & -0.1776 & 0.429758 \tabularnewline
4 & -0.020985 & -0.1781 & 0.429585 \tabularnewline
5 & -0.021038 & -0.1785 & 0.429409 \tabularnewline
6 & -0.021092 & -0.179 & 0.429232 \tabularnewline
7 & -0.021145 & -0.1794 & 0.429055 \tabularnewline
8 & -0.021198 & -0.1799 & 0.42888 \tabularnewline
9 & -0.02125 & -0.1803 & 0.428707 \tabularnewline
10 & -0.0213 & -0.1807 & 0.42854 \tabularnewline
11 & -0.021349 & -0.1811 & 0.42838 \tabularnewline
12 & -0.021394 & -0.1815 & 0.428228 \tabularnewline
13 & -0.021437 & -0.1819 & 0.428087 \tabularnewline
14 & -0.021475 & -0.1822 & 0.42796 \tabularnewline
15 & -0.021509 & -0.1825 & 0.427848 \tabularnewline
16 & -0.021537 & -0.1827 & 0.427754 \tabularnewline
17 & -0.021559 & -0.1829 & 0.427681 \tabularnewline
18 & -0.021574 & -0.1831 & 0.427632 \tabularnewline
19 & -0.021581 & -0.1831 & 0.42761 \tabularnewline
20 & -0.021578 & -0.1831 & 0.427619 \tabularnewline
21 & -0.021565 & -0.183 & 0.427662 \tabularnewline
22 & -0.021541 & -0.1828 & 0.427742 \tabularnewline
23 & -0.021504 & -0.1825 & 0.427865 \tabularnewline
24 & -0.021453 & -0.182 & 0.428035 \tabularnewline
25 & -0.021386 & -0.1815 & 0.428256 \tabularnewline
26 & -0.021302 & -0.1808 & 0.428534 \tabularnewline
27 & -0.0212 & -0.1799 & 0.428874 \tabularnewline
28 & -0.021077 & -0.1788 & 0.429282 \tabularnewline
29 & -0.020931 & -0.1776 & 0.429765 \tabularnewline
30 & -0.020761 & -0.1762 & 0.430329 \tabularnewline
31 & -0.020565 & -0.1745 & 0.430981 \tabularnewline
32 & -0.02034 & -0.1726 & 0.43173 \tabularnewline
33 & -0.020083 & -0.1704 & 0.432583 \tabularnewline
34 & -0.019792 & -0.1679 & 0.433549 \tabularnewline
35 & -0.019465 & -0.1652 & 0.434638 \tabularnewline
36 & -0.019098 & -0.1621 & 0.435859 \tabularnewline
37 & -0.018689 & -0.1586 & 0.437222 \tabularnewline
38 & -0.018234 & -0.1547 & 0.438739 \tabularnewline
39 & -0.017729 & -0.1504 & 0.44042 \tabularnewline
40 & -0.017172 & -0.1457 & 0.442278 \tabularnewline
41 & -0.016559 & -0.1405 & 0.444325 \tabularnewline
42 & -0.015886 & -0.1348 & 0.446574 \tabularnewline
43 & -0.015149 & -0.1285 & 0.449039 \tabularnewline
44 & -0.014344 & -0.1217 & 0.451733 \tabularnewline
45 & -0.013467 & -0.1143 & 0.454669 \tabularnewline
46 & -0.012515 & -0.1062 & 0.457864 \tabularnewline
47 & -0.011482 & -0.0974 & 0.46133 \tabularnewline
48 & -0.010364 & -0.0879 & 0.465083 \tabularnewline
49 & -0.009158 & -0.0777 & 0.469137 \tabularnewline
50 & -0.00786 & -0.0667 & 0.473506 \tabularnewline
51 & -0.006464 & -0.0549 & 0.478205 \tabularnewline
52 & -0.004968 & -0.0422 & 0.483247 \tabularnewline
53 & -0.003366 & -0.0286 & 0.488645 \tabularnewline
54 & -0.001656 & -0.0141 & 0.494413 \tabularnewline
55 & 0.000167 & 0.0014 & 0.499437 \tabularnewline
56 & 0.002106 & 0.0179 & 0.492895 \tabularnewline
57 & 0.004166 & 0.0354 & 0.485948 \tabularnewline
58 & 0.006351 & 0.0539 & 0.478587 \tabularnewline
59 & 0.008664 & 0.0735 & 0.470799 \tabularnewline
60 & 0.011111 & 0.0943 & 0.462575 \tabularnewline
\hline
\end{tabular}
%Source: https://freestatistics.org/blog/index.php?pk=232658&T=2

[TABLE]
[ROW][C]Partial Autocorrelation Function[/C][/ROW]
[ROW][C]Time lag k[/C][C]PACF(k)[/C][C]T-STAT[/C][C]P-value[/C][/ROW]
[ROW][C]1[/C][C]0.958333[/C][C]8.1317[/C][C]0[/C][/ROW]
[ROW][C]2[/C][C]-0.020883[/C][C]-0.1772[/C][C]0.429927[/C][/ROW]
[ROW][C]3[/C][C]-0.020933[/C][C]-0.1776[/C][C]0.429758[/C][/ROW]
[ROW][C]4[/C][C]-0.020985[/C][C]-0.1781[/C][C]0.429585[/C][/ROW]
[ROW][C]5[/C][C]-0.021038[/C][C]-0.1785[/C][C]0.429409[/C][/ROW]
[ROW][C]6[/C][C]-0.021092[/C][C]-0.179[/C][C]0.429232[/C][/ROW]
[ROW][C]7[/C][C]-0.021145[/C][C]-0.1794[/C][C]0.429055[/C][/ROW]
[ROW][C]8[/C][C]-0.021198[/C][C]-0.1799[/C][C]0.42888[/C][/ROW]
[ROW][C]9[/C][C]-0.02125[/C][C]-0.1803[/C][C]0.428707[/C][/ROW]
[ROW][C]10[/C][C]-0.0213[/C][C]-0.1807[/C][C]0.42854[/C][/ROW]
[ROW][C]11[/C][C]-0.021349[/C][C]-0.1811[/C][C]0.42838[/C][/ROW]
[ROW][C]12[/C][C]-0.021394[/C][C]-0.1815[/C][C]0.428228[/C][/ROW]
[ROW][C]13[/C][C]-0.021437[/C][C]-0.1819[/C][C]0.428087[/C][/ROW]
[ROW][C]14[/C][C]-0.021475[/C][C]-0.1822[/C][C]0.42796[/C][/ROW]
[ROW][C]15[/C][C]-0.021509[/C][C]-0.1825[/C][C]0.427848[/C][/ROW]
[ROW][C]16[/C][C]-0.021537[/C][C]-0.1827[/C][C]0.427754[/C][/ROW]
[ROW][C]17[/C][C]-0.021559[/C][C]-0.1829[/C][C]0.427681[/C][/ROW]
[ROW][C]18[/C][C]-0.021574[/C][C]-0.1831[/C][C]0.427632[/C][/ROW]
[ROW][C]19[/C][C]-0.021581[/C][C]-0.1831[/C][C]0.42761[/C][/ROW]
[ROW][C]20[/C][C]-0.021578[/C][C]-0.1831[/C][C]0.427619[/C][/ROW]
[ROW][C]21[/C][C]-0.021565[/C][C]-0.183[/C][C]0.427662[/C][/ROW]
[ROW][C]22[/C][C]-0.021541[/C][C]-0.1828[/C][C]0.427742[/C][/ROW]
[ROW][C]23[/C][C]-0.021504[/C][C]-0.1825[/C][C]0.427865[/C][/ROW]
[ROW][C]24[/C][C]-0.021453[/C][C]-0.182[/C][C]0.428035[/C][/ROW]
[ROW][C]25[/C][C]-0.021386[/C][C]-0.1815[/C][C]0.428256[/C][/ROW]
[ROW][C]26[/C][C]-0.021302[/C][C]-0.1808[/C][C]0.428534[/C][/ROW]
[ROW][C]27[/C][C]-0.0212[/C][C]-0.1799[/C][C]0.428874[/C][/ROW]
[ROW][C]28[/C][C]-0.021077[/C][C]-0.1788[/C][C]0.429282[/C][/ROW]
[ROW][C]29[/C][C]-0.020931[/C][C]-0.1776[/C][C]0.429765[/C][/ROW]
[ROW][C]30[/C][C]-0.020761[/C][C]-0.1762[/C][C]0.430329[/C][/ROW]
[ROW][C]31[/C][C]-0.020565[/C][C]-0.1745[/C][C]0.430981[/C][/ROW]
[ROW][C]32[/C][C]-0.02034[/C][C]-0.1726[/C][C]0.43173[/C][/ROW]
[ROW][C]33[/C][C]-0.020083[/C][C]-0.1704[/C][C]0.432583[/C][/ROW]
[ROW][C]34[/C][C]-0.019792[/C][C]-0.1679[/C][C]0.433549[/C][/ROW]
[ROW][C]35[/C][C]-0.019465[/C][C]-0.1652[/C][C]0.434638[/C][/ROW]
[ROW][C]36[/C][C]-0.019098[/C][C]-0.1621[/C][C]0.435859[/C][/ROW]
[ROW][C]37[/C][C]-0.018689[/C][C]-0.1586[/C][C]0.437222[/C][/ROW]
[ROW][C]38[/C][C]-0.018234[/C][C]-0.1547[/C][C]0.438739[/C][/ROW]
[ROW][C]39[/C][C]-0.017729[/C][C]-0.1504[/C][C]0.44042[/C][/ROW]
[ROW][C]40[/C][C]-0.017172[/C][C]-0.1457[/C][C]0.442278[/C][/ROW]
[ROW][C]41[/C][C]-0.016559[/C][C]-0.1405[/C][C]0.444325[/C][/ROW]
[ROW][C]42[/C][C]-0.015886[/C][C]-0.1348[/C][C]0.446574[/C][/ROW]
[ROW][C]43[/C][C]-0.015149[/C][C]-0.1285[/C][C]0.449039[/C][/ROW]
[ROW][C]44[/C][C]-0.014344[/C][C]-0.1217[/C][C]0.451733[/C][/ROW]
[ROW][C]45[/C][C]-0.013467[/C][C]-0.1143[/C][C]0.454669[/C][/ROW]
[ROW][C]46[/C][C]-0.012515[/C][C]-0.1062[/C][C]0.457864[/C][/ROW]
[ROW][C]47[/C][C]-0.011482[/C][C]-0.0974[/C][C]0.46133[/C][/ROW]
[ROW][C]48[/C][C]-0.010364[/C][C]-0.0879[/C][C]0.465083[/C][/ROW]
[ROW][C]49[/C][C]-0.009158[/C][C]-0.0777[/C][C]0.469137[/C][/ROW]
[ROW][C]50[/C][C]-0.00786[/C][C]-0.0667[/C][C]0.473506[/C][/ROW]
[ROW][C]51[/C][C]-0.006464[/C][C]-0.0549[/C][C]0.478205[/C][/ROW]
[ROW][C]52[/C][C]-0.004968[/C][C]-0.0422[/C][C]0.483247[/C][/ROW]
[ROW][C]53[/C][C]-0.003366[/C][C]-0.0286[/C][C]0.488645[/C][/ROW]
[ROW][C]54[/C][C]-0.001656[/C][C]-0.0141[/C][C]0.494413[/C][/ROW]
[ROW][C]55[/C][C]0.000167[/C][C]0.0014[/C][C]0.499437[/C][/ROW]
[ROW][C]56[/C][C]0.002106[/C][C]0.0179[/C][C]0.492895[/C][/ROW]
[ROW][C]57[/C][C]0.004166[/C][C]0.0354[/C][C]0.485948[/C][/ROW]
[ROW][C]58[/C][C]0.006351[/C][C]0.0539[/C][C]0.478587[/C][/ROW]
[ROW][C]59[/C][C]0.008664[/C][C]0.0735[/C][C]0.470799[/C][/ROW]
[ROW][C]60[/C][C]0.011111[/C][C]0.0943[/C][C]0.462575[/C][/ROW]
[/TABLE]
Source: https://freestatistics.org/blog/index.php?pk=232658&T=2

Globally Unique Identifier (entire table): ba.freestatistics.org/blog/index.php?pk=232658&T=2

As an alternative you can also use a QR Code:  

The GUIDs for individual cells are displayed in the table below:

Partial Autocorrelation Function
Time lag kPACF(k)T-STATP-value
10.9583338.13170
2-0.020883-0.17720.429927
3-0.020933-0.17760.429758
4-0.020985-0.17810.429585
5-0.021038-0.17850.429409
6-0.021092-0.1790.429232
7-0.021145-0.17940.429055
8-0.021198-0.17990.42888
9-0.02125-0.18030.428707
10-0.0213-0.18070.42854
11-0.021349-0.18110.42838
12-0.021394-0.18150.428228
13-0.021437-0.18190.428087
14-0.021475-0.18220.42796
15-0.021509-0.18250.427848
16-0.021537-0.18270.427754
17-0.021559-0.18290.427681
18-0.021574-0.18310.427632
19-0.021581-0.18310.42761
20-0.021578-0.18310.427619
21-0.021565-0.1830.427662
22-0.021541-0.18280.427742
23-0.021504-0.18250.427865
24-0.021453-0.1820.428035
25-0.021386-0.18150.428256
26-0.021302-0.18080.428534
27-0.0212-0.17990.428874
28-0.021077-0.17880.429282
29-0.020931-0.17760.429765
30-0.020761-0.17620.430329
31-0.020565-0.17450.430981
32-0.02034-0.17260.43173
33-0.020083-0.17040.432583
34-0.019792-0.16790.433549
35-0.019465-0.16520.434638
36-0.019098-0.16210.435859
37-0.018689-0.15860.437222
38-0.018234-0.15470.438739
39-0.017729-0.15040.44042
40-0.017172-0.14570.442278
41-0.016559-0.14050.444325
42-0.015886-0.13480.446574
43-0.015149-0.12850.449039
44-0.014344-0.12170.451733
45-0.013467-0.11430.454669
46-0.012515-0.10620.457864
47-0.011482-0.09740.46133
48-0.010364-0.08790.465083
49-0.009158-0.07770.469137
50-0.00786-0.06670.473506
51-0.006464-0.05490.478205
52-0.004968-0.04220.483247
53-0.003366-0.02860.488645
54-0.001656-0.01410.494413
550.0001670.00140.499437
560.0021060.01790.492895
570.0041660.03540.485948
580.0063510.05390.478587
590.0086640.07350.470799
600.0111110.09430.462575


Parameters (Session):
par1 = 60 ; par2 = 1 ; par3 = 0 ; par4 = 0 ; par5 = 12 ; par6 = White Noise ; par7 = 0.95 ;
Parameters (R input):
par1 = 60 ; par2 = 1 ; par3 = 0 ; par4 = 0 ; par5 = 12 ; par6 = White Noise ; par7 = 0.95 ; par8 = ;
R code (references can be found in the software module):
par8 <- ''
par7 <- '0.95'
par6 <- 'White Noise'
par5 <- '12'
par4 <- '0'
par3 <- '0'
par2 <- '1'
par1 <- '48'
if (par1 == 'Default') {
par1 = 10*log10(length(x))
} else {
par1 <- as.numeric(par1)
}
par2 <- as.numeric(par2)
par3 <- as.numeric(par3)
par4 <- as.numeric(par4)
par5 <- as.numeric(par5)
if (par6 == 'White Noise') par6 <- 'white' else par6 <- 'ma'
par7 <- as.numeric(par7)
if (par8 != '') par8 <- as.numeric(par8)
ox <- x
if (par8 == '') {
if (par2 == 0) {
x <- log(x)
} else {
x <- (x ^ par2 - 1) / par2
}
} else {
x <- log(x,base=par8)
}
if (par3 > 0) x <- diff(x,lag=1,difference=par3)
if (par4 > 0) x <- diff(x,lag=par5,difference=par4)
bitmap(file='picts.png')
op <- par(mfrow=c(2,1))
plot(ox,type='l',main='Original Time Series',xlab='time',ylab='value')
if (par8=='') {
mytitle <- paste('Working Time Series (lambda=',par2,', d=',par3,', D=',par4,')',sep='')
mysub <- paste('(lambda=',par2,', d=',par3,', D=',par4,', CI=', par7, ', CI type=',par6,')',sep='')
} else {
mytitle <- paste('Working Time Series (base=',par8,', d=',par3,', D=',par4,')',sep='')
mysub <- paste('(base=',par8,', d=',par3,', D=',par4,', CI=', par7, ', CI type=',par6,')',sep='')
}
plot(x,type='l', main=mytitle,xlab='time',ylab='value')
par(op)
dev.off()
bitmap(file='pic1.png')
racf <- acf(x, par1, main='Autocorrelation', xlab='time lag', ylab='ACF', ci.type=par6, ci=par7, sub=mysub)
dev.off()
bitmap(file='pic2.png')
rpacf <- pacf(x,par1,main='Partial Autocorrelation',xlab='lags',ylab='PACF',sub=mysub)
dev.off()
(myacf <- c(racf$acf))
(mypacf <- c(rpacf$acf))
lengthx <- length(x)
sqrtn <- sqrt(lengthx)
load(file='createtable')
a<-table.start()
a<-table.row.start(a)
a<-table.element(a,'Autocorrelation Function',4,TRUE)
a<-table.row.end(a)
a<-table.row.start(a)
a<-table.element(a,'Time lag k',header=TRUE)
a<-table.element(a,hyperlink('basics.htm','ACF(k)','click here for more information about the Autocorrelation Function'),header=TRUE)
a<-table.element(a,'T-STAT',header=TRUE)
a<-table.element(a,'P-value',header=TRUE)
a<-table.row.end(a)
for (i in 2:(par1+1)) {
a<-table.row.start(a)
a<-table.element(a,i-1,header=TRUE)
a<-table.element(a,round(myacf[i],6))
mytstat <- myacf[i]*sqrtn
a<-table.element(a,round(mytstat,4))
a<-table.element(a,round(1-pt(abs(mytstat),lengthx),6))
a<-table.row.end(a)
}
a<-table.end(a)
table.save(a,file='mytable.tab')
a<-table.start()
a<-table.row.start(a)
a<-table.element(a,'Partial Autocorrelation Function',4,TRUE)
a<-table.row.end(a)
a<-table.row.start(a)
a<-table.element(a,'Time lag k',header=TRUE)
a<-table.element(a,hyperlink('basics.htm','PACF(k)','click here for more information about the Partial Autocorrelation Function'),header=TRUE)
a<-table.element(a,'T-STAT',header=TRUE)
a<-table.element(a,'P-value',header=TRUE)
a<-table.row.end(a)
for (i in 1:par1) {
a<-table.row.start(a)
a<-table.element(a,i,header=TRUE)
a<-table.element(a,round(mypacf[i],6))
mytstat <- mypacf[i]*sqrtn
a<-table.element(a,round(mytstat,4))
a<-table.element(a,round(1-pt(abs(mytstat),lengthx),6))
a<-table.row.end(a)
}
a<-table.end(a)
table.save(a,file='mytable1.tab')