Free Statistics

of Irreproducible Research!

Author's title

Author*Unverified author*
R Software Modulerwasp_autocorrelation.wasp
Title produced by software(Partial) Autocorrelation Function
Date of computationSat, 28 Dec 2013 08:06:03 -0500
Cite this page as followsStatistical Computations at FreeStatistics.org, Office for Research Development and Education, URL https://freestatistics.org/blog/index.php?v=date/2013/Dec/28/t1388236033coz74sxreyswtvs.htm/, Retrieved Wed, 24 Apr 2024 00:55:32 +0000
Statistical Computations at FreeStatistics.org, Office for Research Development and Education, URL https://freestatistics.org/blog/index.php?pk=232644, Retrieved Wed, 24 Apr 2024 00:55:32 +0000
QR Codes:

Original text written by user:
IsPrivate?No (this computation is public)
User-defined keywords
Estimated Impact143
Family? (F = Feedback message, R = changed R code, M = changed R Module, P = changed Parameters, D = changed Data)
-     [(Partial) Autocorrelation Function] [] [2013-11-18 08:10:54] [9fb2675916b8773bb0a74f31adc60d44]
- R PD    [(Partial) Autocorrelation Function] [] [2013-12-28 13:06:03] [d41d8cd98f00b204e9800998ecf8427e] [Current]
Feedback Forum

Post a new message
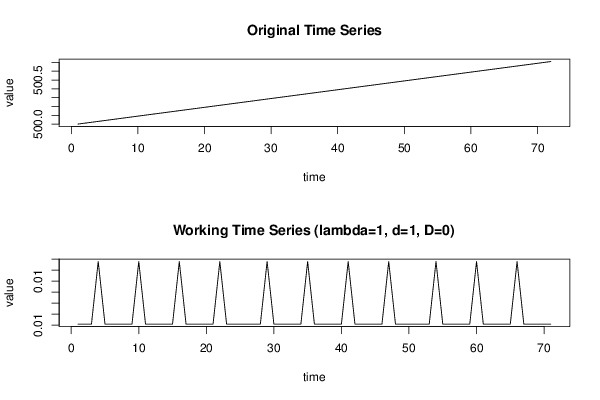
Dataseries X:
500
500.01
500.02
500.03
500.04
500.05
500.06
500.07
500.08
500.09
500.10
500.11
500.12
500.13
500.14
500.15
500.16
500.17
500.18
500.19
500.20
500.21
500.22
500.23
500.24
500.25
500.26
500.27
500.28
500.29
500.30
500.31
500.32
500.33
500.34
500.35
500.36
500.37
500.38
500.39
500.40
500.41
500.42
500.43
500.44
500.45
500.46
500.47
500.48
500.49
500.50
500.51
500.52
500.53
500.54
500.55
500.56
500.57
500.58
500.59
500.60
500.61
500.62
500.63
500.64
500.65
500.66
500.67
500.68
500.69
500.70
500.71


Summary of computational transaction
Raw Inputview raw input (R code)
Raw Outputview raw output of R engine
Computing time3 seconds
R Server'Gertrude Mary Cox' @ cox.wessa.net

\begin{tabular}{lllllllll}
\hline
Summary of computational transaction \tabularnewline
Raw Input & view raw input (R code)  \tabularnewline
Raw Output & view raw output of R engine  \tabularnewline
Computing time & 3 seconds \tabularnewline
R Server & 'Gertrude Mary Cox' @ cox.wessa.net \tabularnewline
\hline
\end{tabular}
%Source: https://freestatistics.org/blog/index.php?pk=232644&T=0

[TABLE]
[ROW][C]Summary of computational transaction[/C][/ROW]
[ROW][C]Raw Input[/C][C]view raw input (R code) [/C][/ROW]
[ROW][C]Raw Output[/C][C]view raw output of R engine [/C][/ROW]
[ROW][C]Computing time[/C][C]3 seconds[/C][/ROW]
[ROW][C]R Server[/C][C]'Gertrude Mary Cox' @ cox.wessa.net[/C][/ROW]
[/TABLE]
Source: https://freestatistics.org/blog/index.php?pk=232644&T=0

Globally Unique Identifier (entire table): ba.freestatistics.org/blog/index.php?pk=232644&T=0

As an alternative you can also use a QR Code:  

The GUIDs for individual cells are displayed in the table below:

Summary of computational transaction
Raw Inputview raw input (R code)
Raw Outputview raw output of R engine
Computing time3 seconds
R Server'Gertrude Mary Cox' @ cox.wessa.net


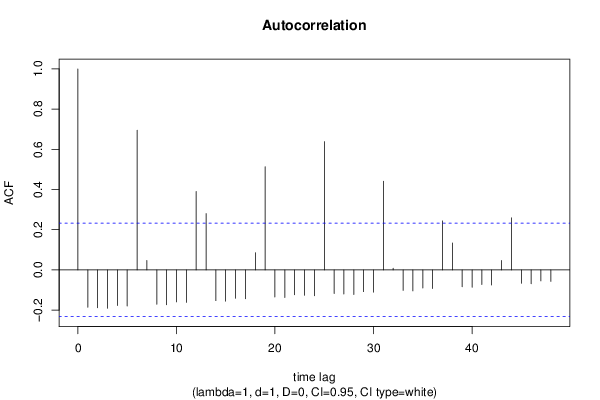
Autocorrelation Function
Time lag kACF(k)T-STATP-value
1-0.185916-1.56660.060833
2-0.188498-1.58830.058329
3-0.191081-1.61010.05591
4-0.176996-1.49140.070144
5-0.179578-1.51320.06734
60.6951135.85710
70.0470760.39670.3464
8-0.170658-1.4380.077415
9-0.17324-1.45970.074385
10-0.159155-1.34110.092087
11-0.161737-1.36280.088622
120.3902263.28810.000785
130.2800682.35990.010516
14-0.152817-1.28770.101023
15-0.1554-1.30940.097307
16-0.141315-1.19070.118861
17-0.143897-1.21250.114671
180.085340.71910.237224
190.513064.32312.5e-05
20-0.134977-1.13730.129611
21-0.137559-1.15910.125151
22-0.123474-1.04040.15084
23-0.126056-1.06220.145879
24-0.128639-1.08390.141031
250.6384775.37990
26-0.117136-0.9870.163495
27-0.119719-1.00880.158256
28-0.122301-1.03050.15313
29-0.108216-0.91180.182468
30-0.110798-0.93360.176836
310.4411663.71730.000199
320.008280.06980.472287
33-0.101878-0.85840.196769
34-0.104461-0.88020.19086
35-0.090375-0.76150.224435
36-0.092958-0.78330.218035
370.2438552.05480.021792
380.1336961.12650.131864
39-0.084038-0.70810.240596
40-0.08662-0.72990.233934
41-0.072535-0.61120.271513
42-0.075117-0.6330.2644
430.0465430.39220.348049
440.2591132.18330.01616
45-0.066197-0.55780.289372
46-0.06878-0.57950.282027
47-0.054694-0.46090.323153
48-0.057277-0.48260.315424

\begin{tabular}{lllllllll}
\hline
Autocorrelation Function \tabularnewline
Time lag k & ACF(k) & T-STAT & P-value \tabularnewline
1 & -0.185916 & -1.5666 & 0.060833 \tabularnewline
2 & -0.188498 & -1.5883 & 0.058329 \tabularnewline
3 & -0.191081 & -1.6101 & 0.05591 \tabularnewline
4 & -0.176996 & -1.4914 & 0.070144 \tabularnewline
5 & -0.179578 & -1.5132 & 0.06734 \tabularnewline
6 & 0.695113 & 5.8571 & 0 \tabularnewline
7 & 0.047076 & 0.3967 & 0.3464 \tabularnewline
8 & -0.170658 & -1.438 & 0.077415 \tabularnewline
9 & -0.17324 & -1.4597 & 0.074385 \tabularnewline
10 & -0.159155 & -1.3411 & 0.092087 \tabularnewline
11 & -0.161737 & -1.3628 & 0.088622 \tabularnewline
12 & 0.390226 & 3.2881 & 0.000785 \tabularnewline
13 & 0.280068 & 2.3599 & 0.010516 \tabularnewline
14 & -0.152817 & -1.2877 & 0.101023 \tabularnewline
15 & -0.1554 & -1.3094 & 0.097307 \tabularnewline
16 & -0.141315 & -1.1907 & 0.118861 \tabularnewline
17 & -0.143897 & -1.2125 & 0.114671 \tabularnewline
18 & 0.08534 & 0.7191 & 0.237224 \tabularnewline
19 & 0.51306 & 4.3231 & 2.5e-05 \tabularnewline
20 & -0.134977 & -1.1373 & 0.129611 \tabularnewline
21 & -0.137559 & -1.1591 & 0.125151 \tabularnewline
22 & -0.123474 & -1.0404 & 0.15084 \tabularnewline
23 & -0.126056 & -1.0622 & 0.145879 \tabularnewline
24 & -0.128639 & -1.0839 & 0.141031 \tabularnewline
25 & 0.638477 & 5.3799 & 0 \tabularnewline
26 & -0.117136 & -0.987 & 0.163495 \tabularnewline
27 & -0.119719 & -1.0088 & 0.158256 \tabularnewline
28 & -0.122301 & -1.0305 & 0.15313 \tabularnewline
29 & -0.108216 & -0.9118 & 0.182468 \tabularnewline
30 & -0.110798 & -0.9336 & 0.176836 \tabularnewline
31 & 0.441166 & 3.7173 & 0.000199 \tabularnewline
32 & 0.00828 & 0.0698 & 0.472287 \tabularnewline
33 & -0.101878 & -0.8584 & 0.196769 \tabularnewline
34 & -0.104461 & -0.8802 & 0.19086 \tabularnewline
35 & -0.090375 & -0.7615 & 0.224435 \tabularnewline
36 & -0.092958 & -0.7833 & 0.218035 \tabularnewline
37 & 0.243855 & 2.0548 & 0.021792 \tabularnewline
38 & 0.133696 & 1.1265 & 0.131864 \tabularnewline
39 & -0.084038 & -0.7081 & 0.240596 \tabularnewline
40 & -0.08662 & -0.7299 & 0.233934 \tabularnewline
41 & -0.072535 & -0.6112 & 0.271513 \tabularnewline
42 & -0.075117 & -0.633 & 0.2644 \tabularnewline
43 & 0.046543 & 0.3922 & 0.348049 \tabularnewline
44 & 0.259113 & 2.1833 & 0.01616 \tabularnewline
45 & -0.066197 & -0.5578 & 0.289372 \tabularnewline
46 & -0.06878 & -0.5795 & 0.282027 \tabularnewline
47 & -0.054694 & -0.4609 & 0.323153 \tabularnewline
48 & -0.057277 & -0.4826 & 0.315424 \tabularnewline
\hline
\end{tabular}
%Source: https://freestatistics.org/blog/index.php?pk=232644&T=1

[TABLE]
[ROW][C]Autocorrelation Function[/C][/ROW]
[ROW][C]Time lag k[/C][C]ACF(k)[/C][C]T-STAT[/C][C]P-value[/C][/ROW]
[ROW][C]1[/C][C]-0.185916[/C][C]-1.5666[/C][C]0.060833[/C][/ROW]
[ROW][C]2[/C][C]-0.188498[/C][C]-1.5883[/C][C]0.058329[/C][/ROW]
[ROW][C]3[/C][C]-0.191081[/C][C]-1.6101[/C][C]0.05591[/C][/ROW]
[ROW][C]4[/C][C]-0.176996[/C][C]-1.4914[/C][C]0.070144[/C][/ROW]
[ROW][C]5[/C][C]-0.179578[/C][C]-1.5132[/C][C]0.06734[/C][/ROW]
[ROW][C]6[/C][C]0.695113[/C][C]5.8571[/C][C]0[/C][/ROW]
[ROW][C]7[/C][C]0.047076[/C][C]0.3967[/C][C]0.3464[/C][/ROW]
[ROW][C]8[/C][C]-0.170658[/C][C]-1.438[/C][C]0.077415[/C][/ROW]
[ROW][C]9[/C][C]-0.17324[/C][C]-1.4597[/C][C]0.074385[/C][/ROW]
[ROW][C]10[/C][C]-0.159155[/C][C]-1.3411[/C][C]0.092087[/C][/ROW]
[ROW][C]11[/C][C]-0.161737[/C][C]-1.3628[/C][C]0.088622[/C][/ROW]
[ROW][C]12[/C][C]0.390226[/C][C]3.2881[/C][C]0.000785[/C][/ROW]
[ROW][C]13[/C][C]0.280068[/C][C]2.3599[/C][C]0.010516[/C][/ROW]
[ROW][C]14[/C][C]-0.152817[/C][C]-1.2877[/C][C]0.101023[/C][/ROW]
[ROW][C]15[/C][C]-0.1554[/C][C]-1.3094[/C][C]0.097307[/C][/ROW]
[ROW][C]16[/C][C]-0.141315[/C][C]-1.1907[/C][C]0.118861[/C][/ROW]
[ROW][C]17[/C][C]-0.143897[/C][C]-1.2125[/C][C]0.114671[/C][/ROW]
[ROW][C]18[/C][C]0.08534[/C][C]0.7191[/C][C]0.237224[/C][/ROW]
[ROW][C]19[/C][C]0.51306[/C][C]4.3231[/C][C]2.5e-05[/C][/ROW]
[ROW][C]20[/C][C]-0.134977[/C][C]-1.1373[/C][C]0.129611[/C][/ROW]
[ROW][C]21[/C][C]-0.137559[/C][C]-1.1591[/C][C]0.125151[/C][/ROW]
[ROW][C]22[/C][C]-0.123474[/C][C]-1.0404[/C][C]0.15084[/C][/ROW]
[ROW][C]23[/C][C]-0.126056[/C][C]-1.0622[/C][C]0.145879[/C][/ROW]
[ROW][C]24[/C][C]-0.128639[/C][C]-1.0839[/C][C]0.141031[/C][/ROW]
[ROW][C]25[/C][C]0.638477[/C][C]5.3799[/C][C]0[/C][/ROW]
[ROW][C]26[/C][C]-0.117136[/C][C]-0.987[/C][C]0.163495[/C][/ROW]
[ROW][C]27[/C][C]-0.119719[/C][C]-1.0088[/C][C]0.158256[/C][/ROW]
[ROW][C]28[/C][C]-0.122301[/C][C]-1.0305[/C][C]0.15313[/C][/ROW]
[ROW][C]29[/C][C]-0.108216[/C][C]-0.9118[/C][C]0.182468[/C][/ROW]
[ROW][C]30[/C][C]-0.110798[/C][C]-0.9336[/C][C]0.176836[/C][/ROW]
[ROW][C]31[/C][C]0.441166[/C][C]3.7173[/C][C]0.000199[/C][/ROW]
[ROW][C]32[/C][C]0.00828[/C][C]0.0698[/C][C]0.472287[/C][/ROW]
[ROW][C]33[/C][C]-0.101878[/C][C]-0.8584[/C][C]0.196769[/C][/ROW]
[ROW][C]34[/C][C]-0.104461[/C][C]-0.8802[/C][C]0.19086[/C][/ROW]
[ROW][C]35[/C][C]-0.090375[/C][C]-0.7615[/C][C]0.224435[/C][/ROW]
[ROW][C]36[/C][C]-0.092958[/C][C]-0.7833[/C][C]0.218035[/C][/ROW]
[ROW][C]37[/C][C]0.243855[/C][C]2.0548[/C][C]0.021792[/C][/ROW]
[ROW][C]38[/C][C]0.133696[/C][C]1.1265[/C][C]0.131864[/C][/ROW]
[ROW][C]39[/C][C]-0.084038[/C][C]-0.7081[/C][C]0.240596[/C][/ROW]
[ROW][C]40[/C][C]-0.08662[/C][C]-0.7299[/C][C]0.233934[/C][/ROW]
[ROW][C]41[/C][C]-0.072535[/C][C]-0.6112[/C][C]0.271513[/C][/ROW]
[ROW][C]42[/C][C]-0.075117[/C][C]-0.633[/C][C]0.2644[/C][/ROW]
[ROW][C]43[/C][C]0.046543[/C][C]0.3922[/C][C]0.348049[/C][/ROW]
[ROW][C]44[/C][C]0.259113[/C][C]2.1833[/C][C]0.01616[/C][/ROW]
[ROW][C]45[/C][C]-0.066197[/C][C]-0.5578[/C][C]0.289372[/C][/ROW]
[ROW][C]46[/C][C]-0.06878[/C][C]-0.5795[/C][C]0.282027[/C][/ROW]
[ROW][C]47[/C][C]-0.054694[/C][C]-0.4609[/C][C]0.323153[/C][/ROW]
[ROW][C]48[/C][C]-0.057277[/C][C]-0.4826[/C][C]0.315424[/C][/ROW]
[/TABLE]
Source: https://freestatistics.org/blog/index.php?pk=232644&T=1

Globally Unique Identifier (entire table): ba.freestatistics.org/blog/index.php?pk=232644&T=1

As an alternative you can also use a QR Code:  

The GUIDs for individual cells are displayed in the table below:

Autocorrelation Function
Time lag kACF(k)T-STATP-value
1-0.185916-1.56660.060833
2-0.188498-1.58830.058329
3-0.191081-1.61010.05591
4-0.176996-1.49140.070144
5-0.179578-1.51320.06734
60.6951135.85710
70.0470760.39670.3464
8-0.170658-1.4380.077415
9-0.17324-1.45970.074385
10-0.159155-1.34110.092087
11-0.161737-1.36280.088622
120.3902263.28810.000785
130.2800682.35990.010516
14-0.152817-1.28770.101023
15-0.1554-1.30940.097307
16-0.141315-1.19070.118861
17-0.143897-1.21250.114671
180.085340.71910.237224
190.513064.32312.5e-05
20-0.134977-1.13730.129611
21-0.137559-1.15910.125151
22-0.123474-1.04040.15084
23-0.126056-1.06220.145879
24-0.128639-1.08390.141031
250.6384775.37990
26-0.117136-0.9870.163495
27-0.119719-1.00880.158256
28-0.122301-1.03050.15313
29-0.108216-0.91180.182468
30-0.110798-0.93360.176836
310.4411663.71730.000199
320.008280.06980.472287
33-0.101878-0.85840.196769
34-0.104461-0.88020.19086
35-0.090375-0.76150.224435
36-0.092958-0.78330.218035
370.2438552.05480.021792
380.1336961.12650.131864
39-0.084038-0.70810.240596
40-0.08662-0.72990.233934
41-0.072535-0.61120.271513
42-0.075117-0.6330.2644
430.0465430.39220.348049
440.2591132.18330.01616
45-0.066197-0.55780.289372
46-0.06878-0.57950.282027
47-0.054694-0.46090.323153
48-0.057277-0.48260.315424


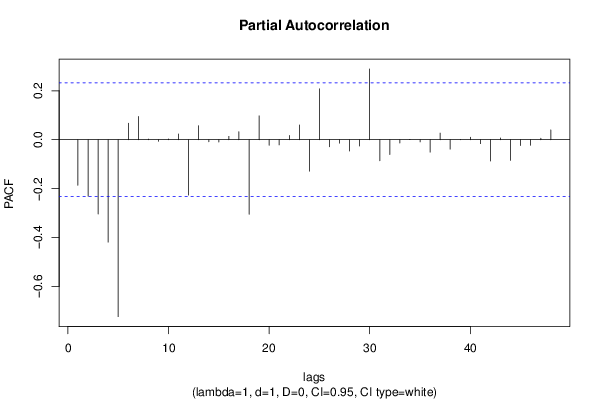
Partial Autocorrelation Function
Time lag kPACF(k)T-STATP-value
1-0.185915-1.56660.060833
2-0.231048-1.94680.027755
3-0.303291-2.55560.006372
4-0.418327-3.52490.000373
5-0.722877-6.09110
60.0676920.57040.285109
70.0947120.79810.213748
80.0024820.02090.491686
9-0.006474-0.05450.478325
100.00270.02270.490957
110.0235930.19880.421493
12-0.22621-1.90610.030344
130.0574450.4840.314925
14-0.008434-0.07110.471771
15-0.009-0.07580.46988
160.0137460.11580.454057
170.0324630.27350.392617
18-0.304347-2.56450.006225
190.0974080.82080.207261
20-0.022294-0.18790.425764
21-0.021164-0.17830.429485
220.0175410.14780.441458
230.0605720.51040.30568
24-0.128345-1.08150.141577
250.2078581.75140.042094
26-0.02881-0.24280.404445
27-0.014-0.1180.453214
28-0.046236-0.38960.349001
29-0.025416-0.21420.415518
300.289222.4370.008659
31-0.085952-0.72420.235649
32-0.06072-0.51160.305247
33-0.013087-0.11030.456254
340.0007660.00650.497434
35-0.008901-0.0750.470212
36-0.050667-0.42690.335361
370.0270990.22830.410021
38-0.038469-0.32410.37339
390.0011370.00960.496191
400.0099960.08420.466556
41-0.015891-0.13390.446932
42-0.087284-0.73550.232239
430.00730.06150.475563
44-0.084271-0.71010.239989
45-0.023363-0.19690.422248
46-0.022605-0.19050.424741
470.0061570.05190.479384
480.0401570.33840.368041

\begin{tabular}{lllllllll}
\hline
Partial Autocorrelation Function \tabularnewline
Time lag k & PACF(k) & T-STAT & P-value \tabularnewline
1 & -0.185915 & -1.5666 & 0.060833 \tabularnewline
2 & -0.231048 & -1.9468 & 0.027755 \tabularnewline
3 & -0.303291 & -2.5556 & 0.006372 \tabularnewline
4 & -0.418327 & -3.5249 & 0.000373 \tabularnewline
5 & -0.722877 & -6.0911 & 0 \tabularnewline
6 & 0.067692 & 0.5704 & 0.285109 \tabularnewline
7 & 0.094712 & 0.7981 & 0.213748 \tabularnewline
8 & 0.002482 & 0.0209 & 0.491686 \tabularnewline
9 & -0.006474 & -0.0545 & 0.478325 \tabularnewline
10 & 0.0027 & 0.0227 & 0.490957 \tabularnewline
11 & 0.023593 & 0.1988 & 0.421493 \tabularnewline
12 & -0.22621 & -1.9061 & 0.030344 \tabularnewline
13 & 0.057445 & 0.484 & 0.314925 \tabularnewline
14 & -0.008434 & -0.0711 & 0.471771 \tabularnewline
15 & -0.009 & -0.0758 & 0.46988 \tabularnewline
16 & 0.013746 & 0.1158 & 0.454057 \tabularnewline
17 & 0.032463 & 0.2735 & 0.392617 \tabularnewline
18 & -0.304347 & -2.5645 & 0.006225 \tabularnewline
19 & 0.097408 & 0.8208 & 0.207261 \tabularnewline
20 & -0.022294 & -0.1879 & 0.425764 \tabularnewline
21 & -0.021164 & -0.1783 & 0.429485 \tabularnewline
22 & 0.017541 & 0.1478 & 0.441458 \tabularnewline
23 & 0.060572 & 0.5104 & 0.30568 \tabularnewline
24 & -0.128345 & -1.0815 & 0.141577 \tabularnewline
25 & 0.207858 & 1.7514 & 0.042094 \tabularnewline
26 & -0.02881 & -0.2428 & 0.404445 \tabularnewline
27 & -0.014 & -0.118 & 0.453214 \tabularnewline
28 & -0.046236 & -0.3896 & 0.349001 \tabularnewline
29 & -0.025416 & -0.2142 & 0.415518 \tabularnewline
30 & 0.28922 & 2.437 & 0.008659 \tabularnewline
31 & -0.085952 & -0.7242 & 0.235649 \tabularnewline
32 & -0.06072 & -0.5116 & 0.305247 \tabularnewline
33 & -0.013087 & -0.1103 & 0.456254 \tabularnewline
34 & 0.000766 & 0.0065 & 0.497434 \tabularnewline
35 & -0.008901 & -0.075 & 0.470212 \tabularnewline
36 & -0.050667 & -0.4269 & 0.335361 \tabularnewline
37 & 0.027099 & 0.2283 & 0.410021 \tabularnewline
38 & -0.038469 & -0.3241 & 0.37339 \tabularnewline
39 & 0.001137 & 0.0096 & 0.496191 \tabularnewline
40 & 0.009996 & 0.0842 & 0.466556 \tabularnewline
41 & -0.015891 & -0.1339 & 0.446932 \tabularnewline
42 & -0.087284 & -0.7355 & 0.232239 \tabularnewline
43 & 0.0073 & 0.0615 & 0.475563 \tabularnewline
44 & -0.084271 & -0.7101 & 0.239989 \tabularnewline
45 & -0.023363 & -0.1969 & 0.422248 \tabularnewline
46 & -0.022605 & -0.1905 & 0.424741 \tabularnewline
47 & 0.006157 & 0.0519 & 0.479384 \tabularnewline
48 & 0.040157 & 0.3384 & 0.368041 \tabularnewline
\hline
\end{tabular}
%Source: https://freestatistics.org/blog/index.php?pk=232644&T=2

[TABLE]
[ROW][C]Partial Autocorrelation Function[/C][/ROW]
[ROW][C]Time lag k[/C][C]PACF(k)[/C][C]T-STAT[/C][C]P-value[/C][/ROW]
[ROW][C]1[/C][C]-0.185915[/C][C]-1.5666[/C][C]0.060833[/C][/ROW]
[ROW][C]2[/C][C]-0.231048[/C][C]-1.9468[/C][C]0.027755[/C][/ROW]
[ROW][C]3[/C][C]-0.303291[/C][C]-2.5556[/C][C]0.006372[/C][/ROW]
[ROW][C]4[/C][C]-0.418327[/C][C]-3.5249[/C][C]0.000373[/C][/ROW]
[ROW][C]5[/C][C]-0.722877[/C][C]-6.0911[/C][C]0[/C][/ROW]
[ROW][C]6[/C][C]0.067692[/C][C]0.5704[/C][C]0.285109[/C][/ROW]
[ROW][C]7[/C][C]0.094712[/C][C]0.7981[/C][C]0.213748[/C][/ROW]
[ROW][C]8[/C][C]0.002482[/C][C]0.0209[/C][C]0.491686[/C][/ROW]
[ROW][C]9[/C][C]-0.006474[/C][C]-0.0545[/C][C]0.478325[/C][/ROW]
[ROW][C]10[/C][C]0.0027[/C][C]0.0227[/C][C]0.490957[/C][/ROW]
[ROW][C]11[/C][C]0.023593[/C][C]0.1988[/C][C]0.421493[/C][/ROW]
[ROW][C]12[/C][C]-0.22621[/C][C]-1.9061[/C][C]0.030344[/C][/ROW]
[ROW][C]13[/C][C]0.057445[/C][C]0.484[/C][C]0.314925[/C][/ROW]
[ROW][C]14[/C][C]-0.008434[/C][C]-0.0711[/C][C]0.471771[/C][/ROW]
[ROW][C]15[/C][C]-0.009[/C][C]-0.0758[/C][C]0.46988[/C][/ROW]
[ROW][C]16[/C][C]0.013746[/C][C]0.1158[/C][C]0.454057[/C][/ROW]
[ROW][C]17[/C][C]0.032463[/C][C]0.2735[/C][C]0.392617[/C][/ROW]
[ROW][C]18[/C][C]-0.304347[/C][C]-2.5645[/C][C]0.006225[/C][/ROW]
[ROW][C]19[/C][C]0.097408[/C][C]0.8208[/C][C]0.207261[/C][/ROW]
[ROW][C]20[/C][C]-0.022294[/C][C]-0.1879[/C][C]0.425764[/C][/ROW]
[ROW][C]21[/C][C]-0.021164[/C][C]-0.1783[/C][C]0.429485[/C][/ROW]
[ROW][C]22[/C][C]0.017541[/C][C]0.1478[/C][C]0.441458[/C][/ROW]
[ROW][C]23[/C][C]0.060572[/C][C]0.5104[/C][C]0.30568[/C][/ROW]
[ROW][C]24[/C][C]-0.128345[/C][C]-1.0815[/C][C]0.141577[/C][/ROW]
[ROW][C]25[/C][C]0.207858[/C][C]1.7514[/C][C]0.042094[/C][/ROW]
[ROW][C]26[/C][C]-0.02881[/C][C]-0.2428[/C][C]0.404445[/C][/ROW]
[ROW][C]27[/C][C]-0.014[/C][C]-0.118[/C][C]0.453214[/C][/ROW]
[ROW][C]28[/C][C]-0.046236[/C][C]-0.3896[/C][C]0.349001[/C][/ROW]
[ROW][C]29[/C][C]-0.025416[/C][C]-0.2142[/C][C]0.415518[/C][/ROW]
[ROW][C]30[/C][C]0.28922[/C][C]2.437[/C][C]0.008659[/C][/ROW]
[ROW][C]31[/C][C]-0.085952[/C][C]-0.7242[/C][C]0.235649[/C][/ROW]
[ROW][C]32[/C][C]-0.06072[/C][C]-0.5116[/C][C]0.305247[/C][/ROW]
[ROW][C]33[/C][C]-0.013087[/C][C]-0.1103[/C][C]0.456254[/C][/ROW]
[ROW][C]34[/C][C]0.000766[/C][C]0.0065[/C][C]0.497434[/C][/ROW]
[ROW][C]35[/C][C]-0.008901[/C][C]-0.075[/C][C]0.470212[/C][/ROW]
[ROW][C]36[/C][C]-0.050667[/C][C]-0.4269[/C][C]0.335361[/C][/ROW]
[ROW][C]37[/C][C]0.027099[/C][C]0.2283[/C][C]0.410021[/C][/ROW]
[ROW][C]38[/C][C]-0.038469[/C][C]-0.3241[/C][C]0.37339[/C][/ROW]
[ROW][C]39[/C][C]0.001137[/C][C]0.0096[/C][C]0.496191[/C][/ROW]
[ROW][C]40[/C][C]0.009996[/C][C]0.0842[/C][C]0.466556[/C][/ROW]
[ROW][C]41[/C][C]-0.015891[/C][C]-0.1339[/C][C]0.446932[/C][/ROW]
[ROW][C]42[/C][C]-0.087284[/C][C]-0.7355[/C][C]0.232239[/C][/ROW]
[ROW][C]43[/C][C]0.0073[/C][C]0.0615[/C][C]0.475563[/C][/ROW]
[ROW][C]44[/C][C]-0.084271[/C][C]-0.7101[/C][C]0.239989[/C][/ROW]
[ROW][C]45[/C][C]-0.023363[/C][C]-0.1969[/C][C]0.422248[/C][/ROW]
[ROW][C]46[/C][C]-0.022605[/C][C]-0.1905[/C][C]0.424741[/C][/ROW]
[ROW][C]47[/C][C]0.006157[/C][C]0.0519[/C][C]0.479384[/C][/ROW]
[ROW][C]48[/C][C]0.040157[/C][C]0.3384[/C][C]0.368041[/C][/ROW]
[/TABLE]
Source: https://freestatistics.org/blog/index.php?pk=232644&T=2

Globally Unique Identifier (entire table): ba.freestatistics.org/blog/index.php?pk=232644&T=2

As an alternative you can also use a QR Code:  

The GUIDs for individual cells are displayed in the table below:

Partial Autocorrelation Function
Time lag kPACF(k)T-STATP-value
1-0.185915-1.56660.060833
2-0.231048-1.94680.027755
3-0.303291-2.55560.006372
4-0.418327-3.52490.000373
5-0.722877-6.09110
60.0676920.57040.285109
70.0947120.79810.213748
80.0024820.02090.491686
9-0.006474-0.05450.478325
100.00270.02270.490957
110.0235930.19880.421493
12-0.22621-1.90610.030344
130.0574450.4840.314925
14-0.008434-0.07110.471771
15-0.009-0.07580.46988
160.0137460.11580.454057
170.0324630.27350.392617
18-0.304347-2.56450.006225
190.0974080.82080.207261
20-0.022294-0.18790.425764
21-0.021164-0.17830.429485
220.0175410.14780.441458
230.0605720.51040.30568
24-0.128345-1.08150.141577
250.2078581.75140.042094
26-0.02881-0.24280.404445
27-0.014-0.1180.453214
28-0.046236-0.38960.349001
29-0.025416-0.21420.415518
300.289222.4370.008659
31-0.085952-0.72420.235649
32-0.06072-0.51160.305247
33-0.013087-0.11030.456254
340.0007660.00650.497434
35-0.008901-0.0750.470212
36-0.050667-0.42690.335361
370.0270990.22830.410021
38-0.038469-0.32410.37339
390.0011370.00960.496191
400.0099960.08420.466556
41-0.015891-0.13390.446932
42-0.087284-0.73550.232239
430.00730.06150.475563
44-0.084271-0.71010.239989
45-0.023363-0.19690.422248
46-0.022605-0.19050.424741
470.0061570.05190.479384
480.0401570.33840.368041


Parameters (Session):
par1 = 48 ; par2 = 1 ; par3 = 1 ; par4 = 0 ; par5 = 12 ; par6 = White Noise ; par7 = 0.95 ;
Parameters (R input):
par1 = 48 ; par2 = 1 ; par3 = 1 ; par4 = 0 ; par5 = 12 ; par6 = White Noise ; par7 = 0.95 ; par8 = ;
R code (references can be found in the software module):
if (par1 == 'Default') {
par1 = 10*log10(length(x))
} else {
par1 <- as.numeric(par1)
}
par2 <- as.numeric(par2)
par3 <- as.numeric(par3)
par4 <- as.numeric(par4)
par5 <- as.numeric(par5)
if (par6 == 'White Noise') par6 <- 'white' else par6 <- 'ma'
par7 <- as.numeric(par7)
if (par8 != '') par8 <- as.numeric(par8)
ox <- x
if (par8 == '') {
if (par2 == 0) {
x <- log(x)
} else {
x <- (x ^ par2 - 1) / par2
}
} else {
x <- log(x,base=par8)
}
if (par3 > 0) x <- diff(x,lag=1,difference=par3)
if (par4 > 0) x <- diff(x,lag=par5,difference=par4)
bitmap(file='picts.png')
op <- par(mfrow=c(2,1))
plot(ox,type='l',main='Original Time Series',xlab='time',ylab='value')
if (par8=='') {
mytitle <- paste('Working Time Series (lambda=',par2,', d=',par3,', D=',par4,')',sep='')
mysub <- paste('(lambda=',par2,', d=',par3,', D=',par4,', CI=', par7, ', CI type=',par6,')',sep='')
} else {
mytitle <- paste('Working Time Series (base=',par8,', d=',par3,', D=',par4,')',sep='')
mysub <- paste('(base=',par8,', d=',par3,', D=',par4,', CI=', par7, ', CI type=',par6,')',sep='')
}
plot(x,type='l', main=mytitle,xlab='time',ylab='value')
par(op)
dev.off()
bitmap(file='pic1.png')
racf <- acf(x, par1, main='Autocorrelation', xlab='time lag', ylab='ACF', ci.type=par6, ci=par7, sub=mysub)
dev.off()
bitmap(file='pic2.png')
rpacf <- pacf(x,par1,main='Partial Autocorrelation',xlab='lags',ylab='PACF',sub=mysub)
dev.off()
(myacf <- c(racf$acf))
(mypacf <- c(rpacf$acf))
lengthx <- length(x)
sqrtn <- sqrt(lengthx)
load(file='createtable')
a<-table.start()
a<-table.row.start(a)
a<-table.element(a,'Autocorrelation Function',4,TRUE)
a<-table.row.end(a)
a<-table.row.start(a)
a<-table.element(a,'Time lag k',header=TRUE)
a<-table.element(a,hyperlink('basics.htm','ACF(k)','click here for more information about the Autocorrelation Function'),header=TRUE)
a<-table.element(a,'T-STAT',header=TRUE)
a<-table.element(a,'P-value',header=TRUE)
a<-table.row.end(a)
for (i in 2:(par1+1)) {
a<-table.row.start(a)
a<-table.element(a,i-1,header=TRUE)
a<-table.element(a,round(myacf[i],6))
mytstat <- myacf[i]*sqrtn
a<-table.element(a,round(mytstat,4))
a<-table.element(a,round(1-pt(abs(mytstat),lengthx),6))
a<-table.row.end(a)
}
a<-table.end(a)
table.save(a,file='mytable.tab')
a<-table.start()
a<-table.row.start(a)
a<-table.element(a,'Partial Autocorrelation Function',4,TRUE)
a<-table.row.end(a)
a<-table.row.start(a)
a<-table.element(a,'Time lag k',header=TRUE)
a<-table.element(a,hyperlink('basics.htm','PACF(k)','click here for more information about the Partial Autocorrelation Function'),header=TRUE)
a<-table.element(a,'T-STAT',header=TRUE)
a<-table.element(a,'P-value',header=TRUE)
a<-table.row.end(a)
for (i in 1:par1) {
a<-table.row.start(a)
a<-table.element(a,i,header=TRUE)
a<-table.element(a,round(mypacf[i],6))
mytstat <- mypacf[i]*sqrtn
a<-table.element(a,round(mytstat,4))
a<-table.element(a,round(1-pt(abs(mytstat),lengthx),6))
a<-table.row.end(a)
}
a<-table.end(a)
table.save(a,file='mytable1.tab')