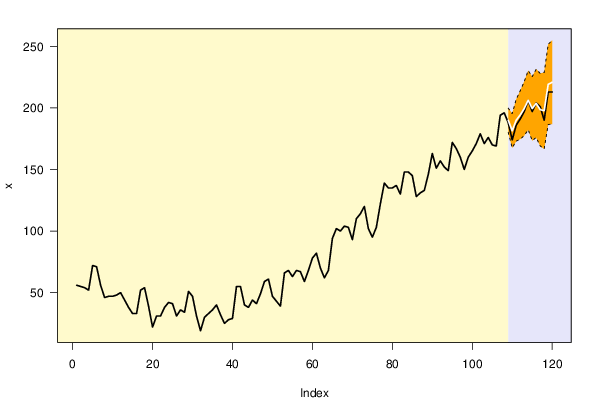
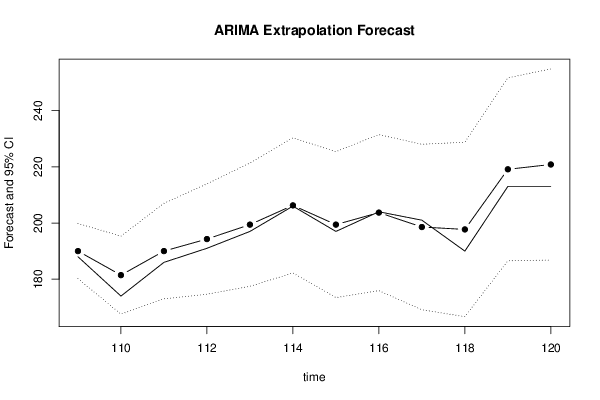
| Univariate ARIMA Extrapolation Forecast | ||||||||
| time | Y[t] | F[t] | 95% LB | 95% UB | p-value (H0: Y[t] = F[t]) | P(F[t]>Y[t-1]) | P(F[t]>Y[t-s]) | P(F[t]>Y[108]) |
| 96 | 167 | - | - | - | - | - | - | - |
| 97 | 160 | - | - | - | - | - | - | - |
| 98 | 150 | - | - | - | - | - | - | - |
| 99 | 160 | - | - | - | - | - | - | - |
| 100 | 165 | - | - | - | - | - | - | - |
| 101 | 171 | - | - | - | - | - | - | - |
| 102 | 179 | - | - | - | - | - | - | - |
| 103 | 171 | - | - | - | - | - | - | - |
| 104 | 176 | - | - | - | - | - | - | - |
| 105 | 170 | - | - | - | - | - | - | - |
| 106 | 169 | - | - | - | - | - | - | - |
| 107 | 194 | - | - | - | - | - | - | - |
| 108 | 196 | - | - | - | - | - | - | - |
| 109 | 188 | 190.01 | 180.1974 | 199.8227 | 0.344 | 0.1158 | 1 | 0.1158 |
| 110 | 174 | 181.4529 | 167.5757 | 195.3301 | 0.1463 | 0.1776 | 1 | 0.02 |
| 111 | 186 | 190.01 | 173.014 | 207.006 | 0.3219 | 0.9676 | 0.9997 | 0.2449 |
| 112 | 191 | 194.2886 | 174.6633 | 213.9139 | 0.3713 | 0.7961 | 0.9983 | 0.4321 |
| 113 | 197 | 199.4228 | 177.4811 | 221.3646 | 0.4143 | 0.7741 | 0.9944 | 0.6201 |
| 114 | 206 | 206.2685 | 182.2325 | 230.3046 | 0.4913 | 0.7751 | 0.9869 | 0.7988 |
| 115 | 197 | 199.4228 | 173.461 | 225.3847 | 0.4274 | 0.3098 | 0.9841 | 0.602 |
| 116 | 204 | 203.7014 | 175.947 | 231.4558 | 0.4916 | 0.682 | 0.9748 | 0.7067 |
| 117 | 201 | 198.5671 | 169.1292 | 228.0051 | 0.4357 | 0.3588 | 0.9714 | 0.5679 |
| 118 | 190 | 197.7114 | 166.6811 | 228.7418 | 0.3131 | 0.4177 | 0.9651 | 0.543 |
| 119 | 213 | 219.1042 | 186.5593 | 251.6491 | 0.3566 | 0.9602 | 0.9347 | 0.918 |
| 120 | 213 | 220.8157 | 186.8236 | 254.8077 | 0.3261 | 0.6739 | 0.9238 | 0.9238 |
| Univariate ARIMA Extrapolation Forecast Performance | |||||||||
| time | % S.E. | PE | MAPE | sMAPE | Sq.E | MSE | RMSE | ScaledE | MASE |
| 109 | 0.0263 | -0.0107 | 0.0107 | 0.0106 | 4.0402 | 0 | 0 | -0.2233 | 0.2233 |
| 110 | 0.039 | -0.0428 | 0.0268 | 0.0263 | 55.5456 | 29.7929 | 5.4583 | -0.8281 | 0.5257 |
| 111 | 0.0456 | -0.0216 | 0.025 | 0.0246 | 16.0802 | 25.222 | 5.0221 | -0.4456 | 0.499 |
| 112 | 0.0515 | -0.0172 | 0.0231 | 0.0227 | 10.8147 | 21.6202 | 4.6497 | -0.3654 | 0.4656 |
| 113 | 0.0561 | -0.0123 | 0.0209 | 0.0206 | 5.8702 | 18.4702 | 4.2977 | -0.2692 | 0.4263 |
| 114 | 0.0595 | -0.0013 | 0.0177 | 0.0174 | 0.0721 | 15.4038 | 3.9248 | -0.0298 | 0.3602 |
| 115 | 0.0664 | -0.0123 | 0.0169 | 0.0167 | 5.8702 | 14.0419 | 3.7472 | -0.2692 | 0.3472 |
| 116 | 0.0695 | 0.0015 | 0.015 | 0.0148 | 0.0892 | 12.2978 | 3.5068 | 0.0332 | 0.308 |
| 117 | 0.0756 | 0.0121 | 0.0146 | 0.0145 | 5.9188 | 11.589 | 3.4043 | 0.2703 | 0.3038 |
| 118 | 0.0801 | -0.0406 | 0.0172 | 0.017 | 59.4661 | 16.3767 | 4.0468 | -0.8568 | 0.3591 |
| 119 | 0.0758 | -0.0287 | 0.0183 | 0.018 | 37.2617 | 18.2754 | 4.275 | -0.6782 | 0.3881 |
| 120 | 0.0785 | -0.0367 | 0.0198 | 0.0195 | 61.0845 | 21.8428 | 4.6736 | -0.8684 | 0.4281 |