Free Statistics

of Irreproducible Research!

Author's title

Author*The author of this computation has been verified*
R Software Modulerwasp_autocorrelation.wasp
Title produced by software(Partial) Autocorrelation Function
Date of computationFri, 20 Dec 2013 11:06:11 -0500
Cite this page as followsStatistical Computations at FreeStatistics.org, Office for Research Development and Education, URL https://freestatistics.org/blog/index.php?v=date/2013/Dec/20/t1387555581p6vqh4c2l2s7oz7.htm/, Retrieved Sat, 20 Apr 2024 12:03:20 +0000
Statistical Computations at FreeStatistics.org, Office for Research Development and Education, URL https://freestatistics.org/blog/index.php?pk=232464, Retrieved Sat, 20 Apr 2024 12:03:20 +0000
QR Codes:

Original text written by user:
IsPrivate?No (this computation is public)
User-defined keywords
Estimated Impact139
Family? (F = Feedback message, R = changed R code, M = changed R Module, P = changed Parameters, D = changed Data)
-       [(Partial) Autocorrelation Function] [] [2013-12-20 16:06:11] [9e6a405f514733ea23d87e4507d39d29] [Current]
Feedback Forum

Post a new message
Dataseries X:
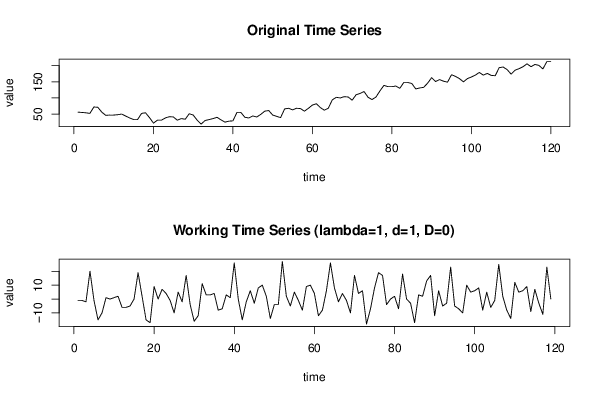
56
55
54
52
72
71
56
46
47
47
48
50
44
38
33
33
52
54
39
22
31
31
38
42
41
31
36
34
51
47
31
19
30
33
36
40
32
25
28
29
55
55
40
38
44
41
49
59
61
47
43
39
66
68
63
68
67
59
68
78
82
70
62
68
94
102
100
104
103
93
110
114
120
102
95
103
122
139
135
135
137
130
148
148
145
128
131
133
146
163
151
157
152
149
172
167
160
150
160
165
171
179
171
176
170
169
194
196
188
174
186
191
197
206
197
204
201
190
213
213


Summary of computational transaction
Raw Inputview raw input (R code)
Raw Outputview raw output of R engine
Computing time4 seconds
R Server'Gwilym Jenkins' @ jenkins.wessa.net

\begin{tabular}{lllllllll}
\hline
Summary of computational transaction \tabularnewline
Raw Input & view raw input (R code)  \tabularnewline
Raw Output & view raw output of R engine  \tabularnewline
Computing time & 4 seconds \tabularnewline
R Server & 'Gwilym Jenkins' @ jenkins.wessa.net \tabularnewline
\hline
\end{tabular}
%Source: https://freestatistics.org/blog/index.php?pk=232464&T=0

[TABLE]
[ROW][C]Summary of computational transaction[/C][/ROW]
[ROW][C]Raw Input[/C][C]view raw input (R code) [/C][/ROW]
[ROW][C]Raw Output[/C][C]view raw output of R engine [/C][/ROW]
[ROW][C]Computing time[/C][C]4 seconds[/C][/ROW]
[ROW][C]R Server[/C][C]'Gwilym Jenkins' @ jenkins.wessa.net[/C][/ROW]
[/TABLE]
Source: https://freestatistics.org/blog/index.php?pk=232464&T=0

Globally Unique Identifier (entire table): ba.freestatistics.org/blog/index.php?pk=232464&T=0

As an alternative you can also use a QR Code:  

The GUIDs for individual cells are displayed in the table below:

Summary of computational transaction
Raw Inputview raw input (R code)
Raw Outputview raw output of R engine
Computing time4 seconds
R Server'Gwilym Jenkins' @ jenkins.wessa.net


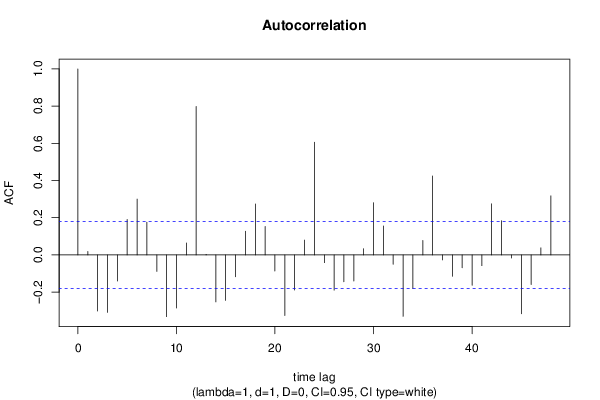
Autocorrelation Function
Time lag kACF(k)T-STATP-value
10.018190.19840.421524
2-0.301552-3.28950.00066
3-0.309156-3.37250.000503
4-0.140527-1.5330.063968
50.190592.07910.019879
60.3002893.27580.00069
70.1757381.91710.028813
8-0.08854-0.96590.168037
9-0.331935-3.6210.000216
10-0.285889-3.11870.001139
110.0644480.7030.241699
120.7983028.70840
130.0031080.03390.486505
14-0.252634-2.75590.003387
15-0.244529-2.66750.004353
16-0.117384-1.28050.101429
170.1271981.38760.08393
180.2734192.98270.001734
190.1525461.66410.049363
20-0.086777-0.94660.172874
21-0.325868-3.55480.000272
22-0.188686-2.05830.020871
230.0797170.86960.193133
240.60566.60630
25-0.041588-0.45370.325447
26-0.189372-2.06580.020509
27-0.144712-1.57860.058539
28-0.139904-1.52620.06481
290.032880.35870.360238
300.2804263.05910.001372
310.1558681.70030.045842
32-0.04995-0.54490.293424
33-0.330336-3.60350.00023
34-0.180369-1.96760.02572
350.0772560.84280.200526
360.4242264.62785e-06
37-0.026538-0.28950.386353
38-0.115171-1.25640.105721
39-0.068635-0.74870.227753
40-0.162793-1.77590.039156
41-0.057507-0.62730.265822
420.2746872.99650.001662
430.1834952.00170.023796
44-0.016835-0.18360.427302
45-0.316502-3.45260.000385
46-0.159468-1.73960.042258
470.0379610.41410.339772
480.3174093.46250.000372

\begin{tabular}{lllllllll}
\hline
Autocorrelation Function \tabularnewline
Time lag k & ACF(k) & T-STAT & P-value \tabularnewline
1 & 0.01819 & 0.1984 & 0.421524 \tabularnewline
2 & -0.301552 & -3.2895 & 0.00066 \tabularnewline
3 & -0.309156 & -3.3725 & 0.000503 \tabularnewline
4 & -0.140527 & -1.533 & 0.063968 \tabularnewline
5 & 0.19059 & 2.0791 & 0.019879 \tabularnewline
6 & 0.300289 & 3.2758 & 0.00069 \tabularnewline
7 & 0.175738 & 1.9171 & 0.028813 \tabularnewline
8 & -0.08854 & -0.9659 & 0.168037 \tabularnewline
9 & -0.331935 & -3.621 & 0.000216 \tabularnewline
10 & -0.285889 & -3.1187 & 0.001139 \tabularnewline
11 & 0.064448 & 0.703 & 0.241699 \tabularnewline
12 & 0.798302 & 8.7084 & 0 \tabularnewline
13 & 0.003108 & 0.0339 & 0.486505 \tabularnewline
14 & -0.252634 & -2.7559 & 0.003387 \tabularnewline
15 & -0.244529 & -2.6675 & 0.004353 \tabularnewline
16 & -0.117384 & -1.2805 & 0.101429 \tabularnewline
17 & 0.127198 & 1.3876 & 0.08393 \tabularnewline
18 & 0.273419 & 2.9827 & 0.001734 \tabularnewline
19 & 0.152546 & 1.6641 & 0.049363 \tabularnewline
20 & -0.086777 & -0.9466 & 0.172874 \tabularnewline
21 & -0.325868 & -3.5548 & 0.000272 \tabularnewline
22 & -0.188686 & -2.0583 & 0.020871 \tabularnewline
23 & 0.079717 & 0.8696 & 0.193133 \tabularnewline
24 & 0.6056 & 6.6063 & 0 \tabularnewline
25 & -0.041588 & -0.4537 & 0.325447 \tabularnewline
26 & -0.189372 & -2.0658 & 0.020509 \tabularnewline
27 & -0.144712 & -1.5786 & 0.058539 \tabularnewline
28 & -0.139904 & -1.5262 & 0.06481 \tabularnewline
29 & 0.03288 & 0.3587 & 0.360238 \tabularnewline
30 & 0.280426 & 3.0591 & 0.001372 \tabularnewline
31 & 0.155868 & 1.7003 & 0.045842 \tabularnewline
32 & -0.04995 & -0.5449 & 0.293424 \tabularnewline
33 & -0.330336 & -3.6035 & 0.00023 \tabularnewline
34 & -0.180369 & -1.9676 & 0.02572 \tabularnewline
35 & 0.077256 & 0.8428 & 0.200526 \tabularnewline
36 & 0.424226 & 4.6278 & 5e-06 \tabularnewline
37 & -0.026538 & -0.2895 & 0.386353 \tabularnewline
38 & -0.115171 & -1.2564 & 0.105721 \tabularnewline
39 & -0.068635 & -0.7487 & 0.227753 \tabularnewline
40 & -0.162793 & -1.7759 & 0.039156 \tabularnewline
41 & -0.057507 & -0.6273 & 0.265822 \tabularnewline
42 & 0.274687 & 2.9965 & 0.001662 \tabularnewline
43 & 0.183495 & 2.0017 & 0.023796 \tabularnewline
44 & -0.016835 & -0.1836 & 0.427302 \tabularnewline
45 & -0.316502 & -3.4526 & 0.000385 \tabularnewline
46 & -0.159468 & -1.7396 & 0.042258 \tabularnewline
47 & 0.037961 & 0.4141 & 0.339772 \tabularnewline
48 & 0.317409 & 3.4625 & 0.000372 \tabularnewline
\hline
\end{tabular}
%Source: https://freestatistics.org/blog/index.php?pk=232464&T=1

[TABLE]
[ROW][C]Autocorrelation Function[/C][/ROW]
[ROW][C]Time lag k[/C][C]ACF(k)[/C][C]T-STAT[/C][C]P-value[/C][/ROW]
[ROW][C]1[/C][C]0.01819[/C][C]0.1984[/C][C]0.421524[/C][/ROW]
[ROW][C]2[/C][C]-0.301552[/C][C]-3.2895[/C][C]0.00066[/C][/ROW]
[ROW][C]3[/C][C]-0.309156[/C][C]-3.3725[/C][C]0.000503[/C][/ROW]
[ROW][C]4[/C][C]-0.140527[/C][C]-1.533[/C][C]0.063968[/C][/ROW]
[ROW][C]5[/C][C]0.19059[/C][C]2.0791[/C][C]0.019879[/C][/ROW]
[ROW][C]6[/C][C]0.300289[/C][C]3.2758[/C][C]0.00069[/C][/ROW]
[ROW][C]7[/C][C]0.175738[/C][C]1.9171[/C][C]0.028813[/C][/ROW]
[ROW][C]8[/C][C]-0.08854[/C][C]-0.9659[/C][C]0.168037[/C][/ROW]
[ROW][C]9[/C][C]-0.331935[/C][C]-3.621[/C][C]0.000216[/C][/ROW]
[ROW][C]10[/C][C]-0.285889[/C][C]-3.1187[/C][C]0.001139[/C][/ROW]
[ROW][C]11[/C][C]0.064448[/C][C]0.703[/C][C]0.241699[/C][/ROW]
[ROW][C]12[/C][C]0.798302[/C][C]8.7084[/C][C]0[/C][/ROW]
[ROW][C]13[/C][C]0.003108[/C][C]0.0339[/C][C]0.486505[/C][/ROW]
[ROW][C]14[/C][C]-0.252634[/C][C]-2.7559[/C][C]0.003387[/C][/ROW]
[ROW][C]15[/C][C]-0.244529[/C][C]-2.6675[/C][C]0.004353[/C][/ROW]
[ROW][C]16[/C][C]-0.117384[/C][C]-1.2805[/C][C]0.101429[/C][/ROW]
[ROW][C]17[/C][C]0.127198[/C][C]1.3876[/C][C]0.08393[/C][/ROW]
[ROW][C]18[/C][C]0.273419[/C][C]2.9827[/C][C]0.001734[/C][/ROW]
[ROW][C]19[/C][C]0.152546[/C][C]1.6641[/C][C]0.049363[/C][/ROW]
[ROW][C]20[/C][C]-0.086777[/C][C]-0.9466[/C][C]0.172874[/C][/ROW]
[ROW][C]21[/C][C]-0.325868[/C][C]-3.5548[/C][C]0.000272[/C][/ROW]
[ROW][C]22[/C][C]-0.188686[/C][C]-2.0583[/C][C]0.020871[/C][/ROW]
[ROW][C]23[/C][C]0.079717[/C][C]0.8696[/C][C]0.193133[/C][/ROW]
[ROW][C]24[/C][C]0.6056[/C][C]6.6063[/C][C]0[/C][/ROW]
[ROW][C]25[/C][C]-0.041588[/C][C]-0.4537[/C][C]0.325447[/C][/ROW]
[ROW][C]26[/C][C]-0.189372[/C][C]-2.0658[/C][C]0.020509[/C][/ROW]
[ROW][C]27[/C][C]-0.144712[/C][C]-1.5786[/C][C]0.058539[/C][/ROW]
[ROW][C]28[/C][C]-0.139904[/C][C]-1.5262[/C][C]0.06481[/C][/ROW]
[ROW][C]29[/C][C]0.03288[/C][C]0.3587[/C][C]0.360238[/C][/ROW]
[ROW][C]30[/C][C]0.280426[/C][C]3.0591[/C][C]0.001372[/C][/ROW]
[ROW][C]31[/C][C]0.155868[/C][C]1.7003[/C][C]0.045842[/C][/ROW]
[ROW][C]32[/C][C]-0.04995[/C][C]-0.5449[/C][C]0.293424[/C][/ROW]
[ROW][C]33[/C][C]-0.330336[/C][C]-3.6035[/C][C]0.00023[/C][/ROW]
[ROW][C]34[/C][C]-0.180369[/C][C]-1.9676[/C][C]0.02572[/C][/ROW]
[ROW][C]35[/C][C]0.077256[/C][C]0.8428[/C][C]0.200526[/C][/ROW]
[ROW][C]36[/C][C]0.424226[/C][C]4.6278[/C][C]5e-06[/C][/ROW]
[ROW][C]37[/C][C]-0.026538[/C][C]-0.2895[/C][C]0.386353[/C][/ROW]
[ROW][C]38[/C][C]-0.115171[/C][C]-1.2564[/C][C]0.105721[/C][/ROW]
[ROW][C]39[/C][C]-0.068635[/C][C]-0.7487[/C][C]0.227753[/C][/ROW]
[ROW][C]40[/C][C]-0.162793[/C][C]-1.7759[/C][C]0.039156[/C][/ROW]
[ROW][C]41[/C][C]-0.057507[/C][C]-0.6273[/C][C]0.265822[/C][/ROW]
[ROW][C]42[/C][C]0.274687[/C][C]2.9965[/C][C]0.001662[/C][/ROW]
[ROW][C]43[/C][C]0.183495[/C][C]2.0017[/C][C]0.023796[/C][/ROW]
[ROW][C]44[/C][C]-0.016835[/C][C]-0.1836[/C][C]0.427302[/C][/ROW]
[ROW][C]45[/C][C]-0.316502[/C][C]-3.4526[/C][C]0.000385[/C][/ROW]
[ROW][C]46[/C][C]-0.159468[/C][C]-1.7396[/C][C]0.042258[/C][/ROW]
[ROW][C]47[/C][C]0.037961[/C][C]0.4141[/C][C]0.339772[/C][/ROW]
[ROW][C]48[/C][C]0.317409[/C][C]3.4625[/C][C]0.000372[/C][/ROW]
[/TABLE]
Source: https://freestatistics.org/blog/index.php?pk=232464&T=1

Globally Unique Identifier (entire table): ba.freestatistics.org/blog/index.php?pk=232464&T=1

As an alternative you can also use a QR Code:  

The GUIDs for individual cells are displayed in the table below:

Autocorrelation Function
Time lag kACF(k)T-STATP-value
10.018190.19840.421524
2-0.301552-3.28950.00066
3-0.309156-3.37250.000503
4-0.140527-1.5330.063968
50.190592.07910.019879
60.3002893.27580.00069
70.1757381.91710.028813
8-0.08854-0.96590.168037
9-0.331935-3.6210.000216
10-0.285889-3.11870.001139
110.0644480.7030.241699
120.7983028.70840
130.0031080.03390.486505
14-0.252634-2.75590.003387
15-0.244529-2.66750.004353
16-0.117384-1.28050.101429
170.1271981.38760.08393
180.2734192.98270.001734
190.1525461.66410.049363
20-0.086777-0.94660.172874
21-0.325868-3.55480.000272
22-0.188686-2.05830.020871
230.0797170.86960.193133
240.60566.60630
25-0.041588-0.45370.325447
26-0.189372-2.06580.020509
27-0.144712-1.57860.058539
28-0.139904-1.52620.06481
290.032880.35870.360238
300.2804263.05910.001372
310.1558681.70030.045842
32-0.04995-0.54490.293424
33-0.330336-3.60350.00023
34-0.180369-1.96760.02572
350.0772560.84280.200526
360.4242264.62785e-06
37-0.026538-0.28950.386353
38-0.115171-1.25640.105721
39-0.068635-0.74870.227753
40-0.162793-1.77590.039156
41-0.057507-0.62730.265822
420.2746872.99650.001662
430.1834952.00170.023796
44-0.016835-0.18360.427302
45-0.316502-3.45260.000385
46-0.159468-1.73960.042258
470.0379610.41410.339772
480.3174093.46250.000372


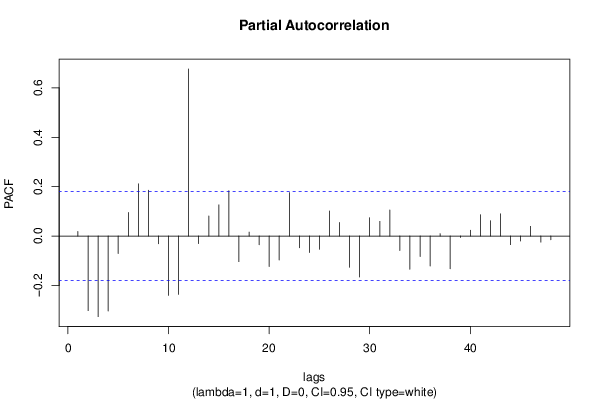
Partial Autocorrelation Function
Time lag kPACF(k)T-STATP-value
10.018190.19840.421524
2-0.301982-3.29420.00065
3-0.326384-3.56040.000267
4-0.30364-3.31230.000613
5-0.070847-0.77280.220573
60.0952561.03910.150427
70.2113082.30510.011447
80.1855752.02440.022585
9-0.031038-0.33860.367761
10-0.240179-2.620.004969
11-0.236193-2.57660.005601
120.676587.38060
13-0.030577-0.33360.369649
140.0814550.88860.188013
150.1263681.37850.085315
160.1837312.00430.023656
17-0.103533-1.12940.130498
180.0160310.17490.430735
19-0.035266-0.38470.35057
20-0.123478-1.3470.090272
21-0.097072-1.05890.145888
220.1757021.91670.028838
23-0.047163-0.51450.303932
24-0.06667-0.72730.234239
25-0.053611-0.58480.279887
260.1011921.10390.135938
270.0547810.59760.275623
28-0.126098-1.37560.08577
29-0.165973-1.81050.036367
300.0741180.80850.2102
310.059560.64970.258561
320.1057961.15410.125386
33-0.058348-0.63650.262838
34-0.134805-1.47050.072026
35-0.083172-0.90730.183041
36-0.121156-1.32170.09441
370.0096780.10560.458048
38-0.132797-1.44860.075034
39-0.005794-0.06320.474853
400.0236430.25790.398458
410.0862160.94050.174432
420.061820.67440.250689
430.0897140.97870.164865
44-0.034726-0.37880.352749
45-0.01978-0.21580.414768
460.0393020.42870.334445
47-0.024703-0.26950.394016
48-0.015322-0.16710.433771

\begin{tabular}{lllllllll}
\hline
Partial Autocorrelation Function \tabularnewline
Time lag k & PACF(k) & T-STAT & P-value \tabularnewline
1 & 0.01819 & 0.1984 & 0.421524 \tabularnewline
2 & -0.301982 & -3.2942 & 0.00065 \tabularnewline
3 & -0.326384 & -3.5604 & 0.000267 \tabularnewline
4 & -0.30364 & -3.3123 & 0.000613 \tabularnewline
5 & -0.070847 & -0.7728 & 0.220573 \tabularnewline
6 & 0.095256 & 1.0391 & 0.150427 \tabularnewline
7 & 0.211308 & 2.3051 & 0.011447 \tabularnewline
8 & 0.185575 & 2.0244 & 0.022585 \tabularnewline
9 & -0.031038 & -0.3386 & 0.367761 \tabularnewline
10 & -0.240179 & -2.62 & 0.004969 \tabularnewline
11 & -0.236193 & -2.5766 & 0.005601 \tabularnewline
12 & 0.67658 & 7.3806 & 0 \tabularnewline
13 & -0.030577 & -0.3336 & 0.369649 \tabularnewline
14 & 0.081455 & 0.8886 & 0.188013 \tabularnewline
15 & 0.126368 & 1.3785 & 0.085315 \tabularnewline
16 & 0.183731 & 2.0043 & 0.023656 \tabularnewline
17 & -0.103533 & -1.1294 & 0.130498 \tabularnewline
18 & 0.016031 & 0.1749 & 0.430735 \tabularnewline
19 & -0.035266 & -0.3847 & 0.35057 \tabularnewline
20 & -0.123478 & -1.347 & 0.090272 \tabularnewline
21 & -0.097072 & -1.0589 & 0.145888 \tabularnewline
22 & 0.175702 & 1.9167 & 0.028838 \tabularnewline
23 & -0.047163 & -0.5145 & 0.303932 \tabularnewline
24 & -0.06667 & -0.7273 & 0.234239 \tabularnewline
25 & -0.053611 & -0.5848 & 0.279887 \tabularnewline
26 & 0.101192 & 1.1039 & 0.135938 \tabularnewline
27 & 0.054781 & 0.5976 & 0.275623 \tabularnewline
28 & -0.126098 & -1.3756 & 0.08577 \tabularnewline
29 & -0.165973 & -1.8105 & 0.036367 \tabularnewline
30 & 0.074118 & 0.8085 & 0.2102 \tabularnewline
31 & 0.05956 & 0.6497 & 0.258561 \tabularnewline
32 & 0.105796 & 1.1541 & 0.125386 \tabularnewline
33 & -0.058348 & -0.6365 & 0.262838 \tabularnewline
34 & -0.134805 & -1.4705 & 0.072026 \tabularnewline
35 & -0.083172 & -0.9073 & 0.183041 \tabularnewline
36 & -0.121156 & -1.3217 & 0.09441 \tabularnewline
37 & 0.009678 & 0.1056 & 0.458048 \tabularnewline
38 & -0.132797 & -1.4486 & 0.075034 \tabularnewline
39 & -0.005794 & -0.0632 & 0.474853 \tabularnewline
40 & 0.023643 & 0.2579 & 0.398458 \tabularnewline
41 & 0.086216 & 0.9405 & 0.174432 \tabularnewline
42 & 0.06182 & 0.6744 & 0.250689 \tabularnewline
43 & 0.089714 & 0.9787 & 0.164865 \tabularnewline
44 & -0.034726 & -0.3788 & 0.352749 \tabularnewline
45 & -0.01978 & -0.2158 & 0.414768 \tabularnewline
46 & 0.039302 & 0.4287 & 0.334445 \tabularnewline
47 & -0.024703 & -0.2695 & 0.394016 \tabularnewline
48 & -0.015322 & -0.1671 & 0.433771 \tabularnewline
\hline
\end{tabular}
%Source: https://freestatistics.org/blog/index.php?pk=232464&T=2

[TABLE]
[ROW][C]Partial Autocorrelation Function[/C][/ROW]
[ROW][C]Time lag k[/C][C]PACF(k)[/C][C]T-STAT[/C][C]P-value[/C][/ROW]
[ROW][C]1[/C][C]0.01819[/C][C]0.1984[/C][C]0.421524[/C][/ROW]
[ROW][C]2[/C][C]-0.301982[/C][C]-3.2942[/C][C]0.00065[/C][/ROW]
[ROW][C]3[/C][C]-0.326384[/C][C]-3.5604[/C][C]0.000267[/C][/ROW]
[ROW][C]4[/C][C]-0.30364[/C][C]-3.3123[/C][C]0.000613[/C][/ROW]
[ROW][C]5[/C][C]-0.070847[/C][C]-0.7728[/C][C]0.220573[/C][/ROW]
[ROW][C]6[/C][C]0.095256[/C][C]1.0391[/C][C]0.150427[/C][/ROW]
[ROW][C]7[/C][C]0.211308[/C][C]2.3051[/C][C]0.011447[/C][/ROW]
[ROW][C]8[/C][C]0.185575[/C][C]2.0244[/C][C]0.022585[/C][/ROW]
[ROW][C]9[/C][C]-0.031038[/C][C]-0.3386[/C][C]0.367761[/C][/ROW]
[ROW][C]10[/C][C]-0.240179[/C][C]-2.62[/C][C]0.004969[/C][/ROW]
[ROW][C]11[/C][C]-0.236193[/C][C]-2.5766[/C][C]0.005601[/C][/ROW]
[ROW][C]12[/C][C]0.67658[/C][C]7.3806[/C][C]0[/C][/ROW]
[ROW][C]13[/C][C]-0.030577[/C][C]-0.3336[/C][C]0.369649[/C][/ROW]
[ROW][C]14[/C][C]0.081455[/C][C]0.8886[/C][C]0.188013[/C][/ROW]
[ROW][C]15[/C][C]0.126368[/C][C]1.3785[/C][C]0.085315[/C][/ROW]
[ROW][C]16[/C][C]0.183731[/C][C]2.0043[/C][C]0.023656[/C][/ROW]
[ROW][C]17[/C][C]-0.103533[/C][C]-1.1294[/C][C]0.130498[/C][/ROW]
[ROW][C]18[/C][C]0.016031[/C][C]0.1749[/C][C]0.430735[/C][/ROW]
[ROW][C]19[/C][C]-0.035266[/C][C]-0.3847[/C][C]0.35057[/C][/ROW]
[ROW][C]20[/C][C]-0.123478[/C][C]-1.347[/C][C]0.090272[/C][/ROW]
[ROW][C]21[/C][C]-0.097072[/C][C]-1.0589[/C][C]0.145888[/C][/ROW]
[ROW][C]22[/C][C]0.175702[/C][C]1.9167[/C][C]0.028838[/C][/ROW]
[ROW][C]23[/C][C]-0.047163[/C][C]-0.5145[/C][C]0.303932[/C][/ROW]
[ROW][C]24[/C][C]-0.06667[/C][C]-0.7273[/C][C]0.234239[/C][/ROW]
[ROW][C]25[/C][C]-0.053611[/C][C]-0.5848[/C][C]0.279887[/C][/ROW]
[ROW][C]26[/C][C]0.101192[/C][C]1.1039[/C][C]0.135938[/C][/ROW]
[ROW][C]27[/C][C]0.054781[/C][C]0.5976[/C][C]0.275623[/C][/ROW]
[ROW][C]28[/C][C]-0.126098[/C][C]-1.3756[/C][C]0.08577[/C][/ROW]
[ROW][C]29[/C][C]-0.165973[/C][C]-1.8105[/C][C]0.036367[/C][/ROW]
[ROW][C]30[/C][C]0.074118[/C][C]0.8085[/C][C]0.2102[/C][/ROW]
[ROW][C]31[/C][C]0.05956[/C][C]0.6497[/C][C]0.258561[/C][/ROW]
[ROW][C]32[/C][C]0.105796[/C][C]1.1541[/C][C]0.125386[/C][/ROW]
[ROW][C]33[/C][C]-0.058348[/C][C]-0.6365[/C][C]0.262838[/C][/ROW]
[ROW][C]34[/C][C]-0.134805[/C][C]-1.4705[/C][C]0.072026[/C][/ROW]
[ROW][C]35[/C][C]-0.083172[/C][C]-0.9073[/C][C]0.183041[/C][/ROW]
[ROW][C]36[/C][C]-0.121156[/C][C]-1.3217[/C][C]0.09441[/C][/ROW]
[ROW][C]37[/C][C]0.009678[/C][C]0.1056[/C][C]0.458048[/C][/ROW]
[ROW][C]38[/C][C]-0.132797[/C][C]-1.4486[/C][C]0.075034[/C][/ROW]
[ROW][C]39[/C][C]-0.005794[/C][C]-0.0632[/C][C]0.474853[/C][/ROW]
[ROW][C]40[/C][C]0.023643[/C][C]0.2579[/C][C]0.398458[/C][/ROW]
[ROW][C]41[/C][C]0.086216[/C][C]0.9405[/C][C]0.174432[/C][/ROW]
[ROW][C]42[/C][C]0.06182[/C][C]0.6744[/C][C]0.250689[/C][/ROW]
[ROW][C]43[/C][C]0.089714[/C][C]0.9787[/C][C]0.164865[/C][/ROW]
[ROW][C]44[/C][C]-0.034726[/C][C]-0.3788[/C][C]0.352749[/C][/ROW]
[ROW][C]45[/C][C]-0.01978[/C][C]-0.2158[/C][C]0.414768[/C][/ROW]
[ROW][C]46[/C][C]0.039302[/C][C]0.4287[/C][C]0.334445[/C][/ROW]
[ROW][C]47[/C][C]-0.024703[/C][C]-0.2695[/C][C]0.394016[/C][/ROW]
[ROW][C]48[/C][C]-0.015322[/C][C]-0.1671[/C][C]0.433771[/C][/ROW]
[/TABLE]
Source: https://freestatistics.org/blog/index.php?pk=232464&T=2

Globally Unique Identifier (entire table): ba.freestatistics.org/blog/index.php?pk=232464&T=2

As an alternative you can also use a QR Code:  

The GUIDs for individual cells are displayed in the table below:

Partial Autocorrelation Function
Time lag kPACF(k)T-STATP-value
10.018190.19840.421524
2-0.301982-3.29420.00065
3-0.326384-3.56040.000267
4-0.30364-3.31230.000613
5-0.070847-0.77280.220573
60.0952561.03910.150427
70.2113082.30510.011447
80.1855752.02440.022585
9-0.031038-0.33860.367761
10-0.240179-2.620.004969
11-0.236193-2.57660.005601
120.676587.38060
13-0.030577-0.33360.369649
140.0814550.88860.188013
150.1263681.37850.085315
160.1837312.00430.023656
17-0.103533-1.12940.130498
180.0160310.17490.430735
19-0.035266-0.38470.35057
20-0.123478-1.3470.090272
21-0.097072-1.05890.145888
220.1757021.91670.028838
23-0.047163-0.51450.303932
24-0.06667-0.72730.234239
25-0.053611-0.58480.279887
260.1011921.10390.135938
270.0547810.59760.275623
28-0.126098-1.37560.08577
29-0.165973-1.81050.036367
300.0741180.80850.2102
310.059560.64970.258561
320.1057961.15410.125386
33-0.058348-0.63650.262838
34-0.134805-1.47050.072026
35-0.083172-0.90730.183041
36-0.121156-1.32170.09441
370.0096780.10560.458048
38-0.132797-1.44860.075034
39-0.005794-0.06320.474853
400.0236430.25790.398458
410.0862160.94050.174432
420.061820.67440.250689
430.0897140.97870.164865
44-0.034726-0.37880.352749
45-0.01978-0.21580.414768
460.0393020.42870.334445
47-0.024703-0.26950.394016
48-0.015322-0.16710.433771


Parameters (Session):
par1 = 48 ; par2 = 1 ; par3 = 1 ; par4 = 0 ; par5 = 12 ; par6 = White Noise ; par7 = 0.95 ;
Parameters (R input):
par1 = 48 ; par2 = 1 ; par3 = 1 ; par4 = 0 ; par5 = 12 ; par6 = White Noise ; par7 = 0.95 ; par8 = ;
R code (references can be found in the software module):
if (par1 == 'Default') {
par1 = 10*log10(length(x))
} else {
par1 <- as.numeric(par1)
}
par2 <- as.numeric(par2)
par3 <- as.numeric(par3)
par4 <- as.numeric(par4)
par5 <- as.numeric(par5)
if (par6 == 'White Noise') par6 <- 'white' else par6 <- 'ma'
par7 <- as.numeric(par7)
if (par8 != '') par8 <- as.numeric(par8)
ox <- x
if (par8 == '') {
if (par2 == 0) {
x <- log(x)
} else {
x <- (x ^ par2 - 1) / par2
}
} else {
x <- log(x,base=par8)
}
if (par3 > 0) x <- diff(x,lag=1,difference=par3)
if (par4 > 0) x <- diff(x,lag=par5,difference=par4)
bitmap(file='picts.png')
op <- par(mfrow=c(2,1))
plot(ox,type='l',main='Original Time Series',xlab='time',ylab='value')
if (par8=='') {
mytitle <- paste('Working Time Series (lambda=',par2,', d=',par3,', D=',par4,')',sep='')
mysub <- paste('(lambda=',par2,', d=',par3,', D=',par4,', CI=', par7, ', CI type=',par6,')',sep='')
} else {
mytitle <- paste('Working Time Series (base=',par8,', d=',par3,', D=',par4,')',sep='')
mysub <- paste('(base=',par8,', d=',par3,', D=',par4,', CI=', par7, ', CI type=',par6,')',sep='')
}
plot(x,type='l', main=mytitle,xlab='time',ylab='value')
par(op)
dev.off()
bitmap(file='pic1.png')
racf <- acf(x, par1, main='Autocorrelation', xlab='time lag', ylab='ACF', ci.type=par6, ci=par7, sub=mysub)
dev.off()
bitmap(file='pic2.png')
rpacf <- pacf(x,par1,main='Partial Autocorrelation',xlab='lags',ylab='PACF',sub=mysub)
dev.off()
(myacf <- c(racf$acf))
(mypacf <- c(rpacf$acf))
lengthx <- length(x)
sqrtn <- sqrt(lengthx)
load(file='createtable')
a<-table.start()
a<-table.row.start(a)
a<-table.element(a,'Autocorrelation Function',4,TRUE)
a<-table.row.end(a)
a<-table.row.start(a)
a<-table.element(a,'Time lag k',header=TRUE)
a<-table.element(a,hyperlink('basics.htm','ACF(k)','click here for more information about the Autocorrelation Function'),header=TRUE)
a<-table.element(a,'T-STAT',header=TRUE)
a<-table.element(a,'P-value',header=TRUE)
a<-table.row.end(a)
for (i in 2:(par1+1)) {
a<-table.row.start(a)
a<-table.element(a,i-1,header=TRUE)
a<-table.element(a,round(myacf[i],6))
mytstat <- myacf[i]*sqrtn
a<-table.element(a,round(mytstat,4))
a<-table.element(a,round(1-pt(abs(mytstat),lengthx),6))
a<-table.row.end(a)
}
a<-table.end(a)
table.save(a,file='mytable.tab')
a<-table.start()
a<-table.row.start(a)
a<-table.element(a,'Partial Autocorrelation Function',4,TRUE)
a<-table.row.end(a)
a<-table.row.start(a)
a<-table.element(a,'Time lag k',header=TRUE)
a<-table.element(a,hyperlink('basics.htm','PACF(k)','click here for more information about the Partial Autocorrelation Function'),header=TRUE)
a<-table.element(a,'T-STAT',header=TRUE)
a<-table.element(a,'P-value',header=TRUE)
a<-table.row.end(a)
for (i in 1:par1) {
a<-table.row.start(a)
a<-table.element(a,i,header=TRUE)
a<-table.element(a,round(mypacf[i],6))
mytstat <- mypacf[i]*sqrtn
a<-table.element(a,round(mytstat,4))
a<-table.element(a,round(1-pt(abs(mytstat),lengthx),6))
a<-table.row.end(a)
}
a<-table.end(a)
table.save(a,file='mytable1.tab')