Free Statistics

of Irreproducible Research!

Author's title

Author*The author of this computation has been verified*
R Software Modulerwasp_autocorrelation.wasp
Title produced by software(Partial) Autocorrelation Function
Date of computationFri, 20 Dec 2013 11:05:21 -0500
Cite this page as followsStatistical Computations at FreeStatistics.org, Office for Research Development and Education, URL https://freestatistics.org/blog/index.php?v=date/2013/Dec/20/t1387555530xia3xcvpe8xrkoh.htm/, Retrieved Fri, 19 Apr 2024 14:32:47 +0000
Statistical Computations at FreeStatistics.org, Office for Research Development and Education, URL https://freestatistics.org/blog/index.php?pk=232463, Retrieved Fri, 19 Apr 2024 14:32:47 +0000
QR Codes:

Original text written by user:
IsPrivate?No (this computation is public)
User-defined keywords
Estimated Impact162
Family? (F = Feedback message, R = changed R code, M = changed R Module, P = changed Parameters, D = changed Data)
-       [(Partial) Autocorrelation Function] [] [2013-12-20 16:05:21] [9e6a405f514733ea23d87e4507d39d29] [Current]
Feedback Forum

Post a new message
Dataseries X:
56
55
54
52
72
71
56
46
47
47
48
50
44
38
33
33
52
54
39
22
31
31
38
42
41
31
36
34
51
47
31
19
30
33
36
40
32
25
28
29
55
55
40
38
44
41
49
59
61
47
43
39
66
68
63
68
67
59
68
78
82
70
62
68
94
102
100
104
103
93
110
114
120
102
95
103
122
139
135
135
137
130
148
148
145
128
131
133
146
163
151
157
152
149
172
167
160
150
160
165
171
179
171
176
170
169
194
196
188
174
186
191
197
206
197
204
201
190
213
213


Summary of computational transaction
Raw Inputview raw input (R code)
Raw Outputview raw output of R engine
Computing time5 seconds
R Server'Sir Ronald Aylmer Fisher' @ fisher.wessa.net

\begin{tabular}{lllllllll}
\hline
Summary of computational transaction \tabularnewline
Raw Input & view raw input (R code)  \tabularnewline
Raw Output & view raw output of R engine  \tabularnewline
Computing time & 5 seconds \tabularnewline
R Server & 'Sir Ronald Aylmer Fisher' @ fisher.wessa.net \tabularnewline
\hline
\end{tabular}
%Source: https://freestatistics.org/blog/index.php?pk=232463&T=0

[TABLE]
[ROW][C]Summary of computational transaction[/C][/ROW]
[ROW][C]Raw Input[/C][C]view raw input (R code) [/C][/ROW]
[ROW][C]Raw Output[/C][C]view raw output of R engine [/C][/ROW]
[ROW][C]Computing time[/C][C]5 seconds[/C][/ROW]
[ROW][C]R Server[/C][C]'Sir Ronald Aylmer Fisher' @ fisher.wessa.net[/C][/ROW]
[/TABLE]
Source: https://freestatistics.org/blog/index.php?pk=232463&T=0

Globally Unique Identifier (entire table): ba.freestatistics.org/blog/index.php?pk=232463&T=0

As an alternative you can also use a QR Code:  

The GUIDs for individual cells are displayed in the table below:

Summary of computational transaction
Raw Inputview raw input (R code)
Raw Outputview raw output of R engine
Computing time5 seconds
R Server'Sir Ronald Aylmer Fisher' @ fisher.wessa.net


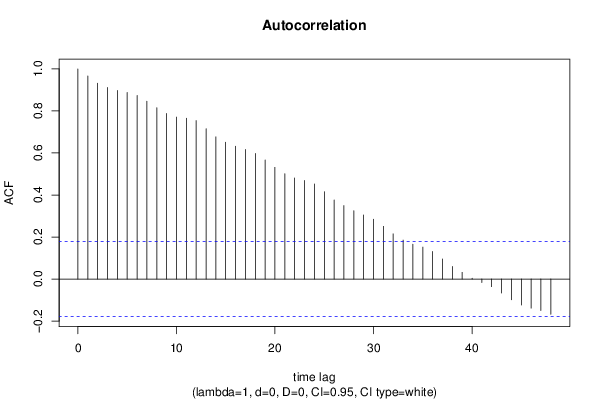
Autocorrelation Function
Time lag kACF(k)T-STATP-value
10.96642410.58660
20.93169910.20620
30.9118699.9890
40.8973479.82990
50.8876639.72390
60.8738159.57220
70.8465479.27350
80.8151418.92940
90.7876568.62830
100.7709058.44480
110.7656578.38740
120.7542338.26220
130.7158317.84150
140.6767527.41340
150.6512467.1340
160.6321696.92510
170.6162696.75090
180.5977846.54840
190.5669376.21050
200.5316145.82350
210.5009355.48750
220.4807925.26680
230.4693035.1411e-06
240.4525364.95731e-06
250.4152934.54936e-06
260.3763034.12223.5e-05
270.3494653.82820.000103
280.3253523.56410.000263
290.3051733.3430.000553
300.2848753.12060.00113
310.2507462.74680.003473
320.2151172.35650.010034
330.1852832.02970.022301
340.1656111.81420.036075
350.1519731.66480.049283
360.131131.43650.076738
370.0955891.04710.148573
380.0595840.65270.257595
390.0319050.34950.363664
400.0038460.04210.483232
41-0.016687-0.18280.427634
42-0.035954-0.39390.347194
43-0.066453-0.7280.234029
44-0.098188-1.07560.142134
45-0.123805-1.35620.088789
46-0.138466-1.51680.065971
47-0.149983-1.6430.051502
48-0.167144-1.8310.034793

\begin{tabular}{lllllllll}
\hline
Autocorrelation Function \tabularnewline
Time lag k & ACF(k) & T-STAT & P-value \tabularnewline
1 & 0.966424 & 10.5866 & 0 \tabularnewline
2 & 0.931699 & 10.2062 & 0 \tabularnewline
3 & 0.911869 & 9.989 & 0 \tabularnewline
4 & 0.897347 & 9.8299 & 0 \tabularnewline
5 & 0.887663 & 9.7239 & 0 \tabularnewline
6 & 0.873815 & 9.5722 & 0 \tabularnewline
7 & 0.846547 & 9.2735 & 0 \tabularnewline
8 & 0.815141 & 8.9294 & 0 \tabularnewline
9 & 0.787656 & 8.6283 & 0 \tabularnewline
10 & 0.770905 & 8.4448 & 0 \tabularnewline
11 & 0.765657 & 8.3874 & 0 \tabularnewline
12 & 0.754233 & 8.2622 & 0 \tabularnewline
13 & 0.715831 & 7.8415 & 0 \tabularnewline
14 & 0.676752 & 7.4134 & 0 \tabularnewline
15 & 0.651246 & 7.134 & 0 \tabularnewline
16 & 0.632169 & 6.9251 & 0 \tabularnewline
17 & 0.616269 & 6.7509 & 0 \tabularnewline
18 & 0.597784 & 6.5484 & 0 \tabularnewline
19 & 0.566937 & 6.2105 & 0 \tabularnewline
20 & 0.531614 & 5.8235 & 0 \tabularnewline
21 & 0.500935 & 5.4875 & 0 \tabularnewline
22 & 0.480792 & 5.2668 & 0 \tabularnewline
23 & 0.469303 & 5.141 & 1e-06 \tabularnewline
24 & 0.452536 & 4.9573 & 1e-06 \tabularnewline
25 & 0.415293 & 4.5493 & 6e-06 \tabularnewline
26 & 0.376303 & 4.1222 & 3.5e-05 \tabularnewline
27 & 0.349465 & 3.8282 & 0.000103 \tabularnewline
28 & 0.325352 & 3.5641 & 0.000263 \tabularnewline
29 & 0.305173 & 3.343 & 0.000553 \tabularnewline
30 & 0.284875 & 3.1206 & 0.00113 \tabularnewline
31 & 0.250746 & 2.7468 & 0.003473 \tabularnewline
32 & 0.215117 & 2.3565 & 0.010034 \tabularnewline
33 & 0.185283 & 2.0297 & 0.022301 \tabularnewline
34 & 0.165611 & 1.8142 & 0.036075 \tabularnewline
35 & 0.151973 & 1.6648 & 0.049283 \tabularnewline
36 & 0.13113 & 1.4365 & 0.076738 \tabularnewline
37 & 0.095589 & 1.0471 & 0.148573 \tabularnewline
38 & 0.059584 & 0.6527 & 0.257595 \tabularnewline
39 & 0.031905 & 0.3495 & 0.363664 \tabularnewline
40 & 0.003846 & 0.0421 & 0.483232 \tabularnewline
41 & -0.016687 & -0.1828 & 0.427634 \tabularnewline
42 & -0.035954 & -0.3939 & 0.347194 \tabularnewline
43 & -0.066453 & -0.728 & 0.234029 \tabularnewline
44 & -0.098188 & -1.0756 & 0.142134 \tabularnewline
45 & -0.123805 & -1.3562 & 0.088789 \tabularnewline
46 & -0.138466 & -1.5168 & 0.065971 \tabularnewline
47 & -0.149983 & -1.643 & 0.051502 \tabularnewline
48 & -0.167144 & -1.831 & 0.034793 \tabularnewline
\hline
\end{tabular}
%Source: https://freestatistics.org/blog/index.php?pk=232463&T=1

[TABLE]
[ROW][C]Autocorrelation Function[/C][/ROW]
[ROW][C]Time lag k[/C][C]ACF(k)[/C][C]T-STAT[/C][C]P-value[/C][/ROW]
[ROW][C]1[/C][C]0.966424[/C][C]10.5866[/C][C]0[/C][/ROW]
[ROW][C]2[/C][C]0.931699[/C][C]10.2062[/C][C]0[/C][/ROW]
[ROW][C]3[/C][C]0.911869[/C][C]9.989[/C][C]0[/C][/ROW]
[ROW][C]4[/C][C]0.897347[/C][C]9.8299[/C][C]0[/C][/ROW]
[ROW][C]5[/C][C]0.887663[/C][C]9.7239[/C][C]0[/C][/ROW]
[ROW][C]6[/C][C]0.873815[/C][C]9.5722[/C][C]0[/C][/ROW]
[ROW][C]7[/C][C]0.846547[/C][C]9.2735[/C][C]0[/C][/ROW]
[ROW][C]8[/C][C]0.815141[/C][C]8.9294[/C][C]0[/C][/ROW]
[ROW][C]9[/C][C]0.787656[/C][C]8.6283[/C][C]0[/C][/ROW]
[ROW][C]10[/C][C]0.770905[/C][C]8.4448[/C][C]0[/C][/ROW]
[ROW][C]11[/C][C]0.765657[/C][C]8.3874[/C][C]0[/C][/ROW]
[ROW][C]12[/C][C]0.754233[/C][C]8.2622[/C][C]0[/C][/ROW]
[ROW][C]13[/C][C]0.715831[/C][C]7.8415[/C][C]0[/C][/ROW]
[ROW][C]14[/C][C]0.676752[/C][C]7.4134[/C][C]0[/C][/ROW]
[ROW][C]15[/C][C]0.651246[/C][C]7.134[/C][C]0[/C][/ROW]
[ROW][C]16[/C][C]0.632169[/C][C]6.9251[/C][C]0[/C][/ROW]
[ROW][C]17[/C][C]0.616269[/C][C]6.7509[/C][C]0[/C][/ROW]
[ROW][C]18[/C][C]0.597784[/C][C]6.5484[/C][C]0[/C][/ROW]
[ROW][C]19[/C][C]0.566937[/C][C]6.2105[/C][C]0[/C][/ROW]
[ROW][C]20[/C][C]0.531614[/C][C]5.8235[/C][C]0[/C][/ROW]
[ROW][C]21[/C][C]0.500935[/C][C]5.4875[/C][C]0[/C][/ROW]
[ROW][C]22[/C][C]0.480792[/C][C]5.2668[/C][C]0[/C][/ROW]
[ROW][C]23[/C][C]0.469303[/C][C]5.141[/C][C]1e-06[/C][/ROW]
[ROW][C]24[/C][C]0.452536[/C][C]4.9573[/C][C]1e-06[/C][/ROW]
[ROW][C]25[/C][C]0.415293[/C][C]4.5493[/C][C]6e-06[/C][/ROW]
[ROW][C]26[/C][C]0.376303[/C][C]4.1222[/C][C]3.5e-05[/C][/ROW]
[ROW][C]27[/C][C]0.349465[/C][C]3.8282[/C][C]0.000103[/C][/ROW]
[ROW][C]28[/C][C]0.325352[/C][C]3.5641[/C][C]0.000263[/C][/ROW]
[ROW][C]29[/C][C]0.305173[/C][C]3.343[/C][C]0.000553[/C][/ROW]
[ROW][C]30[/C][C]0.284875[/C][C]3.1206[/C][C]0.00113[/C][/ROW]
[ROW][C]31[/C][C]0.250746[/C][C]2.7468[/C][C]0.003473[/C][/ROW]
[ROW][C]32[/C][C]0.215117[/C][C]2.3565[/C][C]0.010034[/C][/ROW]
[ROW][C]33[/C][C]0.185283[/C][C]2.0297[/C][C]0.022301[/C][/ROW]
[ROW][C]34[/C][C]0.165611[/C][C]1.8142[/C][C]0.036075[/C][/ROW]
[ROW][C]35[/C][C]0.151973[/C][C]1.6648[/C][C]0.049283[/C][/ROW]
[ROW][C]36[/C][C]0.13113[/C][C]1.4365[/C][C]0.076738[/C][/ROW]
[ROW][C]37[/C][C]0.095589[/C][C]1.0471[/C][C]0.148573[/C][/ROW]
[ROW][C]38[/C][C]0.059584[/C][C]0.6527[/C][C]0.257595[/C][/ROW]
[ROW][C]39[/C][C]0.031905[/C][C]0.3495[/C][C]0.363664[/C][/ROW]
[ROW][C]40[/C][C]0.003846[/C][C]0.0421[/C][C]0.483232[/C][/ROW]
[ROW][C]41[/C][C]-0.016687[/C][C]-0.1828[/C][C]0.427634[/C][/ROW]
[ROW][C]42[/C][C]-0.035954[/C][C]-0.3939[/C][C]0.347194[/C][/ROW]
[ROW][C]43[/C][C]-0.066453[/C][C]-0.728[/C][C]0.234029[/C][/ROW]
[ROW][C]44[/C][C]-0.098188[/C][C]-1.0756[/C][C]0.142134[/C][/ROW]
[ROW][C]45[/C][C]-0.123805[/C][C]-1.3562[/C][C]0.088789[/C][/ROW]
[ROW][C]46[/C][C]-0.138466[/C][C]-1.5168[/C][C]0.065971[/C][/ROW]
[ROW][C]47[/C][C]-0.149983[/C][C]-1.643[/C][C]0.051502[/C][/ROW]
[ROW][C]48[/C][C]-0.167144[/C][C]-1.831[/C][C]0.034793[/C][/ROW]
[/TABLE]
Source: https://freestatistics.org/blog/index.php?pk=232463&T=1

Globally Unique Identifier (entire table): ba.freestatistics.org/blog/index.php?pk=232463&T=1

As an alternative you can also use a QR Code:  

The GUIDs for individual cells are displayed in the table below:

Autocorrelation Function
Time lag kACF(k)T-STATP-value
10.96642410.58660
20.93169910.20620
30.9118699.9890
40.8973479.82990
50.8876639.72390
60.8738159.57220
70.8465479.27350
80.8151418.92940
90.7876568.62830
100.7709058.44480
110.7656578.38740
120.7542338.26220
130.7158317.84150
140.6767527.41340
150.6512467.1340
160.6321696.92510
170.6162696.75090
180.5977846.54840
190.5669376.21050
200.5316145.82350
210.5009355.48750
220.4807925.26680
230.4693035.1411e-06
240.4525364.95731e-06
250.4152934.54936e-06
260.3763034.12223.5e-05
270.3494653.82820.000103
280.3253523.56410.000263
290.3051733.3430.000553
300.2848753.12060.00113
310.2507462.74680.003473
320.2151172.35650.010034
330.1852832.02970.022301
340.1656111.81420.036075
350.1519731.66480.049283
360.131131.43650.076738
370.0955891.04710.148573
380.0595840.65270.257595
390.0319050.34950.363664
400.0038460.04210.483232
41-0.016687-0.18280.427634
42-0.035954-0.39390.347194
43-0.066453-0.7280.234029
44-0.098188-1.07560.142134
45-0.123805-1.35620.088789
46-0.138466-1.51680.065971
47-0.149983-1.6430.051502
48-0.167144-1.8310.034793


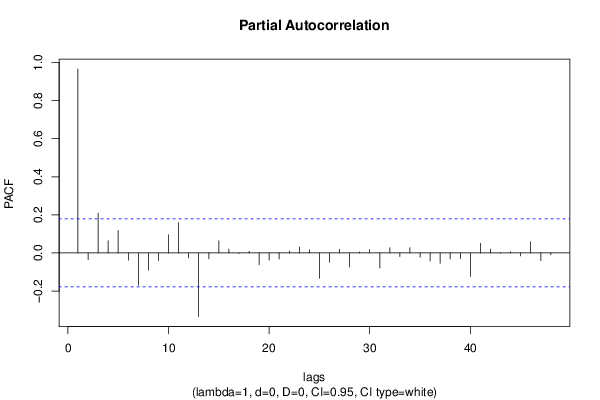
Partial Autocorrelation Function
Time lag kPACF(k)T-STATP-value
10.96642410.58660
2-0.034488-0.37780.353125
30.2081962.28070.012166
40.0635580.69620.243811
50.117481.28690.100298
6-0.038007-0.41630.33895
7-0.169558-1.85740.032851
8-0.089874-0.98450.163421
9-0.040388-0.44240.329489
100.0959531.05110.147661
110.1584931.73620.042547
12-0.025036-0.27430.392179
13-0.334767-3.66720.000183
14-0.030874-0.33820.367901
150.064360.7050.241081
160.0200460.21960.413282
17-0.002837-0.03110.487629
180.0081920.08970.464321
19-0.062086-0.68010.24887
20-0.037076-0.40610.342679
21-0.031701-0.34730.364501
220.0105430.11550.454123
230.0311570.34130.366736
240.0159810.17510.430663
25-0.133496-1.46240.073127
26-0.048908-0.53580.296557
270.0187450.20530.418825
28-0.074139-0.81210.209158
290.0051240.05610.477666
300.0171950.18840.425457
31-0.078933-0.86470.194474
320.0275940.30230.381484
33-0.01848-0.20240.419957
340.0272170.29820.383051
35-0.022071-0.24180.404685
36-0.042698-0.46770.320411
37-0.054431-0.59630.276063
38-0.03214-0.35210.362699
39-0.03004-0.32910.371337
40-0.123065-1.34810.090081
410.0510770.55950.288427
420.0200830.220.413123
43-0.002323-0.02540.48987
440.0059880.06560.473903
45-0.01566-0.17150.432042
460.058170.63720.262596
47-0.040502-0.44370.329039
48-0.009876-0.10820.457015

\begin{tabular}{lllllllll}
\hline
Partial Autocorrelation Function \tabularnewline
Time lag k & PACF(k) & T-STAT & P-value \tabularnewline
1 & 0.966424 & 10.5866 & 0 \tabularnewline
2 & -0.034488 & -0.3778 & 0.353125 \tabularnewline
3 & 0.208196 & 2.2807 & 0.012166 \tabularnewline
4 & 0.063558 & 0.6962 & 0.243811 \tabularnewline
5 & 0.11748 & 1.2869 & 0.100298 \tabularnewline
6 & -0.038007 & -0.4163 & 0.33895 \tabularnewline
7 & -0.169558 & -1.8574 & 0.032851 \tabularnewline
8 & -0.089874 & -0.9845 & 0.163421 \tabularnewline
9 & -0.040388 & -0.4424 & 0.329489 \tabularnewline
10 & 0.095953 & 1.0511 & 0.147661 \tabularnewline
11 & 0.158493 & 1.7362 & 0.042547 \tabularnewline
12 & -0.025036 & -0.2743 & 0.392179 \tabularnewline
13 & -0.334767 & -3.6672 & 0.000183 \tabularnewline
14 & -0.030874 & -0.3382 & 0.367901 \tabularnewline
15 & 0.06436 & 0.705 & 0.241081 \tabularnewline
16 & 0.020046 & 0.2196 & 0.413282 \tabularnewline
17 & -0.002837 & -0.0311 & 0.487629 \tabularnewline
18 & 0.008192 & 0.0897 & 0.464321 \tabularnewline
19 & -0.062086 & -0.6801 & 0.24887 \tabularnewline
20 & -0.037076 & -0.4061 & 0.342679 \tabularnewline
21 & -0.031701 & -0.3473 & 0.364501 \tabularnewline
22 & 0.010543 & 0.1155 & 0.454123 \tabularnewline
23 & 0.031157 & 0.3413 & 0.366736 \tabularnewline
24 & 0.015981 & 0.1751 & 0.430663 \tabularnewline
25 & -0.133496 & -1.4624 & 0.073127 \tabularnewline
26 & -0.048908 & -0.5358 & 0.296557 \tabularnewline
27 & 0.018745 & 0.2053 & 0.418825 \tabularnewline
28 & -0.074139 & -0.8121 & 0.209158 \tabularnewline
29 & 0.005124 & 0.0561 & 0.477666 \tabularnewline
30 & 0.017195 & 0.1884 & 0.425457 \tabularnewline
31 & -0.078933 & -0.8647 & 0.194474 \tabularnewline
32 & 0.027594 & 0.3023 & 0.381484 \tabularnewline
33 & -0.01848 & -0.2024 & 0.419957 \tabularnewline
34 & 0.027217 & 0.2982 & 0.383051 \tabularnewline
35 & -0.022071 & -0.2418 & 0.404685 \tabularnewline
36 & -0.042698 & -0.4677 & 0.320411 \tabularnewline
37 & -0.054431 & -0.5963 & 0.276063 \tabularnewline
38 & -0.03214 & -0.3521 & 0.362699 \tabularnewline
39 & -0.03004 & -0.3291 & 0.371337 \tabularnewline
40 & -0.123065 & -1.3481 & 0.090081 \tabularnewline
41 & 0.051077 & 0.5595 & 0.288427 \tabularnewline
42 & 0.020083 & 0.22 & 0.413123 \tabularnewline
43 & -0.002323 & -0.0254 & 0.48987 \tabularnewline
44 & 0.005988 & 0.0656 & 0.473903 \tabularnewline
45 & -0.01566 & -0.1715 & 0.432042 \tabularnewline
46 & 0.05817 & 0.6372 & 0.262596 \tabularnewline
47 & -0.040502 & -0.4437 & 0.329039 \tabularnewline
48 & -0.009876 & -0.1082 & 0.457015 \tabularnewline
\hline
\end{tabular}
%Source: https://freestatistics.org/blog/index.php?pk=232463&T=2

[TABLE]
[ROW][C]Partial Autocorrelation Function[/C][/ROW]
[ROW][C]Time lag k[/C][C]PACF(k)[/C][C]T-STAT[/C][C]P-value[/C][/ROW]
[ROW][C]1[/C][C]0.966424[/C][C]10.5866[/C][C]0[/C][/ROW]
[ROW][C]2[/C][C]-0.034488[/C][C]-0.3778[/C][C]0.353125[/C][/ROW]
[ROW][C]3[/C][C]0.208196[/C][C]2.2807[/C][C]0.012166[/C][/ROW]
[ROW][C]4[/C][C]0.063558[/C][C]0.6962[/C][C]0.243811[/C][/ROW]
[ROW][C]5[/C][C]0.11748[/C][C]1.2869[/C][C]0.100298[/C][/ROW]
[ROW][C]6[/C][C]-0.038007[/C][C]-0.4163[/C][C]0.33895[/C][/ROW]
[ROW][C]7[/C][C]-0.169558[/C][C]-1.8574[/C][C]0.032851[/C][/ROW]
[ROW][C]8[/C][C]-0.089874[/C][C]-0.9845[/C][C]0.163421[/C][/ROW]
[ROW][C]9[/C][C]-0.040388[/C][C]-0.4424[/C][C]0.329489[/C][/ROW]
[ROW][C]10[/C][C]0.095953[/C][C]1.0511[/C][C]0.147661[/C][/ROW]
[ROW][C]11[/C][C]0.158493[/C][C]1.7362[/C][C]0.042547[/C][/ROW]
[ROW][C]12[/C][C]-0.025036[/C][C]-0.2743[/C][C]0.392179[/C][/ROW]
[ROW][C]13[/C][C]-0.334767[/C][C]-3.6672[/C][C]0.000183[/C][/ROW]
[ROW][C]14[/C][C]-0.030874[/C][C]-0.3382[/C][C]0.367901[/C][/ROW]
[ROW][C]15[/C][C]0.06436[/C][C]0.705[/C][C]0.241081[/C][/ROW]
[ROW][C]16[/C][C]0.020046[/C][C]0.2196[/C][C]0.413282[/C][/ROW]
[ROW][C]17[/C][C]-0.002837[/C][C]-0.0311[/C][C]0.487629[/C][/ROW]
[ROW][C]18[/C][C]0.008192[/C][C]0.0897[/C][C]0.464321[/C][/ROW]
[ROW][C]19[/C][C]-0.062086[/C][C]-0.6801[/C][C]0.24887[/C][/ROW]
[ROW][C]20[/C][C]-0.037076[/C][C]-0.4061[/C][C]0.342679[/C][/ROW]
[ROW][C]21[/C][C]-0.031701[/C][C]-0.3473[/C][C]0.364501[/C][/ROW]
[ROW][C]22[/C][C]0.010543[/C][C]0.1155[/C][C]0.454123[/C][/ROW]
[ROW][C]23[/C][C]0.031157[/C][C]0.3413[/C][C]0.366736[/C][/ROW]
[ROW][C]24[/C][C]0.015981[/C][C]0.1751[/C][C]0.430663[/C][/ROW]
[ROW][C]25[/C][C]-0.133496[/C][C]-1.4624[/C][C]0.073127[/C][/ROW]
[ROW][C]26[/C][C]-0.048908[/C][C]-0.5358[/C][C]0.296557[/C][/ROW]
[ROW][C]27[/C][C]0.018745[/C][C]0.2053[/C][C]0.418825[/C][/ROW]
[ROW][C]28[/C][C]-0.074139[/C][C]-0.8121[/C][C]0.209158[/C][/ROW]
[ROW][C]29[/C][C]0.005124[/C][C]0.0561[/C][C]0.477666[/C][/ROW]
[ROW][C]30[/C][C]0.017195[/C][C]0.1884[/C][C]0.425457[/C][/ROW]
[ROW][C]31[/C][C]-0.078933[/C][C]-0.8647[/C][C]0.194474[/C][/ROW]
[ROW][C]32[/C][C]0.027594[/C][C]0.3023[/C][C]0.381484[/C][/ROW]
[ROW][C]33[/C][C]-0.01848[/C][C]-0.2024[/C][C]0.419957[/C][/ROW]
[ROW][C]34[/C][C]0.027217[/C][C]0.2982[/C][C]0.383051[/C][/ROW]
[ROW][C]35[/C][C]-0.022071[/C][C]-0.2418[/C][C]0.404685[/C][/ROW]
[ROW][C]36[/C][C]-0.042698[/C][C]-0.4677[/C][C]0.320411[/C][/ROW]
[ROW][C]37[/C][C]-0.054431[/C][C]-0.5963[/C][C]0.276063[/C][/ROW]
[ROW][C]38[/C][C]-0.03214[/C][C]-0.3521[/C][C]0.362699[/C][/ROW]
[ROW][C]39[/C][C]-0.03004[/C][C]-0.3291[/C][C]0.371337[/C][/ROW]
[ROW][C]40[/C][C]-0.123065[/C][C]-1.3481[/C][C]0.090081[/C][/ROW]
[ROW][C]41[/C][C]0.051077[/C][C]0.5595[/C][C]0.288427[/C][/ROW]
[ROW][C]42[/C][C]0.020083[/C][C]0.22[/C][C]0.413123[/C][/ROW]
[ROW][C]43[/C][C]-0.002323[/C][C]-0.0254[/C][C]0.48987[/C][/ROW]
[ROW][C]44[/C][C]0.005988[/C][C]0.0656[/C][C]0.473903[/C][/ROW]
[ROW][C]45[/C][C]-0.01566[/C][C]-0.1715[/C][C]0.432042[/C][/ROW]
[ROW][C]46[/C][C]0.05817[/C][C]0.6372[/C][C]0.262596[/C][/ROW]
[ROW][C]47[/C][C]-0.040502[/C][C]-0.4437[/C][C]0.329039[/C][/ROW]
[ROW][C]48[/C][C]-0.009876[/C][C]-0.1082[/C][C]0.457015[/C][/ROW]
[/TABLE]
Source: https://freestatistics.org/blog/index.php?pk=232463&T=2

Globally Unique Identifier (entire table): ba.freestatistics.org/blog/index.php?pk=232463&T=2

As an alternative you can also use a QR Code:  

The GUIDs for individual cells are displayed in the table below:

Partial Autocorrelation Function
Time lag kPACF(k)T-STATP-value
10.96642410.58660
2-0.034488-0.37780.353125
30.2081962.28070.012166
40.0635580.69620.243811
50.117481.28690.100298
6-0.038007-0.41630.33895
7-0.169558-1.85740.032851
8-0.089874-0.98450.163421
9-0.040388-0.44240.329489
100.0959531.05110.147661
110.1584931.73620.042547
12-0.025036-0.27430.392179
13-0.334767-3.66720.000183
14-0.030874-0.33820.367901
150.064360.7050.241081
160.0200460.21960.413282
17-0.002837-0.03110.487629
180.0081920.08970.464321
19-0.062086-0.68010.24887
20-0.037076-0.40610.342679
21-0.031701-0.34730.364501
220.0105430.11550.454123
230.0311570.34130.366736
240.0159810.17510.430663
25-0.133496-1.46240.073127
26-0.048908-0.53580.296557
270.0187450.20530.418825
28-0.074139-0.81210.209158
290.0051240.05610.477666
300.0171950.18840.425457
31-0.078933-0.86470.194474
320.0275940.30230.381484
33-0.01848-0.20240.419957
340.0272170.29820.383051
35-0.022071-0.24180.404685
36-0.042698-0.46770.320411
37-0.054431-0.59630.276063
38-0.03214-0.35210.362699
39-0.03004-0.32910.371337
40-0.123065-1.34810.090081
410.0510770.55950.288427
420.0200830.220.413123
43-0.002323-0.02540.48987
440.0059880.06560.473903
45-0.01566-0.17150.432042
460.058170.63720.262596
47-0.040502-0.44370.329039
48-0.009876-0.10820.457015


Parameters (Session):
par1 = 48 ; par2 = 1 ; par3 = 0 ; par4 = 0 ; par5 = 12 ; par6 = White Noise ; par7 = 0.95 ;
Parameters (R input):
par1 = 48 ; par2 = 1 ; par3 = 0 ; par4 = 0 ; par5 = 12 ; par6 = White Noise ; par7 = 0.95 ; par8 = ;
R code (references can be found in the software module):
if (par1 == 'Default') {
par1 = 10*log10(length(x))
} else {
par1 <- as.numeric(par1)
}
par2 <- as.numeric(par2)
par3 <- as.numeric(par3)
par4 <- as.numeric(par4)
par5 <- as.numeric(par5)
if (par6 == 'White Noise') par6 <- 'white' else par6 <- 'ma'
par7 <- as.numeric(par7)
if (par8 != '') par8 <- as.numeric(par8)
ox <- x
if (par8 == '') {
if (par2 == 0) {
x <- log(x)
} else {
x <- (x ^ par2 - 1) / par2
}
} else {
x <- log(x,base=par8)
}
if (par3 > 0) x <- diff(x,lag=1,difference=par3)
if (par4 > 0) x <- diff(x,lag=par5,difference=par4)
bitmap(file='picts.png')
op <- par(mfrow=c(2,1))
plot(ox,type='l',main='Original Time Series',xlab='time',ylab='value')
if (par8=='') {
mytitle <- paste('Working Time Series (lambda=',par2,', d=',par3,', D=',par4,')',sep='')
mysub <- paste('(lambda=',par2,', d=',par3,', D=',par4,', CI=', par7, ', CI type=',par6,')',sep='')
} else {
mytitle <- paste('Working Time Series (base=',par8,', d=',par3,', D=',par4,')',sep='')
mysub <- paste('(base=',par8,', d=',par3,', D=',par4,', CI=', par7, ', CI type=',par6,')',sep='')
}
plot(x,type='l', main=mytitle,xlab='time',ylab='value')
par(op)
dev.off()
bitmap(file='pic1.png')
racf <- acf(x, par1, main='Autocorrelation', xlab='time lag', ylab='ACF', ci.type=par6, ci=par7, sub=mysub)
dev.off()
bitmap(file='pic2.png')
rpacf <- pacf(x,par1,main='Partial Autocorrelation',xlab='lags',ylab='PACF',sub=mysub)
dev.off()
(myacf <- c(racf$acf))
(mypacf <- c(rpacf$acf))
lengthx <- length(x)
sqrtn <- sqrt(lengthx)
load(file='createtable')
a<-table.start()
a<-table.row.start(a)
a<-table.element(a,'Autocorrelation Function',4,TRUE)
a<-table.row.end(a)
a<-table.row.start(a)
a<-table.element(a,'Time lag k',header=TRUE)
a<-table.element(a,hyperlink('basics.htm','ACF(k)','click here for more information about the Autocorrelation Function'),header=TRUE)
a<-table.element(a,'T-STAT',header=TRUE)
a<-table.element(a,'P-value',header=TRUE)
a<-table.row.end(a)
for (i in 2:(par1+1)) {
a<-table.row.start(a)
a<-table.element(a,i-1,header=TRUE)
a<-table.element(a,round(myacf[i],6))
mytstat <- myacf[i]*sqrtn
a<-table.element(a,round(mytstat,4))
a<-table.element(a,round(1-pt(abs(mytstat),lengthx),6))
a<-table.row.end(a)
}
a<-table.end(a)
table.save(a,file='mytable.tab')
a<-table.start()
a<-table.row.start(a)
a<-table.element(a,'Partial Autocorrelation Function',4,TRUE)
a<-table.row.end(a)
a<-table.row.start(a)
a<-table.element(a,'Time lag k',header=TRUE)
a<-table.element(a,hyperlink('basics.htm','PACF(k)','click here for more information about the Partial Autocorrelation Function'),header=TRUE)
a<-table.element(a,'T-STAT',header=TRUE)
a<-table.element(a,'P-value',header=TRUE)
a<-table.row.end(a)
for (i in 1:par1) {
a<-table.row.start(a)
a<-table.element(a,i,header=TRUE)
a<-table.element(a,round(mypacf[i],6))
mytstat <- mypacf[i]*sqrtn
a<-table.element(a,round(mytstat,4))
a<-table.element(a,round(1-pt(abs(mytstat),lengthx),6))
a<-table.row.end(a)
}
a<-table.end(a)
table.save(a,file='mytable1.tab')