Free Statistics

of Irreproducible Research!

Author's title

Author*The author of this computation has been verified*
R Software Modulerwasp_arimabackwardselection.wasp
Title produced by softwareARIMA Backward Selection
Date of computationTue, 17 Dec 2013 15:35:14 -0500
Cite this page as followsStatistical Computations at FreeStatistics.org, Office for Research Development and Education, URL https://freestatistics.org/blog/index.php?v=date/2013/Dec/17/t1387312970kyac5ec2by7r0ne.htm/, Retrieved Fri, 26 Apr 2024 23:57:29 +0000
Statistical Computations at FreeStatistics.org, Office for Research Development and Education, URL https://freestatistics.org/blog/index.php?pk=232422, Retrieved Fri, 26 Apr 2024 23:57:29 +0000
QR Codes:

Original text written by user:
IsPrivate?No (this computation is public)
User-defined keywords
Estimated Impact181
Family? (F = Feedback message, R = changed R code, M = changed R Module, P = changed Parameters, D = changed Data)
-     [Univariate Explorative Data Analysis] [Run Sequence gebo...] [2008-12-12 13:32:37] [76963dc1903f0f612b6153510a3818cf]
- R  D  [Univariate Explorative Data Analysis] [Run Sequence gebo...] [2008-12-17 12:14:40] [76963dc1903f0f612b6153510a3818cf]
-         [Univariate Explorative Data Analysis] [Run Sequence Plot...] [2008-12-22 18:19:51] [1ce0d16c8f4225c977b42c8fa93bc163]
- RMP       [Univariate Data Series] [Identifying Integ...] [2009-11-22 12:08:06] [b98453cac15ba1066b407e146608df68]
- RMP         [(Partial) Autocorrelation Function] [Births] [2010-11-29 09:36:27] [b98453cac15ba1066b407e146608df68]
- R PD          [(Partial) Autocorrelation Function] [ACR 1] [2013-12-03 18:19:48] [0ba55e3ce082ee2313a5fbafd157b436]
- RMPD              [ARIMA Backward Selection] [ARIMA] [2013-12-17 20:35:14] [2e4b2f9d3944a9ae720fcdd8099335ae] [Current]
Feedback Forum

Post a new message
Dataseries X:
136524
132111
125326
122716
116615
113719
110737
112093
143565
149946
149147
134339
122683
115614
116566
111272
104609
101802
94542
93051
124129
130374
123946
114971
105531
104919
104782
101281
94545
93248
84031
87486
115867
120327
117008
108811
104519
106758
109337
109078
108293
106534
99197
103493
130676
137448
134704
123725
118277
121225
120528
118240
112514
107304
100001
102082
130455
135574
132540
119920
112454
109415
109843
106365
102304
97968
92462
92286
120092
126656
124144
114045
108120
105698
111203
110030
104009
99772
96301
97680
121563
134210
133111
124527
117589
115699
117830
115874
111267
107985
102185
102101
128932
135782
136971
126292
119260


Summary of computational transaction
Raw Inputview raw input (R code)
Raw Outputview raw output of R engine
Computing time14 seconds
R Server'Herman Ole Andreas Wold' @ wold.wessa.net

\begin{tabular}{lllllllll}
\hline
Summary of computational transaction \tabularnewline
Raw Input & view raw input (R code)  \tabularnewline
Raw Output & view raw output of R engine  \tabularnewline
Computing time & 14 seconds \tabularnewline
R Server & 'Herman Ole Andreas Wold' @ wold.wessa.net \tabularnewline
\hline
\end{tabular}
%Source: https://freestatistics.org/blog/index.php?pk=232422&T=0

[TABLE]
[ROW][C]Summary of computational transaction[/C][/ROW]
[ROW][C]Raw Input[/C][C]view raw input (R code) [/C][/ROW]
[ROW][C]Raw Output[/C][C]view raw output of R engine [/C][/ROW]
[ROW][C]Computing time[/C][C]14 seconds[/C][/ROW]
[ROW][C]R Server[/C][C]'Herman Ole Andreas Wold' @ wold.wessa.net[/C][/ROW]
[/TABLE]
Source: https://freestatistics.org/blog/index.php?pk=232422&T=0

Globally Unique Identifier (entire table): ba.freestatistics.org/blog/index.php?pk=232422&T=0

As an alternative you can also use a QR Code:  

The GUIDs for individual cells are displayed in the table below:

Summary of computational transaction
Raw Inputview raw input (R code)
Raw Outputview raw output of R engine
Computing time14 seconds
R Server'Herman Ole Andreas Wold' @ wold.wessa.net


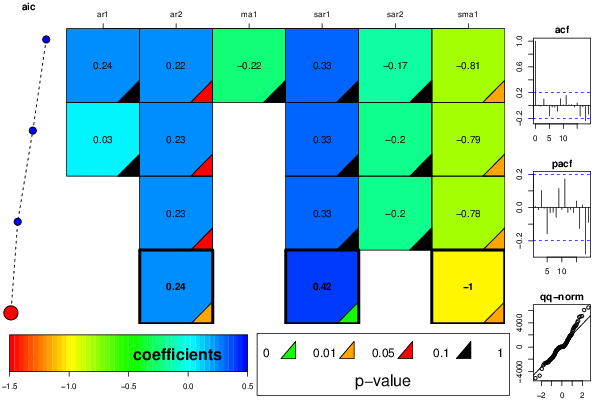
ARIMA Parameter Estimation and Backward Selection
Iterationar1ar2ma1sar1sar2sma1
Estimates ( 1 )0.240.2222-0.22150.3349-0.1666-0.805
(p-val)(0.5225 )(0.0706 )(0.5566 )(0.2106 )(0.3878 )(0.0321 )
Estimates ( 2 )0.0290.226600.3255-0.1977-0.7943
(p-val)(0.7896 )(0.0572 )(NA )(0.2138 )(0.2759 )(0.0314 )
Estimates ( 3 )00.22800.3259-0.2026-0.7839
(p-val)(NA )(0.0557 )(NA )(0.2151 )(0.2579 )(0.0285 )
Estimates ( 4 )00.240200.41790-1.0011
(p-val)(NA )(0.0362 )(NA )(0.0033 )(NA )(0.0248 )
Estimates ( 5 )NANANANANANA
(p-val)(NA )(NA )(NA )(NA )(NA )(NA )
Estimates ( 6 )NANANANANANA
(p-val)(NA )(NA )(NA )(NA )(NA )(NA )
Estimates ( 7 )NANANANANANA
(p-val)(NA )(NA )(NA )(NA )(NA )(NA )
Estimates ( 8 )NANANANANANA
(p-val)(NA )(NA )(NA )(NA )(NA )(NA )
Estimates ( 9 )NANANANANANA
(p-val)(NA )(NA )(NA )(NA )(NA )(NA )
Estimates ( 10 )NANANANANANA
(p-val)(NA )(NA )(NA )(NA )(NA )(NA )
Estimates ( 11 )NANANANANANA
(p-val)(NA )(NA )(NA )(NA )(NA )(NA )

\begin{tabular}{lllllllll}
\hline
ARIMA Parameter Estimation and Backward Selection \tabularnewline
Iteration & ar1 & ar2 & ma1 & sar1 & sar2 & sma1 \tabularnewline
Estimates ( 1 ) & 0.24 & 0.2222 & -0.2215 & 0.3349 & -0.1666 & -0.805 \tabularnewline
(p-val) & (0.5225 ) & (0.0706 ) & (0.5566 ) & (0.2106 ) & (0.3878 ) & (0.0321 ) \tabularnewline
Estimates ( 2 ) & 0.029 & 0.2266 & 0 & 0.3255 & -0.1977 & -0.7943 \tabularnewline
(p-val) & (0.7896 ) & (0.0572 ) & (NA ) & (0.2138 ) & (0.2759 ) & (0.0314 ) \tabularnewline
Estimates ( 3 ) & 0 & 0.228 & 0 & 0.3259 & -0.2026 & -0.7839 \tabularnewline
(p-val) & (NA ) & (0.0557 ) & (NA ) & (0.2151 ) & (0.2579 ) & (0.0285 ) \tabularnewline
Estimates ( 4 ) & 0 & 0.2402 & 0 & 0.4179 & 0 & -1.0011 \tabularnewline
(p-val) & (NA ) & (0.0362 ) & (NA ) & (0.0033 ) & (NA ) & (0.0248 ) \tabularnewline
Estimates ( 5 ) & NA & NA & NA & NA & NA & NA \tabularnewline
(p-val) & (NA ) & (NA ) & (NA ) & (NA ) & (NA ) & (NA ) \tabularnewline
Estimates ( 6 ) & NA & NA & NA & NA & NA & NA \tabularnewline
(p-val) & (NA ) & (NA ) & (NA ) & (NA ) & (NA ) & (NA ) \tabularnewline
Estimates ( 7 ) & NA & NA & NA & NA & NA & NA \tabularnewline
(p-val) & (NA ) & (NA ) & (NA ) & (NA ) & (NA ) & (NA ) \tabularnewline
Estimates ( 8 ) & NA & NA & NA & NA & NA & NA \tabularnewline
(p-val) & (NA ) & (NA ) & (NA ) & (NA ) & (NA ) & (NA ) \tabularnewline
Estimates ( 9 ) & NA & NA & NA & NA & NA & NA \tabularnewline
(p-val) & (NA ) & (NA ) & (NA ) & (NA ) & (NA ) & (NA ) \tabularnewline
Estimates ( 10 ) & NA & NA & NA & NA & NA & NA \tabularnewline
(p-val) & (NA ) & (NA ) & (NA ) & (NA ) & (NA ) & (NA ) \tabularnewline
Estimates ( 11 ) & NA & NA & NA & NA & NA & NA \tabularnewline
(p-val) & (NA ) & (NA ) & (NA ) & (NA ) & (NA ) & (NA ) \tabularnewline
\hline
\end{tabular}
%Source: https://freestatistics.org/blog/index.php?pk=232422&T=1

[TABLE]
[ROW][C]ARIMA Parameter Estimation and Backward Selection[/C][/ROW]
[ROW][C]Iteration[/C][C]ar1[/C][C]ar2[/C][C]ma1[/C][C]sar1[/C][C]sar2[/C][C]sma1[/C][/ROW]
[ROW][C]Estimates ( 1 )[/C][C]0.24[/C][C]0.2222[/C][C]-0.2215[/C][C]0.3349[/C][C]-0.1666[/C][C]-0.805[/C][/ROW]
[ROW][C](p-val)[/C][C](0.5225 )[/C][C](0.0706 )[/C][C](0.5566 )[/C][C](0.2106 )[/C][C](0.3878 )[/C][C](0.0321 )[/C][/ROW]
[ROW][C]Estimates ( 2 )[/C][C]0.029[/C][C]0.2266[/C][C]0[/C][C]0.3255[/C][C]-0.1977[/C][C]-0.7943[/C][/ROW]
[ROW][C](p-val)[/C][C](0.7896 )[/C][C](0.0572 )[/C][C](NA )[/C][C](0.2138 )[/C][C](0.2759 )[/C][C](0.0314 )[/C][/ROW]
[ROW][C]Estimates ( 3 )[/C][C]0[/C][C]0.228[/C][C]0[/C][C]0.3259[/C][C]-0.2026[/C][C]-0.7839[/C][/ROW]
[ROW][C](p-val)[/C][C](NA )[/C][C](0.0557 )[/C][C](NA )[/C][C](0.2151 )[/C][C](0.2579 )[/C][C](0.0285 )[/C][/ROW]
[ROW][C]Estimates ( 4 )[/C][C]0[/C][C]0.2402[/C][C]0[/C][C]0.4179[/C][C]0[/C][C]-1.0011[/C][/ROW]
[ROW][C](p-val)[/C][C](NA )[/C][C](0.0362 )[/C][C](NA )[/C][C](0.0033 )[/C][C](NA )[/C][C](0.0248 )[/C][/ROW]
[ROW][C]Estimates ( 5 )[/C][C]NA[/C][C]NA[/C][C]NA[/C][C]NA[/C][C]NA[/C][C]NA[/C][/ROW]
[ROW][C](p-val)[/C][C](NA )[/C][C](NA )[/C][C](NA )[/C][C](NA )[/C][C](NA )[/C][C](NA )[/C][/ROW]
[ROW][C]Estimates ( 6 )[/C][C]NA[/C][C]NA[/C][C]NA[/C][C]NA[/C][C]NA[/C][C]NA[/C][/ROW]
[ROW][C](p-val)[/C][C](NA )[/C][C](NA )[/C][C](NA )[/C][C](NA )[/C][C](NA )[/C][C](NA )[/C][/ROW]
[ROW][C]Estimates ( 7 )[/C][C]NA[/C][C]NA[/C][C]NA[/C][C]NA[/C][C]NA[/C][C]NA[/C][/ROW]
[ROW][C](p-val)[/C][C](NA )[/C][C](NA )[/C][C](NA )[/C][C](NA )[/C][C](NA )[/C][C](NA )[/C][/ROW]
[ROW][C]Estimates ( 8 )[/C][C]NA[/C][C]NA[/C][C]NA[/C][C]NA[/C][C]NA[/C][C]NA[/C][/ROW]
[ROW][C](p-val)[/C][C](NA )[/C][C](NA )[/C][C](NA )[/C][C](NA )[/C][C](NA )[/C][C](NA )[/C][/ROW]
[ROW][C]Estimates ( 9 )[/C][C]NA[/C][C]NA[/C][C]NA[/C][C]NA[/C][C]NA[/C][C]NA[/C][/ROW]
[ROW][C](p-val)[/C][C](NA )[/C][C](NA )[/C][C](NA )[/C][C](NA )[/C][C](NA )[/C][C](NA )[/C][/ROW]
[ROW][C]Estimates ( 10 )[/C][C]NA[/C][C]NA[/C][C]NA[/C][C]NA[/C][C]NA[/C][C]NA[/C][/ROW]
[ROW][C](p-val)[/C][C](NA )[/C][C](NA )[/C][C](NA )[/C][C](NA )[/C][C](NA )[/C][C](NA )[/C][/ROW]
[ROW][C]Estimates ( 11 )[/C][C]NA[/C][C]NA[/C][C]NA[/C][C]NA[/C][C]NA[/C][C]NA[/C][/ROW]
[ROW][C](p-val)[/C][C](NA )[/C][C](NA )[/C][C](NA )[/C][C](NA )[/C][C](NA )[/C][C](NA )[/C][/ROW]
[/TABLE]
Source: https://freestatistics.org/blog/index.php?pk=232422&T=1

Globally Unique Identifier (entire table): ba.freestatistics.org/blog/index.php?pk=232422&T=1

As an alternative you can also use a QR Code:  

The GUIDs for individual cells are displayed in the table below:

ARIMA Parameter Estimation and Backward Selection
Iterationar1ar2ma1sar1sar2sma1
Estimates ( 1 )0.240.2222-0.22150.3349-0.1666-0.805
(p-val)(0.5225 )(0.0706 )(0.5566 )(0.2106 )(0.3878 )(0.0321 )
Estimates ( 2 )0.0290.226600.3255-0.1977-0.7943
(p-val)(0.7896 )(0.0572 )(NA )(0.2138 )(0.2759 )(0.0314 )
Estimates ( 3 )00.22800.3259-0.2026-0.7839
(p-val)(NA )(0.0557 )(NA )(0.2151 )(0.2579 )(0.0285 )
Estimates ( 4 )00.240200.41790-1.0011
(p-val)(NA )(0.0362 )(NA )(0.0033 )(NA )(0.0248 )
Estimates ( 5 )NANANANANANA
(p-val)(NA )(NA )(NA )(NA )(NA )(NA )
Estimates ( 6 )NANANANANANA
(p-val)(NA )(NA )(NA )(NA )(NA )(NA )
Estimates ( 7 )NANANANANANA
(p-val)(NA )(NA )(NA )(NA )(NA )(NA )
Estimates ( 8 )NANANANANANA
(p-val)(NA )(NA )(NA )(NA )(NA )(NA )
Estimates ( 9 )NANANANANANA
(p-val)(NA )(NA )(NA )(NA )(NA )(NA )
Estimates ( 10 )NANANANANANA
(p-val)(NA )(NA )(NA )(NA )(NA )(NA )
Estimates ( 11 )NANANANANANA
(p-val)(NA )(NA )(NA )(NA )(NA )(NA )


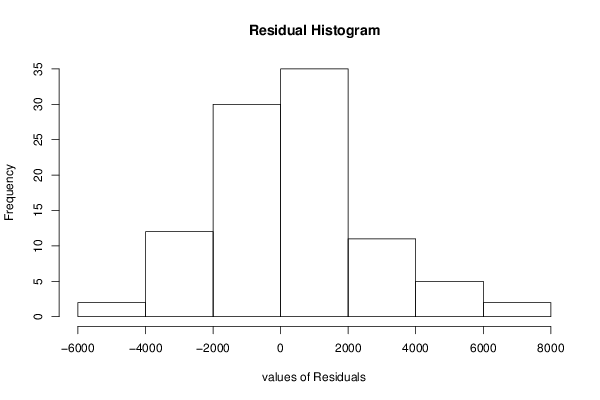
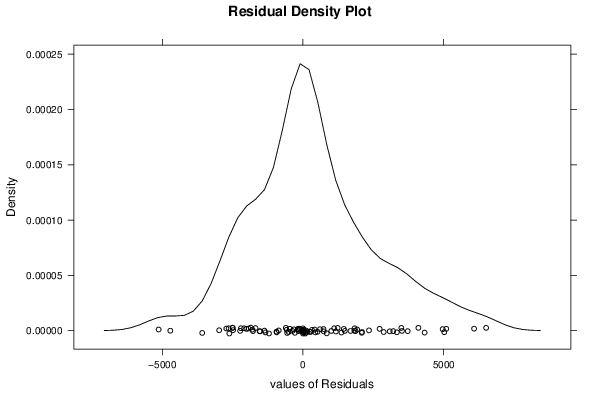
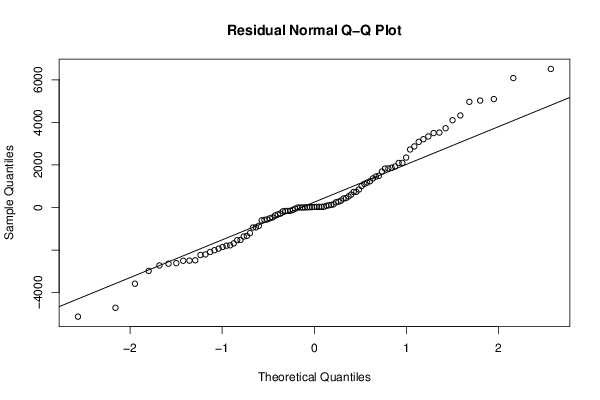
Estimated ARIMA Residuals
Value
-509.209747324231
-2234.51240535904
6510.96208302559
-1796.74607008503
-2009.47151623521
604.147756858646
-3583.0017130358
-2483.89542767683
518.142041705935
418.467698011994
-4716.67735128997
4965.76510819978
3336.89792453856
4102.70855324382
13.8621755069702
-113.65049220311
-288.388016049003
1107.17431390744
-2505.12592891552
3520.2808441047
-1856.76800555509
-2499.0840735785
2346.58814913919
2091.3967822958
5094.32614505207
3209.91812546848
3497.29730154538
1867.24058379238
4324.69607751491
-609.662451741188
-1336.22359521316
1232.2464500507
-1934.53925623562
1366.12055505238
149.839003216163
-934.40015442193
1488.48183549695
3723.45381608104
-1207.85691536752
-1540.40512981174
-2618.29465062346
-2725.83127000367
-374.060140378226
101.285400816888
-163.047655848969
-1367.41041181247
24.5529537896983
-582.293848320443
438.663819307319
-2643.69285621342
1927.80145692327
242.720390579358
1835.67167410971
-184.306943964761
844.921194187068
-1688.5712540004
-1778.00869564709
1690.34609387795
1006.19858281735
1450.38231691608
2096.81736129266
118.819865764992
5023.6083617235
1827.763553789
-2979.86310569907
-1528.20190212709
2869.51354299082
737.409190677288
-5131.92937159629
6082.43308274994
2724.7551784236
270.329912427514
-561.998768866118
-862.390847543715
-469.351673982212
-157.305574362058
1167.92444371862
318.57607804618
-943.514070834687
-2091.37043212954
730.407533256489
-2206.24634076163
3083.71633377554
-162.095998724052
-326.048400645533

\begin{tabular}{lllllllll}
\hline
Estimated ARIMA Residuals \tabularnewline
Value \tabularnewline
-509.209747324231 \tabularnewline
-2234.51240535904 \tabularnewline
6510.96208302559 \tabularnewline
-1796.74607008503 \tabularnewline
-2009.47151623521 \tabularnewline
604.147756858646 \tabularnewline
-3583.0017130358 \tabularnewline
-2483.89542767683 \tabularnewline
518.142041705935 \tabularnewline
418.467698011994 \tabularnewline
-4716.67735128997 \tabularnewline
4965.76510819978 \tabularnewline
3336.89792453856 \tabularnewline
4102.70855324382 \tabularnewline
13.8621755069702 \tabularnewline
-113.65049220311 \tabularnewline
-288.388016049003 \tabularnewline
1107.17431390744 \tabularnewline
-2505.12592891552 \tabularnewline
3520.2808441047 \tabularnewline
-1856.76800555509 \tabularnewline
-2499.0840735785 \tabularnewline
2346.58814913919 \tabularnewline
2091.3967822958 \tabularnewline
5094.32614505207 \tabularnewline
3209.91812546848 \tabularnewline
3497.29730154538 \tabularnewline
1867.24058379238 \tabularnewline
4324.69607751491 \tabularnewline
-609.662451741188 \tabularnewline
-1336.22359521316 \tabularnewline
1232.2464500507 \tabularnewline
-1934.53925623562 \tabularnewline
1366.12055505238 \tabularnewline
149.839003216163 \tabularnewline
-934.40015442193 \tabularnewline
1488.48183549695 \tabularnewline
3723.45381608104 \tabularnewline
-1207.85691536752 \tabularnewline
-1540.40512981174 \tabularnewline
-2618.29465062346 \tabularnewline
-2725.83127000367 \tabularnewline
-374.060140378226 \tabularnewline
101.285400816888 \tabularnewline
-163.047655848969 \tabularnewline
-1367.41041181247 \tabularnewline
24.5529537896983 \tabularnewline
-582.293848320443 \tabularnewline
438.663819307319 \tabularnewline
-2643.69285621342 \tabularnewline
1927.80145692327 \tabularnewline
242.720390579358 \tabularnewline
1835.67167410971 \tabularnewline
-184.306943964761 \tabularnewline
844.921194187068 \tabularnewline
-1688.5712540004 \tabularnewline
-1778.00869564709 \tabularnewline
1690.34609387795 \tabularnewline
1006.19858281735 \tabularnewline
1450.38231691608 \tabularnewline
2096.81736129266 \tabularnewline
118.819865764992 \tabularnewline
5023.6083617235 \tabularnewline
1827.763553789 \tabularnewline
-2979.86310569907 \tabularnewline
-1528.20190212709 \tabularnewline
2869.51354299082 \tabularnewline
737.409190677288 \tabularnewline
-5131.92937159629 \tabularnewline
6082.43308274994 \tabularnewline
2724.7551784236 \tabularnewline
270.329912427514 \tabularnewline
-561.998768866118 \tabularnewline
-862.390847543715 \tabularnewline
-469.351673982212 \tabularnewline
-157.305574362058 \tabularnewline
1167.92444371862 \tabularnewline
318.57607804618 \tabularnewline
-943.514070834687 \tabularnewline
-2091.37043212954 \tabularnewline
730.407533256489 \tabularnewline
-2206.24634076163 \tabularnewline
3083.71633377554 \tabularnewline
-162.095998724052 \tabularnewline
-326.048400645533 \tabularnewline
\hline
\end{tabular}
%Source: https://freestatistics.org/blog/index.php?pk=232422&T=2

[TABLE]
[ROW][C]Estimated ARIMA Residuals[/C][/ROW]
[ROW][C]Value[/C][/ROW]
[ROW][C]-509.209747324231[/C][/ROW]
[ROW][C]-2234.51240535904[/C][/ROW]
[ROW][C]6510.96208302559[/C][/ROW]
[ROW][C]-1796.74607008503[/C][/ROW]
[ROW][C]-2009.47151623521[/C][/ROW]
[ROW][C]604.147756858646[/C][/ROW]
[ROW][C]-3583.0017130358[/C][/ROW]
[ROW][C]-2483.89542767683[/C][/ROW]
[ROW][C]518.142041705935[/C][/ROW]
[ROW][C]418.467698011994[/C][/ROW]
[ROW][C]-4716.67735128997[/C][/ROW]
[ROW][C]4965.76510819978[/C][/ROW]
[ROW][C]3336.89792453856[/C][/ROW]
[ROW][C]4102.70855324382[/C][/ROW]
[ROW][C]13.8621755069702[/C][/ROW]
[ROW][C]-113.65049220311[/C][/ROW]
[ROW][C]-288.388016049003[/C][/ROW]
[ROW][C]1107.17431390744[/C][/ROW]
[ROW][C]-2505.12592891552[/C][/ROW]
[ROW][C]3520.2808441047[/C][/ROW]
[ROW][C]-1856.76800555509[/C][/ROW]
[ROW][C]-2499.0840735785[/C][/ROW]
[ROW][C]2346.58814913919[/C][/ROW]
[ROW][C]2091.3967822958[/C][/ROW]
[ROW][C]5094.32614505207[/C][/ROW]
[ROW][C]3209.91812546848[/C][/ROW]
[ROW][C]3497.29730154538[/C][/ROW]
[ROW][C]1867.24058379238[/C][/ROW]
[ROW][C]4324.69607751491[/C][/ROW]
[ROW][C]-609.662451741188[/C][/ROW]
[ROW][C]-1336.22359521316[/C][/ROW]
[ROW][C]1232.2464500507[/C][/ROW]
[ROW][C]-1934.53925623562[/C][/ROW]
[ROW][C]1366.12055505238[/C][/ROW]
[ROW][C]149.839003216163[/C][/ROW]
[ROW][C]-934.40015442193[/C][/ROW]
[ROW][C]1488.48183549695[/C][/ROW]
[ROW][C]3723.45381608104[/C][/ROW]
[ROW][C]-1207.85691536752[/C][/ROW]
[ROW][C]-1540.40512981174[/C][/ROW]
[ROW][C]-2618.29465062346[/C][/ROW]
[ROW][C]-2725.83127000367[/C][/ROW]
[ROW][C]-374.060140378226[/C][/ROW]
[ROW][C]101.285400816888[/C][/ROW]
[ROW][C]-163.047655848969[/C][/ROW]
[ROW][C]-1367.41041181247[/C][/ROW]
[ROW][C]24.5529537896983[/C][/ROW]
[ROW][C]-582.293848320443[/C][/ROW]
[ROW][C]438.663819307319[/C][/ROW]
[ROW][C]-2643.69285621342[/C][/ROW]
[ROW][C]1927.80145692327[/C][/ROW]
[ROW][C]242.720390579358[/C][/ROW]
[ROW][C]1835.67167410971[/C][/ROW]
[ROW][C]-184.306943964761[/C][/ROW]
[ROW][C]844.921194187068[/C][/ROW]
[ROW][C]-1688.5712540004[/C][/ROW]
[ROW][C]-1778.00869564709[/C][/ROW]
[ROW][C]1690.34609387795[/C][/ROW]
[ROW][C]1006.19858281735[/C][/ROW]
[ROW][C]1450.38231691608[/C][/ROW]
[ROW][C]2096.81736129266[/C][/ROW]
[ROW][C]118.819865764992[/C][/ROW]
[ROW][C]5023.6083617235[/C][/ROW]
[ROW][C]1827.763553789[/C][/ROW]
[ROW][C]-2979.86310569907[/C][/ROW]
[ROW][C]-1528.20190212709[/C][/ROW]
[ROW][C]2869.51354299082[/C][/ROW]
[ROW][C]737.409190677288[/C][/ROW]
[ROW][C]-5131.92937159629[/C][/ROW]
[ROW][C]6082.43308274994[/C][/ROW]
[ROW][C]2724.7551784236[/C][/ROW]
[ROW][C]270.329912427514[/C][/ROW]
[ROW][C]-561.998768866118[/C][/ROW]
[ROW][C]-862.390847543715[/C][/ROW]
[ROW][C]-469.351673982212[/C][/ROW]
[ROW][C]-157.305574362058[/C][/ROW]
[ROW][C]1167.92444371862[/C][/ROW]
[ROW][C]318.57607804618[/C][/ROW]
[ROW][C]-943.514070834687[/C][/ROW]
[ROW][C]-2091.37043212954[/C][/ROW]
[ROW][C]730.407533256489[/C][/ROW]
[ROW][C]-2206.24634076163[/C][/ROW]
[ROW][C]3083.71633377554[/C][/ROW]
[ROW][C]-162.095998724052[/C][/ROW]
[ROW][C]-326.048400645533[/C][/ROW]
[/TABLE]
Source: https://freestatistics.org/blog/index.php?pk=232422&T=2

Globally Unique Identifier (entire table): ba.freestatistics.org/blog/index.php?pk=232422&T=2

As an alternative you can also use a QR Code:  

The GUIDs for individual cells are displayed in the table below:

Estimated ARIMA Residuals
Value
-509.209747324231
-2234.51240535904
6510.96208302559
-1796.74607008503
-2009.47151623521
604.147756858646
-3583.0017130358
-2483.89542767683
518.142041705935
418.467698011994
-4716.67735128997
4965.76510819978
3336.89792453856
4102.70855324382
13.8621755069702
-113.65049220311
-288.388016049003
1107.17431390744
-2505.12592891552
3520.2808441047
-1856.76800555509
-2499.0840735785
2346.58814913919
2091.3967822958
5094.32614505207
3209.91812546848
3497.29730154538
1867.24058379238
4324.69607751491
-609.662451741188
-1336.22359521316
1232.2464500507
-1934.53925623562
1366.12055505238
149.839003216163
-934.40015442193
1488.48183549695
3723.45381608104
-1207.85691536752
-1540.40512981174
-2618.29465062346
-2725.83127000367
-374.060140378226
101.285400816888
-163.047655848969
-1367.41041181247
24.5529537896983
-582.293848320443
438.663819307319
-2643.69285621342
1927.80145692327
242.720390579358
1835.67167410971
-184.306943964761
844.921194187068
-1688.5712540004
-1778.00869564709
1690.34609387795
1006.19858281735
1450.38231691608
2096.81736129266
118.819865764992
5023.6083617235
1827.763553789
-2979.86310569907
-1528.20190212709
2869.51354299082
737.409190677288
-5131.92937159629
6082.43308274994
2724.7551784236
270.329912427514
-561.998768866118
-862.390847543715
-469.351673982212
-157.305574362058
1167.92444371862
318.57607804618
-943.514070834687
-2091.37043212954
730.407533256489
-2206.24634076163
3083.71633377554
-162.095998724052
-326.048400645533


Parameters (Session):
par1 = FALSE ; par2 = 1 ; par3 = 1 ; par4 = 1 ; par5 = 12 ; par6 = 2 ; par7 = 1 ; par8 = 2 ; par9 = 1 ;
Parameters (R input):
par1 = FALSE ; par2 = 1 ; par3 = 1 ; par4 = 1 ; par5 = 12 ; par6 = 2 ; par7 = 1 ; par8 = 2 ; par9 = 1 ;
R code (references can be found in the software module):
par9 <- '1'
par8 <- '2'
par7 <- '1'
par6 <- '3'
par5 <- '12'
par4 <- '1'
par3 <- '1'
par2 <- '1'
par1 <- 'FALSE'
library(lattice)
if (par1 == 'TRUE') par1 <- TRUE
if (par1 == 'FALSE') par1 <- FALSE
par2 <- as.numeric(par2) #Box-Cox lambda transformation parameter
par3 <- as.numeric(par3) #degree of non-seasonal differencing
par4 <- as.numeric(par4) #degree of seasonal differencing
par5 <- as.numeric(par5) #seasonal period
par6 <- as.numeric(par6) #degree (p) of the non-seasonal AR(p) polynomial
par7 <- as.numeric(par7) #degree (q) of the non-seasonal MA(q) polynomial
par8 <- as.numeric(par8) #degree (P) of the seasonal AR(P) polynomial
par9 <- as.numeric(par9) #degree (Q) of the seasonal MA(Q) polynomial
armaGR <- function(arima.out, names, n){
try1 <- arima.out$coef
try2 <- sqrt(diag(arima.out$var.coef))
try.data.frame <- data.frame(matrix(NA,ncol=4,nrow=length(names)))
dimnames(try.data.frame) <- list(names,c('coef','std','tstat','pv'))
try.data.frame[,1] <- try1
for(i in 1:length(try2)) try.data.frame[which(rownames(try.data.frame)==names(try2)[i]),2] <- try2[i]
try.data.frame[,3] <- try.data.frame[,1] / try.data.frame[,2]
try.data.frame[,4] <- round((1-pt(abs(try.data.frame[,3]),df=n-(length(try2)+1)))*2,5)
vector <- rep(NA,length(names))
vector[is.na(try.data.frame[,4])] <- 0
maxi <- which.max(try.data.frame[,4])
continue <- max(try.data.frame[,4],na.rm=TRUE) > .05
vector[maxi] <- 0
list(summary=try.data.frame,next.vector=vector,continue=continue)
}
arimaSelect <- function(series, order=c(13,0,0), seasonal=list(order=c(2,0,0),period=12), include.mean=F){
nrc <- order[1]+order[3]+seasonal$order[1]+seasonal$order[3]
coeff <- matrix(NA, nrow=nrc*2, ncol=nrc)
pval <- matrix(NA, nrow=nrc*2, ncol=nrc)
mylist <- rep(list(NULL), nrc)
names <- NULL
if(order[1] > 0) names <- paste('ar',1:order[1],sep='')
if(order[3] > 0) names <- c( names , paste('ma',1:order[3],sep='') )
if(seasonal$order[1] > 0) names <- c(names, paste('sar',1:seasonal$order[1],sep=''))
if(seasonal$order[3] > 0) names <- c(names, paste('sma',1:seasonal$order[3],sep=''))
arima.out <- arima(series, order=order, seasonal=seasonal, include.mean=include.mean, method='ML')
mylist[[1]] <- arima.out
last.arma <- armaGR(arima.out, names, length(series))
mystop <- FALSE
i <- 1
coeff[i,] <- last.arma[[1]][,1]
pval [i,] <- last.arma[[1]][,4]
i <- 2
aic <- arima.out$aic
while(!mystop){
mylist[[i]] <- arima.out
arima.out <- arima(series, order=order, seasonal=seasonal, include.mean=include.mean, method='ML', fixed=last.arma$next.vector)
aic <- c(aic, arima.out$aic)
last.arma <- armaGR(arima.out, names, length(series))
mystop <- !last.arma$continue
coeff[i,] <- last.arma[[1]][,1]
pval [i,] <- last.arma[[1]][,4]
i <- i+1
}
list(coeff, pval, mylist, aic=aic)
}
arimaSelectplot <- function(arimaSelect.out,noms,choix){
noms <- names(arimaSelect.out[[3]][[1]]$coef)
coeff <- arimaSelect.out[[1]]
k <- min(which(is.na(coeff[,1])))-1
coeff <- coeff[1:k,]
pval <- arimaSelect.out[[2]][1:k,]
aic <- arimaSelect.out$aic[1:k]
coeff[coeff==0] <- NA
n <- ncol(coeff)
if(missing(choix)) choix <- k
layout(matrix(c(1,1,1,2,
3,3,3,2,
3,3,3,4,
5,6,7,7),nr=4),
widths=c(10,35,45,15),
heights=c(30,30,15,15))
couleurs <- rainbow(75)[1:50]#(50)
ticks <- pretty(coeff)
par(mar=c(1,1,3,1))
plot(aic,k:1-.5,type='o',pch=21,bg='blue',cex=2,axes=F,lty=2,xpd=NA)
points(aic[choix],k-choix+.5,pch=21,cex=4,bg=2,xpd=NA)
title('aic',line=2)
par(mar=c(3,0,0,0))
plot(0,axes=F,xlab='',ylab='',xlim=range(ticks),ylim=c(.1,1))
rect(xleft = min(ticks) + (0:49)/50*(max(ticks)-min(ticks)),
xright = min(ticks) + (1:50)/50*(max(ticks)-min(ticks)),
ytop = rep(1,50),
ybottom= rep(0,50),col=couleurs,border=NA)
axis(1,ticks)
rect(xleft=min(ticks),xright=max(ticks),ytop=1,ybottom=0)
text(mean(coeff,na.rm=T),.5,'coefficients',cex=2,font=2)
par(mar=c(1,1,3,1))
image(1:n,1:k,t(coeff[k:1,]),axes=F,col=couleurs,zlim=range(ticks))
for(i in 1:n) for(j in 1:k) if(!is.na(coeff[j,i])) {
if(pval[j,i]<.01) symb = 'green'
else if( (pval[j,i]<.05) & (pval[j,i]>=.01)) symb = 'orange'
else if( (pval[j,i]<.1) & (pval[j,i]>=.05)) symb = 'red'
else symb = 'black'
polygon(c(i+.5 ,i+.2 ,i+.5 ,i+.5),
c(k-j+0.5,k-j+0.5,k-j+0.8,k-j+0.5),
col=symb)
if(j==choix) {
rect(xleft=i-.5,
xright=i+.5,
ybottom=k-j+1.5,
ytop=k-j+.5,
lwd=4)
text(i,
k-j+1,
round(coeff[j,i],2),
cex=1.2,
font=2)
}
else{
rect(xleft=i-.5,xright=i+.5,ybottom=k-j+1.5,ytop=k-j+.5)
text(i,k-j+1,round(coeff[j,i],2),cex=1.2,font=1)
}
}
axis(3,1:n,noms)
par(mar=c(0.5,0,0,0.5))
plot(0,axes=F,xlab='',ylab='',type='n',xlim=c(0,8),ylim=c(-.2,.8))
cols <- c('green','orange','red','black')
niv <- c('0','0.01','0.05','0.1')
for(i in 0:3){
polygon(c(1+2*i ,1+2*i ,1+2*i-.5 ,1+2*i),
c(.4 ,.7 , .4 , .4),
col=cols[i+1])
text(2*i,0.5,niv[i+1],cex=1.5)
}
text(8,.5,1,cex=1.5)
text(4,0,'p-value',cex=2)
box()
residus <- arimaSelect.out[[3]][[choix]]$res
par(mar=c(1,2,4,1))
acf(residus,main='')
title('acf',line=.5)
par(mar=c(1,2,4,1))
pacf(residus,main='')
title('pacf',line=.5)
par(mar=c(2,2,4,1))
qqnorm(residus,main='')
title('qq-norm',line=.5)
qqline(residus)
residus
}
if (par2 == 0) x <- log(x)
if (par2 != 0) x <- x^par2
(selection <- arimaSelect(x, order=c(par6,par3,par7), seasonal=list(order=c(par8,par4,par9), period=par5)))
bitmap(file='test1.png')
resid <- arimaSelectplot(selection)
dev.off()
resid
bitmap(file='test2.png')
acf(resid,length(resid)/2, main='Residual Autocorrelation Function')
dev.off()
bitmap(file='test3.png')
pacf(resid,length(resid)/2, main='Residual Partial Autocorrelation Function')
dev.off()
bitmap(file='test4.png')
cpgram(resid, main='Residual Cumulative Periodogram')
dev.off()
bitmap(file='test5.png')
hist(resid, main='Residual Histogram', xlab='values of Residuals')
dev.off()
bitmap(file='test6.png')
densityplot(~resid,col='black',main='Residual Density Plot', xlab='values of Residuals')
dev.off()
bitmap(file='test7.png')
qqnorm(resid, main='Residual Normal Q-Q Plot')
qqline(resid)
dev.off()
ncols <- length(selection[[1]][1,])
nrows <- length(selection[[2]][,1])-1
load(file='createtable')
a<-table.start()
a<-table.row.start(a)
a<-table.element(a,'ARIMA Parameter Estimation and Backward Selection', ncols+1,TRUE)
a<-table.row.end(a)
a<-table.row.start(a)
a<-table.element(a,'Iteration', header=TRUE)
for (i in 1:ncols) {
a<-table.element(a,names(selection[[3]][[1]]$coef)[i],header=TRUE)
}
a<-table.row.end(a)
for (j in 1:nrows) {
a<-table.row.start(a)
mydum <- 'Estimates ('
mydum <- paste(mydum,j)
mydum <- paste(mydum,')')
a<-table.element(a,mydum, header=TRUE)
for (i in 1:ncols) {
a<-table.element(a,round(selection[[1]][j,i],4))
}
a<-table.row.end(a)
a<-table.row.start(a)
a<-table.element(a,'(p-val)', header=TRUE)
for (i in 1:ncols) {
mydum <- '('
mydum <- paste(mydum,round(selection[[2]][j,i],4),sep='')
mydum <- paste(mydum,')')
a<-table.element(a,mydum)
}
a<-table.row.end(a)
}
a<-table.end(a)
table.save(a,file='mytable.tab')
a<-table.start()
a<-table.row.start(a)
a<-table.element(a,'Estimated ARIMA Residuals', 1,TRUE)
a<-table.row.end(a)
a<-table.row.start(a)
a<-table.element(a,'Value', 1,TRUE)
a<-table.row.end(a)
for (i in (par4*par5+par3):length(resid)) {
a<-table.row.start(a)
a<-table.element(a,resid[i])
a<-table.row.end(a)
}
a<-table.end(a)
table.save(a,file='mytable1.tab')