Free Statistics
of Irreproducible Research!
Description of Statistical Computation | |||||||||||||||||||||||||||||||||||||||||||||||||||||||||||||||||||||||||||||||||||||||||||||||||||
|---|---|---|---|---|---|---|---|---|---|---|---|---|---|---|---|---|---|---|---|---|---|---|---|---|---|---|---|---|---|---|---|---|---|---|---|---|---|---|---|---|---|---|---|---|---|---|---|---|---|---|---|---|---|---|---|---|---|---|---|---|---|---|---|---|---|---|---|---|---|---|---|---|---|---|---|---|---|---|---|---|---|---|---|---|---|---|---|---|---|---|---|---|---|---|---|---|---|---|---|
| Author's title | |||||||||||||||||||||||||||||||||||||||||||||||||||||||||||||||||||||||||||||||||||||||||||||||||||
| Author | *The author of this computation has been verified* | ||||||||||||||||||||||||||||||||||||||||||||||||||||||||||||||||||||||||||||||||||||||||||||||||||
| R Software Module | rwasp_correlation.wasp | ||||||||||||||||||||||||||||||||||||||||||||||||||||||||||||||||||||||||||||||||||||||||||||||||||
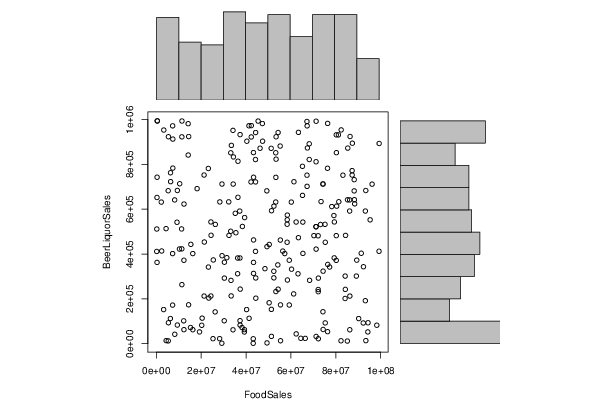
| Title produced by software | Pearson Correlation | ||||||||||||||||||||||||||||||||||||||||||||||||||||||||||||||||||||||||||||||||||||||||||||||||||
| Date of computation | Mon, 16 Dec 2013 15:49:25 -0500 | ||||||||||||||||||||||||||||||||||||||||||||||||||||||||||||||||||||||||||||||||||||||||||||||||||
| Cite this page as follows | Statistical Computations at FreeStatistics.org, Office for Research Development and Education, URL https://freestatistics.org/blog/index.php?v=date/2013/Dec/16/t1387226973kyo5c3s6f9z2z37.htm/, Retrieved Mon, 30 Jun 2025 23:11:32 +0000 | ||||||||||||||||||||||||||||||||||||||||||||||||||||||||||||||||||||||||||||||||||||||||||||||||||
| Statistical Computations at FreeStatistics.org, Office for Research Development and Education, URL https://freestatistics.org/blog/index.php?pk=232397, Retrieved Mon, 30 Jun 2025 23:11:32 +0000 | |||||||||||||||||||||||||||||||||||||||||||||||||||||||||||||||||||||||||||||||||||||||||||||||||||
| QR Codes: | |||||||||||||||||||||||||||||||||||||||||||||||||||||||||||||||||||||||||||||||||||||||||||||||||||
|
| |||||||||||||||||||||||||||||||||||||||||||||||||||||||||||||||||||||||||||||||||||||||||||||||||||
| Original text written by user: | |||||||||||||||||||||||||||||||||||||||||||||||||||||||||||||||||||||||||||||||||||||||||||||||||||
| IsPrivate? | No (this computation is public) | ||||||||||||||||||||||||||||||||||||||||||||||||||||||||||||||||||||||||||||||||||||||||||||||||||
| User-defined keywords | |||||||||||||||||||||||||||||||||||||||||||||||||||||||||||||||||||||||||||||||||||||||||||||||||||
| Estimated Impact | 236 | ||||||||||||||||||||||||||||||||||||||||||||||||||||||||||||||||||||||||||||||||||||||||||||||||||
Tree of Dependent Computations | |||||||||||||||||||||||||||||||||||||||||||||||||||||||||||||||||||||||||||||||||||||||||||||||||||
| Family? (F = Feedback message, R = changed R code, M = changed R Module, P = changed Parameters, D = changed Data) | |||||||||||||||||||||||||||||||||||||||||||||||||||||||||||||||||||||||||||||||||||||||||||||||||||
| - [Pearson Correlation] [] [2013-12-16 20:49:25] [9e6a405f514733ea23d87e4507d39d29] [Current] | |||||||||||||||||||||||||||||||||||||||||||||||||||||||||||||||||||||||||||||||||||||||||||||||||||
| Feedback Forum | |||||||||||||||||||||||||||||||||||||||||||||||||||||||||||||||||||||||||||||||||||||||||||||||||||
Post a new message | |||||||||||||||||||||||||||||||||||||||||||||||||||||||||||||||||||||||||||||||||||||||||||||||||||
Dataset | |||||||||||||||||||||||||||||||||||||||||||||||||||||||||||||||||||||||||||||||||||||||||||||||||||
| Dataseries X: | |||||||||||||||||||||||||||||||||||||||||||||||||||||||||||||||||||||||||||||||||||||||||||||||||||
67146376 72147079 84159336 72163669 34170068 65168663 67169890 68170364 79164617 68173655 63171547 75208838 54153221 65150087 85170439 37176456 34182231 60181535 72183682 23183318 18177406 86182737 86187443 28224540 33161349 162841 14192319 71189569 29194927 83197946 71193355 96202388 81193954 42197956 93202520 72241111 89175344 8172138 44201279 93196039 80210478 38211844 12203411 78214248 2202122 14204044 9212190 71247491 33185019 43192380 73212110 43211718 72226936 55217511 67218111 85226062 44209250 8222663 80223953 19258081 200389 84197556 23225133 88220329 15234190 88227365 36231521 61235252 90222807 53232251 80228284 32271054 51207853 35203863 44230313 20234503 46245027 16244067 40241431 71240462 53231243 3244234 7240991 51288969 71218126 26220650 7253550 57250783 25262113 44260918 29262051 7265089 67253905 36258040 84264106 44317659 71236422 11250580 12279515 39264417 37283706 281288 74271146 86283944 92269155 59270899 59276507 3319958 86250746 70247772 80280449 34274925 94296013 39287881 74279098 50294763 16261924 99291596 5287537 43326202 77255598 6253086 60285261 33284747 29300402 41288854 53295433 65307256 47273189 12287540 21290705 7337006 30268335 49259060 26293703 54294262 5312404 10301014 58309942 24317079 21293912 75304060 28301299 62357634 55281493 53282478 75319111 37315223 6328445 74321081 62328040 43326362 313566 95319768 76324315 387243 87293308 98295109 30339190 50335678 43345401 89351002 63351889 65355773 68333363 336214 37343910 36405788 88318682 87314189 39362141 85351811 52373727 33366795 84362393 55376006 37346423 44349007 9357224 14418473 42329169 51323456 76374439 58358806 94391816 11376944 74372665 5388357 41354241 6368982 15378233 426699 61343241 43344577 38373623 11369688 53398816 53379387 5384666 34383879 42351578 92350920 4336629 86385504 79311345 43300589 49329806 12331186 40349193 11345933 76349588 81354942 24326138 30340151 49340992 87402229 58316127 54312513 55362497 51358296 91367552 67360583 9363815 14364503 99347868 74357197 47367894 48429102 82337608 7339459 32389616 45383323 66394799 23391511 52387259 25397392 2377707 4382545 21394377 33455526 63358313 56376066 76418324 37397263 52423323 10405484 80400379 31422544 93390169 24404534 20416397 35468589 36380949 79379466 11427702 93414637 58444370 82421600 88429292 73443064 58403043 64422953 | |||||||||||||||||||||||||||||||||||||||||||||||||||||||||||||||||||||||||||||||||||||||||||||||||||
| Dataseries Y: | |||||||||||||||||||||||||||||||||||||||||||||||||||||||||||||||||||||||||||||||||||||||||||||||||||
991509 481541 201597 241675 951822 661775 751912 891862 571770 821882 311831 532511 351614 791529 11678 591713 61796 631792 231950 781777 691707 641757 591782 22443 501548 411505 981714 521757 1830 751857 521981 711858 931823 721806 591845 292577 301555 641501 821725 191699 371807 71863 101886 611861 631845 841788 541879 992598 851679 1652 531837 21798 21957 881958 702034 642062 411781 41860 931992 52547 511706 301621 341853 681817 72060 732002 312098 222079 111892 632050 482082 632821 871846 581768 721894 81963 872140 402059 152209 32118 852031 152163 172154 153037 811866 141808 401986 402099 22210 942145 712339 972140 972126 382219 242273 293265 421920 511976 372190 52132 382357 652413 712463 212422 92358 372352 172549 953375 62109 482052 852327 712231 52470 62526 142483 182518 62316 412409 682638 313542 342114 112109 332366 282300 392569 972486 232568 542595 982297 62401 752601 783488 102121 682046 532273 942333 12576 422433 452611 212660 212461 92641 632660 43654 462293 742219 452398 102553 762685 712643 542867 362622 362618 552727 782763 993801 772219 82316 292530 442640 742709 372783 472924 402791 282784 742801 932933 814137 642424 752519 562753 872791 323017 213055 483117 13024 82997 202913 83137 924269 922569 32603 983005 552867 93262 263364 63322 93292 113057 723087 443297 994403 722676 462808 522991 922999 923423 823282 923520 833475 973152 343352 513386 924458 382914 852783 433026 623132 903471 423310 53560 633403 543267 363429 3359 894629 532879 242917 173215 593311 403468 873440 683661 173459 893372 323505 903535 334698 12904 913003 483270 993385 23495 203574 293764 373595 413533 13527 453655 884898 942985 413186 353529 243386 613758 713788 613707 383727 683484 483610 113857 495117 653171 543252 993675 13566 284097 953941 624143 634217 573770 23920 | |||||||||||||||||||||||||||||||||||||||||||||||||||||||||||||||||||||||||||||||||||||||||||||||||||
Tables (Output of Computation) | |||||||||||||||||||||||||||||||||||||||||||||||||||||||||||||||||||||||||||||||||||||||||||||||||||
| |||||||||||||||||||||||||||||||||||||||||||||||||||||||||||||||||||||||||||||||||||||||||||||||||||
Figures (Output of Computation) | |||||||||||||||||||||||||||||||||||||||||||||||||||||||||||||||||||||||||||||||||||||||||||||||||||
Input Parameters & R Code | |||||||||||||||||||||||||||||||||||||||||||||||||||||||||||||||||||||||||||||||||||||||||||||||||||
| Parameters (Session): | |||||||||||||||||||||||||||||||||||||||||||||||||||||||||||||||||||||||||||||||||||||||||||||||||||
| Parameters (R input): | |||||||||||||||||||||||||||||||||||||||||||||||||||||||||||||||||||||||||||||||||||||||||||||||||||
| R code (references can be found in the software module): | |||||||||||||||||||||||||||||||||||||||||||||||||||||||||||||||||||||||||||||||||||||||||||||||||||
x <- x[!is.na(y)] | |||||||||||||||||||||||||||||||||||||||||||||||||||||||||||||||||||||||||||||||||||||||||||||||||||