Free Statistics

of Irreproducible Research!

Author's title

Author*Unverified author*
R Software Modulerwasp_autocorrelation.wasp
Title produced by software(Partial) Autocorrelation Function
Date of computationSat, 14 Dec 2013 06:27:28 -0500
Cite this page as followsStatistical Computations at FreeStatistics.org, Office for Research Development and Education, URL https://freestatistics.org/blog/index.php?v=date/2013/Dec/14/t1387020488l770gp5urycavvd.htm/, Retrieved Tue, 16 Apr 2024 08:57:56 +0000
Statistical Computations at FreeStatistics.org, Office for Research Development and Education, URL https://freestatistics.org/blog/index.php?pk=232312, Retrieved Tue, 16 Apr 2024 08:57:56 +0000
QR Codes:

Original text written by user:
IsPrivate?No (this computation is public)
User-defined keywords
Estimated Impact164
Family? (F = Feedback message, R = changed R code, M = changed R Module, P = changed Parameters, D = changed Data)
-     [Mean Plot] [] [2013-10-16 10:19:37] [08d009098002cb6f4cea01adb17dbd84]
-   PD  [Mean Plot] [] [2013-12-14 11:02:38] [0b3be05215961a0fa3a77d7bd3c5f728]
- RMP       [(Partial) Autocorrelation Function] [] [2013-12-14 11:27:28] [998078bdc1a977f0c7d195eebcf8b96b] [Current]
- R PD        [(Partial) Autocorrelation Function] [] [2013-12-14 11:30:45] [0b3be05215961a0fa3a77d7bd3c5f728]
Feedback Forum

Post a new message
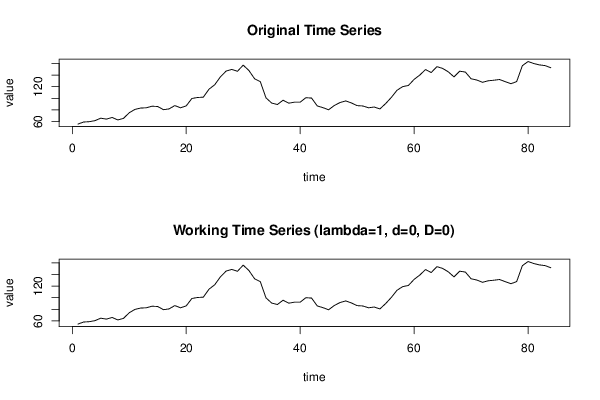
Dataseries X:
55,7
59,2
59,8
61,6
65,8
64,2
67
62,8
65,5
75,2
80,9
83,2
83,7
86,4
85,9
80,4
81,8
87,5
83,7
87
99,7
101,4
101,9
115,7
123,2
136,9
146,8
149,6
146,5
157
147,9
133,6
128,7
100,8
91,8
89,3
96,7
91,6
93,3
93,3
101
100,4
86,9
83,9
80,3
87,7
92,7
95,5
92
87,4
86,8
83,7
85
81,7
90,9
101,5
113,8
120,1
122,1
132,5
140
149,4
144,3
154,4
151,4
145,5
136,8
146,6
145,1
133,6
131,4
127,5
130,1
131,1
132,3
128,6
125,1
128,7
156,1
163,2
159,8
157,4
156,2
152,5


Summary of computational transaction
Raw Inputview raw input (R code)
Raw Outputview raw output of R engine
Computing time5 seconds
R Server'Gertrude Mary Cox' @ cox.wessa.net

\begin{tabular}{lllllllll}
\hline
Summary of computational transaction \tabularnewline
Raw Input & view raw input (R code)  \tabularnewline
Raw Output & view raw output of R engine  \tabularnewline
Computing time & 5 seconds \tabularnewline
R Server & 'Gertrude Mary Cox' @ cox.wessa.net \tabularnewline
\hline
\end{tabular}
%Source: https://freestatistics.org/blog/index.php?pk=232312&T=0

[TABLE]
[ROW][C]Summary of computational transaction[/C][/ROW]
[ROW][C]Raw Input[/C][C]view raw input (R code) [/C][/ROW]
[ROW][C]Raw Output[/C][C]view raw output of R engine [/C][/ROW]
[ROW][C]Computing time[/C][C]5 seconds[/C][/ROW]
[ROW][C]R Server[/C][C]'Gertrude Mary Cox' @ cox.wessa.net[/C][/ROW]
[/TABLE]
Source: https://freestatistics.org/blog/index.php?pk=232312&T=0

Globally Unique Identifier (entire table): ba.freestatistics.org/blog/index.php?pk=232312&T=0

As an alternative you can also use a QR Code:  

The GUIDs for individual cells are displayed in the table below:

Summary of computational transaction
Raw Inputview raw input (R code)
Raw Outputview raw output of R engine
Computing time5 seconds
R Server'Gertrude Mary Cox' @ cox.wessa.net


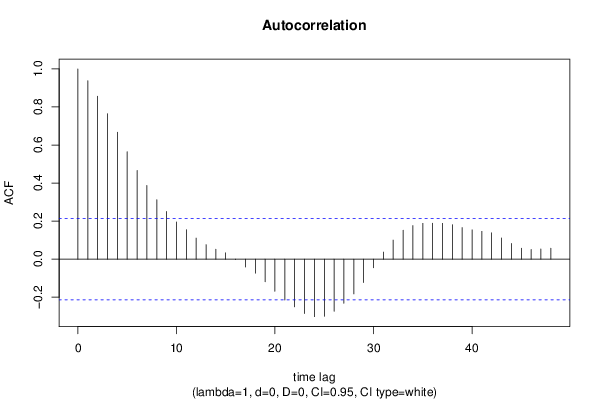
Autocorrelation Function
Time lag kACF(k)T-STATP-value
10.9382918.59960
20.8563437.84850
30.7648517.010
40.6671836.11480
50.5646365.1751e-06
60.4665074.27562.5e-05
70.3872763.54940.000318
80.3121862.86120.002662
90.2502452.29350.012158
100.195571.79240.038332
110.154311.41430.080489
120.1106471.01410.156724
130.0762220.69860.243369
140.0524050.48030.316132
150.0330270.30270.381435
16-0.001596-0.01460.494182
17-0.041343-0.37890.352854
18-0.073479-0.67340.251256
19-0.119303-1.09340.138665
20-0.168397-1.54340.063249
21-0.214597-1.96680.026253
22-0.250809-2.29870.012003
23-0.285372-2.61550.005281
24-0.302323-2.77080.003441
25-0.300678-2.75580.00359
26-0.27436-2.51460.006912
27-0.23171-2.12370.01832
28-0.18247-1.67240.049086
29-0.122747-1.1250.131898
30-0.045031-0.41270.340432
310.0369120.33830.367988
320.1002010.91840.180531
330.1515511.3890.084254
340.1763331.61610.05491
350.1882261.72510.044091
360.1888961.73130.043538
370.1879891.72290.044289
380.1805671.65490.050836
390.1659091.52060.06606
400.1538361.40990.081126
410.1462121.34010.09192
420.1382751.26730.104273
430.1115861.02270.154693
440.0819440.7510.227368
450.0575890.52780.29951
460.0508590.46610.321163
470.0536410.49160.312133
480.0572940.52510.300444

\begin{tabular}{lllllllll}
\hline
Autocorrelation Function \tabularnewline
Time lag k & ACF(k) & T-STAT & P-value \tabularnewline
1 & 0.938291 & 8.5996 & 0 \tabularnewline
2 & 0.856343 & 7.8485 & 0 \tabularnewline
3 & 0.764851 & 7.01 & 0 \tabularnewline
4 & 0.667183 & 6.1148 & 0 \tabularnewline
5 & 0.564636 & 5.175 & 1e-06 \tabularnewline
6 & 0.466507 & 4.2756 & 2.5e-05 \tabularnewline
7 & 0.387276 & 3.5494 & 0.000318 \tabularnewline
8 & 0.312186 & 2.8612 & 0.002662 \tabularnewline
9 & 0.250245 & 2.2935 & 0.012158 \tabularnewline
10 & 0.19557 & 1.7924 & 0.038332 \tabularnewline
11 & 0.15431 & 1.4143 & 0.080489 \tabularnewline
12 & 0.110647 & 1.0141 & 0.156724 \tabularnewline
13 & 0.076222 & 0.6986 & 0.243369 \tabularnewline
14 & 0.052405 & 0.4803 & 0.316132 \tabularnewline
15 & 0.033027 & 0.3027 & 0.381435 \tabularnewline
16 & -0.001596 & -0.0146 & 0.494182 \tabularnewline
17 & -0.041343 & -0.3789 & 0.352854 \tabularnewline
18 & -0.073479 & -0.6734 & 0.251256 \tabularnewline
19 & -0.119303 & -1.0934 & 0.138665 \tabularnewline
20 & -0.168397 & -1.5434 & 0.063249 \tabularnewline
21 & -0.214597 & -1.9668 & 0.026253 \tabularnewline
22 & -0.250809 & -2.2987 & 0.012003 \tabularnewline
23 & -0.285372 & -2.6155 & 0.005281 \tabularnewline
24 & -0.302323 & -2.7708 & 0.003441 \tabularnewline
25 & -0.300678 & -2.7558 & 0.00359 \tabularnewline
26 & -0.27436 & -2.5146 & 0.006912 \tabularnewline
27 & -0.23171 & -2.1237 & 0.01832 \tabularnewline
28 & -0.18247 & -1.6724 & 0.049086 \tabularnewline
29 & -0.122747 & -1.125 & 0.131898 \tabularnewline
30 & -0.045031 & -0.4127 & 0.340432 \tabularnewline
31 & 0.036912 & 0.3383 & 0.367988 \tabularnewline
32 & 0.100201 & 0.9184 & 0.180531 \tabularnewline
33 & 0.151551 & 1.389 & 0.084254 \tabularnewline
34 & 0.176333 & 1.6161 & 0.05491 \tabularnewline
35 & 0.188226 & 1.7251 & 0.044091 \tabularnewline
36 & 0.188896 & 1.7313 & 0.043538 \tabularnewline
37 & 0.187989 & 1.7229 & 0.044289 \tabularnewline
38 & 0.180567 & 1.6549 & 0.050836 \tabularnewline
39 & 0.165909 & 1.5206 & 0.06606 \tabularnewline
40 & 0.153836 & 1.4099 & 0.081126 \tabularnewline
41 & 0.146212 & 1.3401 & 0.09192 \tabularnewline
42 & 0.138275 & 1.2673 & 0.104273 \tabularnewline
43 & 0.111586 & 1.0227 & 0.154693 \tabularnewline
44 & 0.081944 & 0.751 & 0.227368 \tabularnewline
45 & 0.057589 & 0.5278 & 0.29951 \tabularnewline
46 & 0.050859 & 0.4661 & 0.321163 \tabularnewline
47 & 0.053641 & 0.4916 & 0.312133 \tabularnewline
48 & 0.057294 & 0.5251 & 0.300444 \tabularnewline
\hline
\end{tabular}
%Source: https://freestatistics.org/blog/index.php?pk=232312&T=1

[TABLE]
[ROW][C]Autocorrelation Function[/C][/ROW]
[ROW][C]Time lag k[/C][C]ACF(k)[/C][C]T-STAT[/C][C]P-value[/C][/ROW]
[ROW][C]1[/C][C]0.938291[/C][C]8.5996[/C][C]0[/C][/ROW]
[ROW][C]2[/C][C]0.856343[/C][C]7.8485[/C][C]0[/C][/ROW]
[ROW][C]3[/C][C]0.764851[/C][C]7.01[/C][C]0[/C][/ROW]
[ROW][C]4[/C][C]0.667183[/C][C]6.1148[/C][C]0[/C][/ROW]
[ROW][C]5[/C][C]0.564636[/C][C]5.175[/C][C]1e-06[/C][/ROW]
[ROW][C]6[/C][C]0.466507[/C][C]4.2756[/C][C]2.5e-05[/C][/ROW]
[ROW][C]7[/C][C]0.387276[/C][C]3.5494[/C][C]0.000318[/C][/ROW]
[ROW][C]8[/C][C]0.312186[/C][C]2.8612[/C][C]0.002662[/C][/ROW]
[ROW][C]9[/C][C]0.250245[/C][C]2.2935[/C][C]0.012158[/C][/ROW]
[ROW][C]10[/C][C]0.19557[/C][C]1.7924[/C][C]0.038332[/C][/ROW]
[ROW][C]11[/C][C]0.15431[/C][C]1.4143[/C][C]0.080489[/C][/ROW]
[ROW][C]12[/C][C]0.110647[/C][C]1.0141[/C][C]0.156724[/C][/ROW]
[ROW][C]13[/C][C]0.076222[/C][C]0.6986[/C][C]0.243369[/C][/ROW]
[ROW][C]14[/C][C]0.052405[/C][C]0.4803[/C][C]0.316132[/C][/ROW]
[ROW][C]15[/C][C]0.033027[/C][C]0.3027[/C][C]0.381435[/C][/ROW]
[ROW][C]16[/C][C]-0.001596[/C][C]-0.0146[/C][C]0.494182[/C][/ROW]
[ROW][C]17[/C][C]-0.041343[/C][C]-0.3789[/C][C]0.352854[/C][/ROW]
[ROW][C]18[/C][C]-0.073479[/C][C]-0.6734[/C][C]0.251256[/C][/ROW]
[ROW][C]19[/C][C]-0.119303[/C][C]-1.0934[/C][C]0.138665[/C][/ROW]
[ROW][C]20[/C][C]-0.168397[/C][C]-1.5434[/C][C]0.063249[/C][/ROW]
[ROW][C]21[/C][C]-0.214597[/C][C]-1.9668[/C][C]0.026253[/C][/ROW]
[ROW][C]22[/C][C]-0.250809[/C][C]-2.2987[/C][C]0.012003[/C][/ROW]
[ROW][C]23[/C][C]-0.285372[/C][C]-2.6155[/C][C]0.005281[/C][/ROW]
[ROW][C]24[/C][C]-0.302323[/C][C]-2.7708[/C][C]0.003441[/C][/ROW]
[ROW][C]25[/C][C]-0.300678[/C][C]-2.7558[/C][C]0.00359[/C][/ROW]
[ROW][C]26[/C][C]-0.27436[/C][C]-2.5146[/C][C]0.006912[/C][/ROW]
[ROW][C]27[/C][C]-0.23171[/C][C]-2.1237[/C][C]0.01832[/C][/ROW]
[ROW][C]28[/C][C]-0.18247[/C][C]-1.6724[/C][C]0.049086[/C][/ROW]
[ROW][C]29[/C][C]-0.122747[/C][C]-1.125[/C][C]0.131898[/C][/ROW]
[ROW][C]30[/C][C]-0.045031[/C][C]-0.4127[/C][C]0.340432[/C][/ROW]
[ROW][C]31[/C][C]0.036912[/C][C]0.3383[/C][C]0.367988[/C][/ROW]
[ROW][C]32[/C][C]0.100201[/C][C]0.9184[/C][C]0.180531[/C][/ROW]
[ROW][C]33[/C][C]0.151551[/C][C]1.389[/C][C]0.084254[/C][/ROW]
[ROW][C]34[/C][C]0.176333[/C][C]1.6161[/C][C]0.05491[/C][/ROW]
[ROW][C]35[/C][C]0.188226[/C][C]1.7251[/C][C]0.044091[/C][/ROW]
[ROW][C]36[/C][C]0.188896[/C][C]1.7313[/C][C]0.043538[/C][/ROW]
[ROW][C]37[/C][C]0.187989[/C][C]1.7229[/C][C]0.044289[/C][/ROW]
[ROW][C]38[/C][C]0.180567[/C][C]1.6549[/C][C]0.050836[/C][/ROW]
[ROW][C]39[/C][C]0.165909[/C][C]1.5206[/C][C]0.06606[/C][/ROW]
[ROW][C]40[/C][C]0.153836[/C][C]1.4099[/C][C]0.081126[/C][/ROW]
[ROW][C]41[/C][C]0.146212[/C][C]1.3401[/C][C]0.09192[/C][/ROW]
[ROW][C]42[/C][C]0.138275[/C][C]1.2673[/C][C]0.104273[/C][/ROW]
[ROW][C]43[/C][C]0.111586[/C][C]1.0227[/C][C]0.154693[/C][/ROW]
[ROW][C]44[/C][C]0.081944[/C][C]0.751[/C][C]0.227368[/C][/ROW]
[ROW][C]45[/C][C]0.057589[/C][C]0.5278[/C][C]0.29951[/C][/ROW]
[ROW][C]46[/C][C]0.050859[/C][C]0.4661[/C][C]0.321163[/C][/ROW]
[ROW][C]47[/C][C]0.053641[/C][C]0.4916[/C][C]0.312133[/C][/ROW]
[ROW][C]48[/C][C]0.057294[/C][C]0.5251[/C][C]0.300444[/C][/ROW]
[/TABLE]
Source: https://freestatistics.org/blog/index.php?pk=232312&T=1

Globally Unique Identifier (entire table): ba.freestatistics.org/blog/index.php?pk=232312&T=1

As an alternative you can also use a QR Code:  

The GUIDs for individual cells are displayed in the table below:

Autocorrelation Function
Time lag kACF(k)T-STATP-value
10.9382918.59960
20.8563437.84850
30.7648517.010
40.6671836.11480
50.5646365.1751e-06
60.4665074.27562.5e-05
70.3872763.54940.000318
80.3121862.86120.002662
90.2502452.29350.012158
100.195571.79240.038332
110.154311.41430.080489
120.1106471.01410.156724
130.0762220.69860.243369
140.0524050.48030.316132
150.0330270.30270.381435
16-0.001596-0.01460.494182
17-0.041343-0.37890.352854
18-0.073479-0.67340.251256
19-0.119303-1.09340.138665
20-0.168397-1.54340.063249
21-0.214597-1.96680.026253
22-0.250809-2.29870.012003
23-0.285372-2.61550.005281
24-0.302323-2.77080.003441
25-0.300678-2.75580.00359
26-0.27436-2.51460.006912
27-0.23171-2.12370.01832
28-0.18247-1.67240.049086
29-0.122747-1.1250.131898
30-0.045031-0.41270.340432
310.0369120.33830.367988
320.1002010.91840.180531
330.1515511.3890.084254
340.1763331.61610.05491
350.1882261.72510.044091
360.1888961.73130.043538
370.1879891.72290.044289
380.1805671.65490.050836
390.1659091.52060.06606
400.1538361.40990.081126
410.1462121.34010.09192
420.1382751.26730.104273
430.1115861.02270.154693
440.0819440.7510.227368
450.0575890.52780.29951
460.0508590.46610.321163
470.0536410.49160.312133
480.0572940.52510.300444


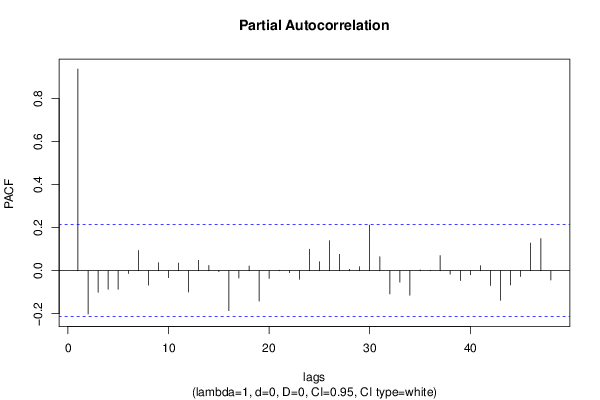
Partial Autocorrelation Function
Time lag kPACF(k)T-STATP-value
10.9382918.59960
2-0.201036-1.84250.034463
3-0.100623-0.92220.179527
4-0.086313-0.79110.215566
5-0.086564-0.79340.214898
6-0.013283-0.12170.451698
70.093910.86070.195927
8-0.067117-0.61510.270063
90.0371390.34040.367207
10-0.032499-0.29790.383274
110.0350480.32120.374419
12-0.098874-0.90620.183712
130.0488590.44780.327725
140.0243780.22340.411872
15-0.004461-0.04090.483741
16-0.185956-1.70430.046009
17-0.034349-0.31480.376843
180.0218820.20050.420768
19-0.141-1.29230.099901
20-0.035968-0.32970.371241
210.0022640.02080.491747
22-0.00996-0.09130.463741
23-0.040016-0.36680.357363
240.0995590.91250.182066
250.041930.38430.350867
260.13911.27490.102935
270.0758820.69550.244341
280.0060620.05560.477912
290.0180940.16580.434342
300.2117781.9410.027807
310.0649580.59540.276604
32-0.108063-0.99040.162408
33-0.053289-0.48840.313268
34-0.113998-1.04480.149555
350.003540.03240.487098
360.0022130.02030.491932
370.0699990.64160.261455
38-0.016079-0.14740.441599
39-0.04553-0.41730.338766
40-0.018874-0.1730.431542
410.0226840.20790.417905
42-0.069231-0.63450.263737
43-0.137865-1.26360.104942
44-0.06684-0.61260.270899
45-0.027227-0.24950.401776
460.128171.17470.121717
470.1492641.3680.087476
48-0.043091-0.39490.346947

\begin{tabular}{lllllllll}
\hline
Partial Autocorrelation Function \tabularnewline
Time lag k & PACF(k) & T-STAT & P-value \tabularnewline
1 & 0.938291 & 8.5996 & 0 \tabularnewline
2 & -0.201036 & -1.8425 & 0.034463 \tabularnewline
3 & -0.100623 & -0.9222 & 0.179527 \tabularnewline
4 & -0.086313 & -0.7911 & 0.215566 \tabularnewline
5 & -0.086564 & -0.7934 & 0.214898 \tabularnewline
6 & -0.013283 & -0.1217 & 0.451698 \tabularnewline
7 & 0.09391 & 0.8607 & 0.195927 \tabularnewline
8 & -0.067117 & -0.6151 & 0.270063 \tabularnewline
9 & 0.037139 & 0.3404 & 0.367207 \tabularnewline
10 & -0.032499 & -0.2979 & 0.383274 \tabularnewline
11 & 0.035048 & 0.3212 & 0.374419 \tabularnewline
12 & -0.098874 & -0.9062 & 0.183712 \tabularnewline
13 & 0.048859 & 0.4478 & 0.327725 \tabularnewline
14 & 0.024378 & 0.2234 & 0.411872 \tabularnewline
15 & -0.004461 & -0.0409 & 0.483741 \tabularnewline
16 & -0.185956 & -1.7043 & 0.046009 \tabularnewline
17 & -0.034349 & -0.3148 & 0.376843 \tabularnewline
18 & 0.021882 & 0.2005 & 0.420768 \tabularnewline
19 & -0.141 & -1.2923 & 0.099901 \tabularnewline
20 & -0.035968 & -0.3297 & 0.371241 \tabularnewline
21 & 0.002264 & 0.0208 & 0.491747 \tabularnewline
22 & -0.00996 & -0.0913 & 0.463741 \tabularnewline
23 & -0.040016 & -0.3668 & 0.357363 \tabularnewline
24 & 0.099559 & 0.9125 & 0.182066 \tabularnewline
25 & 0.04193 & 0.3843 & 0.350867 \tabularnewline
26 & 0.1391 & 1.2749 & 0.102935 \tabularnewline
27 & 0.075882 & 0.6955 & 0.244341 \tabularnewline
28 & 0.006062 & 0.0556 & 0.477912 \tabularnewline
29 & 0.018094 & 0.1658 & 0.434342 \tabularnewline
30 & 0.211778 & 1.941 & 0.027807 \tabularnewline
31 & 0.064958 & 0.5954 & 0.276604 \tabularnewline
32 & -0.108063 & -0.9904 & 0.162408 \tabularnewline
33 & -0.053289 & -0.4884 & 0.313268 \tabularnewline
34 & -0.113998 & -1.0448 & 0.149555 \tabularnewline
35 & 0.00354 & 0.0324 & 0.487098 \tabularnewline
36 & 0.002213 & 0.0203 & 0.491932 \tabularnewline
37 & 0.069999 & 0.6416 & 0.261455 \tabularnewline
38 & -0.016079 & -0.1474 & 0.441599 \tabularnewline
39 & -0.04553 & -0.4173 & 0.338766 \tabularnewline
40 & -0.018874 & -0.173 & 0.431542 \tabularnewline
41 & 0.022684 & 0.2079 & 0.417905 \tabularnewline
42 & -0.069231 & -0.6345 & 0.263737 \tabularnewline
43 & -0.137865 & -1.2636 & 0.104942 \tabularnewline
44 & -0.06684 & -0.6126 & 0.270899 \tabularnewline
45 & -0.027227 & -0.2495 & 0.401776 \tabularnewline
46 & 0.12817 & 1.1747 & 0.121717 \tabularnewline
47 & 0.149264 & 1.368 & 0.087476 \tabularnewline
48 & -0.043091 & -0.3949 & 0.346947 \tabularnewline
\hline
\end{tabular}
%Source: https://freestatistics.org/blog/index.php?pk=232312&T=2

[TABLE]
[ROW][C]Partial Autocorrelation Function[/C][/ROW]
[ROW][C]Time lag k[/C][C]PACF(k)[/C][C]T-STAT[/C][C]P-value[/C][/ROW]
[ROW][C]1[/C][C]0.938291[/C][C]8.5996[/C][C]0[/C][/ROW]
[ROW][C]2[/C][C]-0.201036[/C][C]-1.8425[/C][C]0.034463[/C][/ROW]
[ROW][C]3[/C][C]-0.100623[/C][C]-0.9222[/C][C]0.179527[/C][/ROW]
[ROW][C]4[/C][C]-0.086313[/C][C]-0.7911[/C][C]0.215566[/C][/ROW]
[ROW][C]5[/C][C]-0.086564[/C][C]-0.7934[/C][C]0.214898[/C][/ROW]
[ROW][C]6[/C][C]-0.013283[/C][C]-0.1217[/C][C]0.451698[/C][/ROW]
[ROW][C]7[/C][C]0.09391[/C][C]0.8607[/C][C]0.195927[/C][/ROW]
[ROW][C]8[/C][C]-0.067117[/C][C]-0.6151[/C][C]0.270063[/C][/ROW]
[ROW][C]9[/C][C]0.037139[/C][C]0.3404[/C][C]0.367207[/C][/ROW]
[ROW][C]10[/C][C]-0.032499[/C][C]-0.2979[/C][C]0.383274[/C][/ROW]
[ROW][C]11[/C][C]0.035048[/C][C]0.3212[/C][C]0.374419[/C][/ROW]
[ROW][C]12[/C][C]-0.098874[/C][C]-0.9062[/C][C]0.183712[/C][/ROW]
[ROW][C]13[/C][C]0.048859[/C][C]0.4478[/C][C]0.327725[/C][/ROW]
[ROW][C]14[/C][C]0.024378[/C][C]0.2234[/C][C]0.411872[/C][/ROW]
[ROW][C]15[/C][C]-0.004461[/C][C]-0.0409[/C][C]0.483741[/C][/ROW]
[ROW][C]16[/C][C]-0.185956[/C][C]-1.7043[/C][C]0.046009[/C][/ROW]
[ROW][C]17[/C][C]-0.034349[/C][C]-0.3148[/C][C]0.376843[/C][/ROW]
[ROW][C]18[/C][C]0.021882[/C][C]0.2005[/C][C]0.420768[/C][/ROW]
[ROW][C]19[/C][C]-0.141[/C][C]-1.2923[/C][C]0.099901[/C][/ROW]
[ROW][C]20[/C][C]-0.035968[/C][C]-0.3297[/C][C]0.371241[/C][/ROW]
[ROW][C]21[/C][C]0.002264[/C][C]0.0208[/C][C]0.491747[/C][/ROW]
[ROW][C]22[/C][C]-0.00996[/C][C]-0.0913[/C][C]0.463741[/C][/ROW]
[ROW][C]23[/C][C]-0.040016[/C][C]-0.3668[/C][C]0.357363[/C][/ROW]
[ROW][C]24[/C][C]0.099559[/C][C]0.9125[/C][C]0.182066[/C][/ROW]
[ROW][C]25[/C][C]0.04193[/C][C]0.3843[/C][C]0.350867[/C][/ROW]
[ROW][C]26[/C][C]0.1391[/C][C]1.2749[/C][C]0.102935[/C][/ROW]
[ROW][C]27[/C][C]0.075882[/C][C]0.6955[/C][C]0.244341[/C][/ROW]
[ROW][C]28[/C][C]0.006062[/C][C]0.0556[/C][C]0.477912[/C][/ROW]
[ROW][C]29[/C][C]0.018094[/C][C]0.1658[/C][C]0.434342[/C][/ROW]
[ROW][C]30[/C][C]0.211778[/C][C]1.941[/C][C]0.027807[/C][/ROW]
[ROW][C]31[/C][C]0.064958[/C][C]0.5954[/C][C]0.276604[/C][/ROW]
[ROW][C]32[/C][C]-0.108063[/C][C]-0.9904[/C][C]0.162408[/C][/ROW]
[ROW][C]33[/C][C]-0.053289[/C][C]-0.4884[/C][C]0.313268[/C][/ROW]
[ROW][C]34[/C][C]-0.113998[/C][C]-1.0448[/C][C]0.149555[/C][/ROW]
[ROW][C]35[/C][C]0.00354[/C][C]0.0324[/C][C]0.487098[/C][/ROW]
[ROW][C]36[/C][C]0.002213[/C][C]0.0203[/C][C]0.491932[/C][/ROW]
[ROW][C]37[/C][C]0.069999[/C][C]0.6416[/C][C]0.261455[/C][/ROW]
[ROW][C]38[/C][C]-0.016079[/C][C]-0.1474[/C][C]0.441599[/C][/ROW]
[ROW][C]39[/C][C]-0.04553[/C][C]-0.4173[/C][C]0.338766[/C][/ROW]
[ROW][C]40[/C][C]-0.018874[/C][C]-0.173[/C][C]0.431542[/C][/ROW]
[ROW][C]41[/C][C]0.022684[/C][C]0.2079[/C][C]0.417905[/C][/ROW]
[ROW][C]42[/C][C]-0.069231[/C][C]-0.6345[/C][C]0.263737[/C][/ROW]
[ROW][C]43[/C][C]-0.137865[/C][C]-1.2636[/C][C]0.104942[/C][/ROW]
[ROW][C]44[/C][C]-0.06684[/C][C]-0.6126[/C][C]0.270899[/C][/ROW]
[ROW][C]45[/C][C]-0.027227[/C][C]-0.2495[/C][C]0.401776[/C][/ROW]
[ROW][C]46[/C][C]0.12817[/C][C]1.1747[/C][C]0.121717[/C][/ROW]
[ROW][C]47[/C][C]0.149264[/C][C]1.368[/C][C]0.087476[/C][/ROW]
[ROW][C]48[/C][C]-0.043091[/C][C]-0.3949[/C][C]0.346947[/C][/ROW]
[/TABLE]
Source: https://freestatistics.org/blog/index.php?pk=232312&T=2

Globally Unique Identifier (entire table): ba.freestatistics.org/blog/index.php?pk=232312&T=2

As an alternative you can also use a QR Code:  

The GUIDs for individual cells are displayed in the table below:

Partial Autocorrelation Function
Time lag kPACF(k)T-STATP-value
10.9382918.59960
2-0.201036-1.84250.034463
3-0.100623-0.92220.179527
4-0.086313-0.79110.215566
5-0.086564-0.79340.214898
6-0.013283-0.12170.451698
70.093910.86070.195927
8-0.067117-0.61510.270063
90.0371390.34040.367207
10-0.032499-0.29790.383274
110.0350480.32120.374419
12-0.098874-0.90620.183712
130.0488590.44780.327725
140.0243780.22340.411872
15-0.004461-0.04090.483741
16-0.185956-1.70430.046009
17-0.034349-0.31480.376843
180.0218820.20050.420768
19-0.141-1.29230.099901
20-0.035968-0.32970.371241
210.0022640.02080.491747
22-0.00996-0.09130.463741
23-0.040016-0.36680.357363
240.0995590.91250.182066
250.041930.38430.350867
260.13911.27490.102935
270.0758820.69550.244341
280.0060620.05560.477912
290.0180940.16580.434342
300.2117781.9410.027807
310.0649580.59540.276604
32-0.108063-0.99040.162408
33-0.053289-0.48840.313268
34-0.113998-1.04480.149555
350.003540.03240.487098
360.0022130.02030.491932
370.0699990.64160.261455
38-0.016079-0.14740.441599
39-0.04553-0.41730.338766
40-0.018874-0.1730.431542
410.0226840.20790.417905
42-0.069231-0.63450.263737
43-0.137865-1.26360.104942
44-0.06684-0.61260.270899
45-0.027227-0.24950.401776
460.128171.17470.121717
470.1492641.3680.087476
48-0.043091-0.39490.346947


Parameters (Session):
par1 = 48 ; par2 = 1 ; par3 = 0 ; par4 = 0 ; par5 = 12 ; par6 = White Noise ; par7 = 0.95 ;
Parameters (R input):
par1 = 48 ; par2 = 1 ; par3 = 0 ; par4 = 0 ; par5 = 12 ; par6 = White Noise ; par7 = 0.95 ; par8 = ;
R code (references can be found in the software module):
if (par1 == 'Default') {
par1 = 10*log10(length(x))
} else {
par1 <- as.numeric(par1)
}
par2 <- as.numeric(par2)
par3 <- as.numeric(par3)
par4 <- as.numeric(par4)
par5 <- as.numeric(par5)
if (par6 == 'White Noise') par6 <- 'white' else par6 <- 'ma'
par7 <- as.numeric(par7)
if (par8 != '') par8 <- as.numeric(par8)
ox <- x
if (par8 == '') {
if (par2 == 0) {
x <- log(x)
} else {
x <- (x ^ par2 - 1) / par2
}
} else {
x <- log(x,base=par8)
}
if (par3 > 0) x <- diff(x,lag=1,difference=par3)
if (par4 > 0) x <- diff(x,lag=par5,difference=par4)
bitmap(file='picts.png')
op <- par(mfrow=c(2,1))
plot(ox,type='l',main='Original Time Series',xlab='time',ylab='value')
if (par8=='') {
mytitle <- paste('Working Time Series (lambda=',par2,', d=',par3,', D=',par4,')',sep='')
mysub <- paste('(lambda=',par2,', d=',par3,', D=',par4,', CI=', par7, ', CI type=',par6,')',sep='')
} else {
mytitle <- paste('Working Time Series (base=',par8,', d=',par3,', D=',par4,')',sep='')
mysub <- paste('(base=',par8,', d=',par3,', D=',par4,', CI=', par7, ', CI type=',par6,')',sep='')
}
plot(x,type='l', main=mytitle,xlab='time',ylab='value')
par(op)
dev.off()
bitmap(file='pic1.png')
racf <- acf(x, par1, main='Autocorrelation', xlab='time lag', ylab='ACF', ci.type=par6, ci=par7, sub=mysub)
dev.off()
bitmap(file='pic2.png')
rpacf <- pacf(x,par1,main='Partial Autocorrelation',xlab='lags',ylab='PACF',sub=mysub)
dev.off()
(myacf <- c(racf$acf))
(mypacf <- c(rpacf$acf))
lengthx <- length(x)
sqrtn <- sqrt(lengthx)
load(file='createtable')
a<-table.start()
a<-table.row.start(a)
a<-table.element(a,'Autocorrelation Function',4,TRUE)
a<-table.row.end(a)
a<-table.row.start(a)
a<-table.element(a,'Time lag k',header=TRUE)
a<-table.element(a,hyperlink('basics.htm','ACF(k)','click here for more information about the Autocorrelation Function'),header=TRUE)
a<-table.element(a,'T-STAT',header=TRUE)
a<-table.element(a,'P-value',header=TRUE)
a<-table.row.end(a)
for (i in 2:(par1+1)) {
a<-table.row.start(a)
a<-table.element(a,i-1,header=TRUE)
a<-table.element(a,round(myacf[i],6))
mytstat <- myacf[i]*sqrtn
a<-table.element(a,round(mytstat,4))
a<-table.element(a,round(1-pt(abs(mytstat),lengthx),6))
a<-table.row.end(a)
}
a<-table.end(a)
table.save(a,file='mytable.tab')
a<-table.start()
a<-table.row.start(a)
a<-table.element(a,'Partial Autocorrelation Function',4,TRUE)
a<-table.row.end(a)
a<-table.row.start(a)
a<-table.element(a,'Time lag k',header=TRUE)
a<-table.element(a,hyperlink('basics.htm','PACF(k)','click here for more information about the Partial Autocorrelation Function'),header=TRUE)
a<-table.element(a,'T-STAT',header=TRUE)
a<-table.element(a,'P-value',header=TRUE)
a<-table.row.end(a)
for (i in 1:par1) {
a<-table.row.start(a)
a<-table.element(a,i,header=TRUE)
a<-table.element(a,round(mypacf[i],6))
mytstat <- mypacf[i]*sqrtn
a<-table.element(a,round(mytstat,4))
a<-table.element(a,round(1-pt(abs(mytstat),lengthx),6))
a<-table.row.end(a)
}
a<-table.end(a)
table.save(a,file='mytable1.tab')