Free Statistics

of Irreproducible Research!

Author's title

Author*Unverified author*
R Software Modulerwasp_smp.wasp
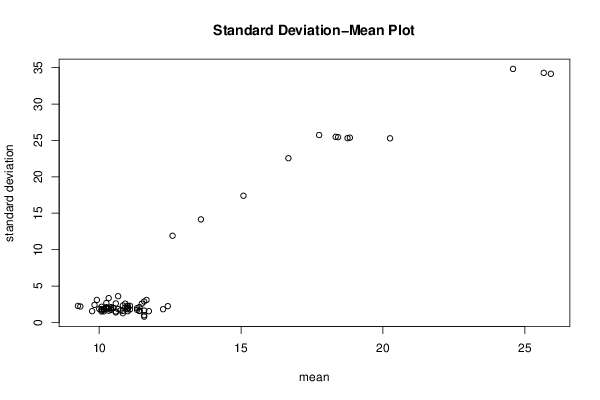
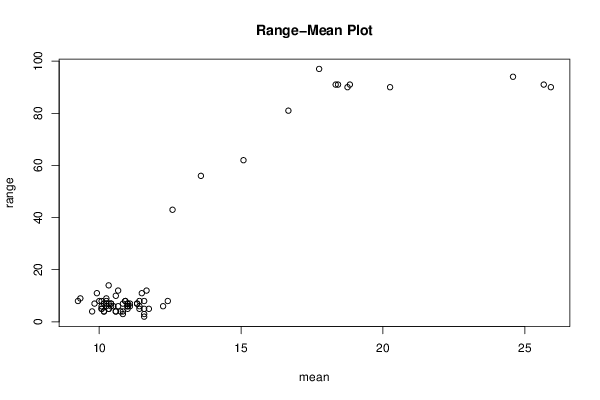
Title produced by softwareStandard Deviation-Mean Plot
Date of computationThu, 05 Dec 2013 09:52:19 -0500
Cite this page as followsStatistical Computations at FreeStatistics.org, Office for Research Development and Education, URL https://freestatistics.org/blog/index.php?v=date/2013/Dec/05/t1386255404dpo7rfx8habxten.htm/, Retrieved Thu, 25 Apr 2024 09:57:19 +0000
Statistical Computations at FreeStatistics.org, Office for Research Development and Education, URL https://freestatistics.org/blog/index.php?pk=231138, Retrieved Thu, 25 Apr 2024 09:57:19 +0000
QR Codes:

Original text written by user:
IsPrivate?No (this computation is public)
User-defined keywords
Estimated Impact80
Family? (F = Feedback message, R = changed R code, M = changed R Module, P = changed Parameters, D = changed Data)
-       [Standard Deviation-Mean Plot] [] [2013-12-05 14:52:19] [5e7911d8fd88d8bc3975d02d8918deef] [Current]
Feedback Forum

Post a new message
Dataseries X:
8
10
10
13
14
12
11
8
8
10
10
12
12
12
11
12
12
12
12
12
12
10
12
10
11
10
10
12
10
12
7
12
18
12
11
13
10
10
10
8
12
10
10
8
14
9
8
12
15
14
1
9
7
8
12
57
12
10
10
8
8
16
14
13
10
12
9
12
11
10
8
8
9
12
8
12
10
12
9
8
12
8
12
10
12
9
28
10
12
9
14
12
12
99
13
13
14
12
12
10
11
12
14
10
12
12
6
12
10
12
12
12
9
12
12
13
8
12
10
10
10
9
12
9
10
8
12
10
8
8
9
12
12
10
10
9
11
10
9
15
10
8
10
8
9
9
6
16
12
12
12
12
10
12
8
9
12
12
8
14
10
12
8
11
10
12
12
12
12
8
10
7
10
10
12
11
9
10
12
14
13
10
11
10
10
8
10
10
10
8
8
4
14
8
12
12
10
8
12
12
10
10
12
12
9
11
14
10
8
12
8
10
11
12
10
10
12
8
9
12
8
8
10
10
10
14
10
12
12
13
9
12
12
10
12
6
8
12
10
9
11
11
9
10
15
12
7
7
10
9
10
10
9
12
10
9
12
10
7
12
10
10
12
8
12
10
10
9
8
8
12
12
10
12
10
9
10
10
8
10
12
12
16
10
9
12
12
10
7
12
10
10
6
9
6
18
13
10
12
15
12
12
9
7
12
13
14
13
12
8
8
10
10
8
12
10
12
12
12
9
12
7
12
8
8
12
14
10
5
9
8
13
10
10
14
10
99
10
12
17
14
8
14
12
12
10
10
8
12
12
12
10
12
10
10
12
12
12
12
13
12
8
10
12
8
10
10
12
12
12
12
12
12
14
10
12
14
12
14
12
13
8
12
14
10
10
11
16
12
10
10
99
8
11
12
12
11
10
20
9
14
12
10
12
10
12
12
8
12
12
10
99
12
2
10
10
10
12
12
12
12
88
9
12
14
8
12
10
10
10
7
8
10
1
10
10
9
15
10
12
12
12
11
12
12
14
8
12
12
10
14
8
10
12
10
10
10
12
9
12
11
8
14
12
10
12
10
8
14
12
12
12
8
12
12
10
12
12
12
9
11
10
15
10
9
9
10
7
10
9
10
10
10
15
12
12
10
12
8
12
11
8
14
8
12
10
15
9
13
12
14
12
12
17
10
13
12
12
10
12
10
12
10
10
10
1
8
12
10
10
10
12
12
11
12
8
8
12
12
10
12
9
10
12
12
12
12
10
10
9
12
10
9
12
7
14
10
10
9
10
8
10
12
12
10
9
10
9
12
10
12
10
9
7
12
11
12
9
13
12
12
7
8
12
12
12
11
12
13
10
12
10
12
12
15
12
12
13
10
10
8
11
12
12
12
12
10
10
12
15
12
10
10
7
12
10
11
10
10
10
10
11
7
15
8
10
6
8
9
8
7
10
12
14
11
8
10
8
8
14
12
15
12
12
9
12
12
9
11
15
11
12
7
15
9
10
15
15
8
11
12
10
10
12
7
12
10
11
12
10
10
8
9
8
10
10
14
10
10
12
12
7
12
10
12
9
9
13
14
10
12
12
12
12
12
10
10
8
12
8
14
10
70
12
10
8
8
11
10
8
7
8
50
9
12
12
7
10
8
10
10
10
8
12
7
13
13
8
8
11
6
12
9
12
13
13
12
12
10
8
12
10
10
15
12
10
12
8
8
12
12
10
12
9
12
12
10
9
10
10
10
12
12
12
12
8
10
12
15
10
8
15
10
9
12
99
10
10
11
11
12
12
14
12
14
9
10
12
13
10
11
10
12
12
12
13
14
9
10
10
12
12
10
99
8
99
12
99
12
10
12
10
12
12
12
10
12
12
10
10
12
99
12
12
9
99
12
12
9
12
12
12
15
12
12
12
8
8
12
8
12
12
10
10
12
99
8
8
99
10
10
5
9
9
99
9
10
12


Summary of computational transaction
Raw Inputview raw input (R code)
Raw Outputview raw output of R engine
Computing time5 seconds
R Server'Herman Ole Andreas Wold' @ wold.wessa.net

\begin{tabular}{lllllllll}
\hline
Summary of computational transaction \tabularnewline
Raw Input & view raw input (R code)  \tabularnewline
Raw Output & view raw output of R engine  \tabularnewline
Computing time & 5 seconds \tabularnewline
R Server & 'Herman Ole Andreas Wold' @ wold.wessa.net \tabularnewline
\hline
\end{tabular}
%Source: https://freestatistics.org/blog/index.php?pk=231138&T=0

[TABLE]
[ROW][C]Summary of computational transaction[/C][/ROW]
[ROW][C]Raw Input[/C][C]view raw input (R code) [/C][/ROW]
[ROW][C]Raw Output[/C][C]view raw output of R engine [/C][/ROW]
[ROW][C]Computing time[/C][C]5 seconds[/C][/ROW]
[ROW][C]R Server[/C][C]'Herman Ole Andreas Wold' @ wold.wessa.net[/C][/ROW]
[/TABLE]
Source: https://freestatistics.org/blog/index.php?pk=231138&T=0

Globally Unique Identifier (entire table): ba.freestatistics.org/blog/index.php?pk=231138&T=0

As an alternative you can also use a QR Code:  

The GUIDs for individual cells are displayed in the table below:

Summary of computational transaction
Raw Inputview raw input (R code)
Raw Outputview raw output of R engine
Computing time5 seconds
R Server'Herman Ole Andreas Wold' @ wold.wessa.net


Standard Deviation-Mean Plot
SectionMeanStandard DeviationRange
110.51.977142106448326
211.58333333333330.7929614610987592
311.52.5761140573281411
410.08333333333331.831955405041466
513.583333333333314.151507040423356
610.91666666666672.574643252722198
710.16666666666671.749458790771044
820.2525.291482576335790
911.41666666666672.108783937953278
10111.537412229571615
119.751.544785951633314
1210.16666666666671.898963034411317
1310.58333333333332.6097137890209510
1411.08333333333331.781640374554426
1510.41666666666671.928651593652157
169.333333333333332.188122205883119
17111.809068067466586
1810.41666666666671.729862492345636
1910.251.912875037500076
2010.41666666666672.108783937953277
2110.08333333333332.151461800448228
2210.08333333333331.676486224400925
2310.16666666666671.527525231651954
2410.91666666666672.065224325624588
2510.66666666666673.6013465495140812
2610.83333333333332.329000305762637
2710.33333333333331.92275055505645
2810.252.667140109487389
2918.833333333333325.380140172022691
3011.58333333333330.9962049198956223
3110.83333333333331.585922922197524
3212.251.815338686155996
3318.416666666666725.450337855708391
3411.66666666666673.0846639225613412
3517.7525.740399799113197
3616.666666666666722.556326801761881
3710.33333333333333.3393884397468914
381126
3910.66666666666671.825741858350556
4011.41666666666671.621353717973936
41101.858640754569178
42112.29624198914827
4312.41666666666672.234373344457968
449.916666666666673.0883456393154611
4510.58333333333331.505042031024894
4610.83333333333331.267304464625853
4710.251.959823739755467
4810.08333333333331.505042031024895
49111.906925178491186
5011.751.544785951633315
5111.33333333333331.723280873710667
5210.252.094364733365148
539.252.261335084333238
5411.08333333333332.274696116900557
5511.58333333333332.874917653629678
5610.33333333333331.61432976992335
5710.33333333333331.92275055505647
5811.41666666666671.564279289951035
5915.083333333333317.40145413638262
6012.583333333333311.904608224116343
619.833333333333332.405801069888947
6211.33333333333331.969463855669327
6310.751.65831239517774
6410.58333333333331.378954368902454
6518.333333333333325.492720291855691
6611.58333333333331.621353717973935
6718.7525.313040117694390
6825.666666666666734.277830984029691
6925.916666666666734.153286367448990
70112.215646837627997
7124.583333333333334.817598301938594

\begin{tabular}{lllllllll}
\hline
Standard Deviation-Mean Plot \tabularnewline
Section & Mean & Standard Deviation & Range \tabularnewline
1 & 10.5 & 1.97714210644832 & 6 \tabularnewline
2 & 11.5833333333333 & 0.792961461098759 & 2 \tabularnewline
3 & 11.5 & 2.57611405732814 & 11 \tabularnewline
4 & 10.0833333333333 & 1.83195540504146 & 6 \tabularnewline
5 & 13.5833333333333 & 14.1515070404233 & 56 \tabularnewline
6 & 10.9166666666667 & 2.57464325272219 & 8 \tabularnewline
7 & 10.1666666666667 & 1.74945879077104 & 4 \tabularnewline
8 & 20.25 & 25.2914825763357 & 90 \tabularnewline
9 & 11.4166666666667 & 2.10878393795327 & 8 \tabularnewline
10 & 11 & 1.53741222957161 & 5 \tabularnewline
11 & 9.75 & 1.54478595163331 & 4 \tabularnewline
12 & 10.1666666666667 & 1.89896303441131 & 7 \tabularnewline
13 & 10.5833333333333 & 2.60971378902095 & 10 \tabularnewline
14 & 11.0833333333333 & 1.78164037455442 & 6 \tabularnewline
15 & 10.4166666666667 & 1.92865159365215 & 7 \tabularnewline
16 & 9.33333333333333 & 2.18812220588311 & 9 \tabularnewline
17 & 11 & 1.80906806746658 & 6 \tabularnewline
18 & 10.4166666666667 & 1.72986249234563 & 6 \tabularnewline
19 & 10.25 & 1.91287503750007 & 6 \tabularnewline
20 & 10.4166666666667 & 2.10878393795327 & 7 \tabularnewline
21 & 10.0833333333333 & 2.15146180044822 & 8 \tabularnewline
22 & 10.0833333333333 & 1.67648622440092 & 5 \tabularnewline
23 & 10.1666666666667 & 1.52752523165195 & 4 \tabularnewline
24 & 10.9166666666667 & 2.06522432562458 & 8 \tabularnewline
25 & 10.6666666666667 & 3.60134654951408 & 12 \tabularnewline
26 & 10.8333333333333 & 2.32900030576263 & 7 \tabularnewline
27 & 10.3333333333333 & 1.9227505550564 & 5 \tabularnewline
28 & 10.25 & 2.66714010948738 & 9 \tabularnewline
29 & 18.8333333333333 & 25.3801401720226 & 91 \tabularnewline
30 & 11.5833333333333 & 0.996204919895622 & 3 \tabularnewline
31 & 10.8333333333333 & 1.58592292219752 & 4 \tabularnewline
32 & 12.25 & 1.81533868615599 & 6 \tabularnewline
33 & 18.4166666666667 & 25.4503378557083 & 91 \tabularnewline
34 & 11.6666666666667 & 3.08466392256134 & 12 \tabularnewline
35 & 17.75 & 25.7403997991131 & 97 \tabularnewline
36 & 16.6666666666667 & 22.5563268017618 & 81 \tabularnewline
37 & 10.3333333333333 & 3.33938843974689 & 14 \tabularnewline
38 & 11 & 2 & 6 \tabularnewline
39 & 10.6666666666667 & 1.82574185835055 & 6 \tabularnewline
40 & 11.4166666666667 & 1.62135371797393 & 6 \tabularnewline
41 & 10 & 1.85864075456917 & 8 \tabularnewline
42 & 11 & 2.2962419891482 & 7 \tabularnewline
43 & 12.4166666666667 & 2.23437334445796 & 8 \tabularnewline
44 & 9.91666666666667 & 3.08834563931546 & 11 \tabularnewline
45 & 10.5833333333333 & 1.50504203102489 & 4 \tabularnewline
46 & 10.8333333333333 & 1.26730446462585 & 3 \tabularnewline
47 & 10.25 & 1.95982373975546 & 7 \tabularnewline
48 & 10.0833333333333 & 1.50504203102489 & 5 \tabularnewline
49 & 11 & 1.90692517849118 & 6 \tabularnewline
50 & 11.75 & 1.54478595163331 & 5 \tabularnewline
51 & 11.3333333333333 & 1.72328087371066 & 7 \tabularnewline
52 & 10.25 & 2.09436473336514 & 8 \tabularnewline
53 & 9.25 & 2.26133508433323 & 8 \tabularnewline
54 & 11.0833333333333 & 2.27469611690055 & 7 \tabularnewline
55 & 11.5833333333333 & 2.87491765362967 & 8 \tabularnewline
56 & 10.3333333333333 & 1.6143297699233 & 5 \tabularnewline
57 & 10.3333333333333 & 1.9227505550564 & 7 \tabularnewline
58 & 11.4166666666667 & 1.56427928995103 & 5 \tabularnewline
59 & 15.0833333333333 & 17.401454136382 & 62 \tabularnewline
60 & 12.5833333333333 & 11.9046082241163 & 43 \tabularnewline
61 & 9.83333333333333 & 2.40580106988894 & 7 \tabularnewline
62 & 11.3333333333333 & 1.96946385566932 & 7 \tabularnewline
63 & 10.75 & 1.6583123951777 & 4 \tabularnewline
64 & 10.5833333333333 & 1.37895436890245 & 4 \tabularnewline
65 & 18.3333333333333 & 25.4927202918556 & 91 \tabularnewline
66 & 11.5833333333333 & 1.62135371797393 & 5 \tabularnewline
67 & 18.75 & 25.3130401176943 & 90 \tabularnewline
68 & 25.6666666666667 & 34.2778309840296 & 91 \tabularnewline
69 & 25.9166666666667 & 34.1532863674489 & 90 \tabularnewline
70 & 11 & 2.21564683762799 & 7 \tabularnewline
71 & 24.5833333333333 & 34.8175983019385 & 94 \tabularnewline
\hline
\end{tabular}
%Source: https://freestatistics.org/blog/index.php?pk=231138&T=1

[TABLE]
[ROW][C]Standard Deviation-Mean Plot[/C][/ROW]
[ROW][C]Section[/C][C]Mean[/C][C]Standard Deviation[/C][C]Range[/C][/ROW]
[ROW][C]1[/C][C]10.5[/C][C]1.97714210644832[/C][C]6[/C][/ROW]
[ROW][C]2[/C][C]11.5833333333333[/C][C]0.792961461098759[/C][C]2[/C][/ROW]
[ROW][C]3[/C][C]11.5[/C][C]2.57611405732814[/C][C]11[/C][/ROW]
[ROW][C]4[/C][C]10.0833333333333[/C][C]1.83195540504146[/C][C]6[/C][/ROW]
[ROW][C]5[/C][C]13.5833333333333[/C][C]14.1515070404233[/C][C]56[/C][/ROW]
[ROW][C]6[/C][C]10.9166666666667[/C][C]2.57464325272219[/C][C]8[/C][/ROW]
[ROW][C]7[/C][C]10.1666666666667[/C][C]1.74945879077104[/C][C]4[/C][/ROW]
[ROW][C]8[/C][C]20.25[/C][C]25.2914825763357[/C][C]90[/C][/ROW]
[ROW][C]9[/C][C]11.4166666666667[/C][C]2.10878393795327[/C][C]8[/C][/ROW]
[ROW][C]10[/C][C]11[/C][C]1.53741222957161[/C][C]5[/C][/ROW]
[ROW][C]11[/C][C]9.75[/C][C]1.54478595163331[/C][C]4[/C][/ROW]
[ROW][C]12[/C][C]10.1666666666667[/C][C]1.89896303441131[/C][C]7[/C][/ROW]
[ROW][C]13[/C][C]10.5833333333333[/C][C]2.60971378902095[/C][C]10[/C][/ROW]
[ROW][C]14[/C][C]11.0833333333333[/C][C]1.78164037455442[/C][C]6[/C][/ROW]
[ROW][C]15[/C][C]10.4166666666667[/C][C]1.92865159365215[/C][C]7[/C][/ROW]
[ROW][C]16[/C][C]9.33333333333333[/C][C]2.18812220588311[/C][C]9[/C][/ROW]
[ROW][C]17[/C][C]11[/C][C]1.80906806746658[/C][C]6[/C][/ROW]
[ROW][C]18[/C][C]10.4166666666667[/C][C]1.72986249234563[/C][C]6[/C][/ROW]
[ROW][C]19[/C][C]10.25[/C][C]1.91287503750007[/C][C]6[/C][/ROW]
[ROW][C]20[/C][C]10.4166666666667[/C][C]2.10878393795327[/C][C]7[/C][/ROW]
[ROW][C]21[/C][C]10.0833333333333[/C][C]2.15146180044822[/C][C]8[/C][/ROW]
[ROW][C]22[/C][C]10.0833333333333[/C][C]1.67648622440092[/C][C]5[/C][/ROW]
[ROW][C]23[/C][C]10.1666666666667[/C][C]1.52752523165195[/C][C]4[/C][/ROW]
[ROW][C]24[/C][C]10.9166666666667[/C][C]2.06522432562458[/C][C]8[/C][/ROW]
[ROW][C]25[/C][C]10.6666666666667[/C][C]3.60134654951408[/C][C]12[/C][/ROW]
[ROW][C]26[/C][C]10.8333333333333[/C][C]2.32900030576263[/C][C]7[/C][/ROW]
[ROW][C]27[/C][C]10.3333333333333[/C][C]1.9227505550564[/C][C]5[/C][/ROW]
[ROW][C]28[/C][C]10.25[/C][C]2.66714010948738[/C][C]9[/C][/ROW]
[ROW][C]29[/C][C]18.8333333333333[/C][C]25.3801401720226[/C][C]91[/C][/ROW]
[ROW][C]30[/C][C]11.5833333333333[/C][C]0.996204919895622[/C][C]3[/C][/ROW]
[ROW][C]31[/C][C]10.8333333333333[/C][C]1.58592292219752[/C][C]4[/C][/ROW]
[ROW][C]32[/C][C]12.25[/C][C]1.81533868615599[/C][C]6[/C][/ROW]
[ROW][C]33[/C][C]18.4166666666667[/C][C]25.4503378557083[/C][C]91[/C][/ROW]
[ROW][C]34[/C][C]11.6666666666667[/C][C]3.08466392256134[/C][C]12[/C][/ROW]
[ROW][C]35[/C][C]17.75[/C][C]25.7403997991131[/C][C]97[/C][/ROW]
[ROW][C]36[/C][C]16.6666666666667[/C][C]22.5563268017618[/C][C]81[/C][/ROW]
[ROW][C]37[/C][C]10.3333333333333[/C][C]3.33938843974689[/C][C]14[/C][/ROW]
[ROW][C]38[/C][C]11[/C][C]2[/C][C]6[/C][/ROW]
[ROW][C]39[/C][C]10.6666666666667[/C][C]1.82574185835055[/C][C]6[/C][/ROW]
[ROW][C]40[/C][C]11.4166666666667[/C][C]1.62135371797393[/C][C]6[/C][/ROW]
[ROW][C]41[/C][C]10[/C][C]1.85864075456917[/C][C]8[/C][/ROW]
[ROW][C]42[/C][C]11[/C][C]2.2962419891482[/C][C]7[/C][/ROW]
[ROW][C]43[/C][C]12.4166666666667[/C][C]2.23437334445796[/C][C]8[/C][/ROW]
[ROW][C]44[/C][C]9.91666666666667[/C][C]3.08834563931546[/C][C]11[/C][/ROW]
[ROW][C]45[/C][C]10.5833333333333[/C][C]1.50504203102489[/C][C]4[/C][/ROW]
[ROW][C]46[/C][C]10.8333333333333[/C][C]1.26730446462585[/C][C]3[/C][/ROW]
[ROW][C]47[/C][C]10.25[/C][C]1.95982373975546[/C][C]7[/C][/ROW]
[ROW][C]48[/C][C]10.0833333333333[/C][C]1.50504203102489[/C][C]5[/C][/ROW]
[ROW][C]49[/C][C]11[/C][C]1.90692517849118[/C][C]6[/C][/ROW]
[ROW][C]50[/C][C]11.75[/C][C]1.54478595163331[/C][C]5[/C][/ROW]
[ROW][C]51[/C][C]11.3333333333333[/C][C]1.72328087371066[/C][C]7[/C][/ROW]
[ROW][C]52[/C][C]10.25[/C][C]2.09436473336514[/C][C]8[/C][/ROW]
[ROW][C]53[/C][C]9.25[/C][C]2.26133508433323[/C][C]8[/C][/ROW]
[ROW][C]54[/C][C]11.0833333333333[/C][C]2.27469611690055[/C][C]7[/C][/ROW]
[ROW][C]55[/C][C]11.5833333333333[/C][C]2.87491765362967[/C][C]8[/C][/ROW]
[ROW][C]56[/C][C]10.3333333333333[/C][C]1.6143297699233[/C][C]5[/C][/ROW]
[ROW][C]57[/C][C]10.3333333333333[/C][C]1.9227505550564[/C][C]7[/C][/ROW]
[ROW][C]58[/C][C]11.4166666666667[/C][C]1.56427928995103[/C][C]5[/C][/ROW]
[ROW][C]59[/C][C]15.0833333333333[/C][C]17.401454136382[/C][C]62[/C][/ROW]
[ROW][C]60[/C][C]12.5833333333333[/C][C]11.9046082241163[/C][C]43[/C][/ROW]
[ROW][C]61[/C][C]9.83333333333333[/C][C]2.40580106988894[/C][C]7[/C][/ROW]
[ROW][C]62[/C][C]11.3333333333333[/C][C]1.96946385566932[/C][C]7[/C][/ROW]
[ROW][C]63[/C][C]10.75[/C][C]1.6583123951777[/C][C]4[/C][/ROW]
[ROW][C]64[/C][C]10.5833333333333[/C][C]1.37895436890245[/C][C]4[/C][/ROW]
[ROW][C]65[/C][C]18.3333333333333[/C][C]25.4927202918556[/C][C]91[/C][/ROW]
[ROW][C]66[/C][C]11.5833333333333[/C][C]1.62135371797393[/C][C]5[/C][/ROW]
[ROW][C]67[/C][C]18.75[/C][C]25.3130401176943[/C][C]90[/C][/ROW]
[ROW][C]68[/C][C]25.6666666666667[/C][C]34.2778309840296[/C][C]91[/C][/ROW]
[ROW][C]69[/C][C]25.9166666666667[/C][C]34.1532863674489[/C][C]90[/C][/ROW]
[ROW][C]70[/C][C]11[/C][C]2.21564683762799[/C][C]7[/C][/ROW]
[ROW][C]71[/C][C]24.5833333333333[/C][C]34.8175983019385[/C][C]94[/C][/ROW]
[/TABLE]
Source: https://freestatistics.org/blog/index.php?pk=231138&T=1

Globally Unique Identifier (entire table): ba.freestatistics.org/blog/index.php?pk=231138&T=1

As an alternative you can also use a QR Code:  

The GUIDs for individual cells are displayed in the table below:

Standard Deviation-Mean Plot
SectionMeanStandard DeviationRange
110.51.977142106448326
211.58333333333330.7929614610987592
311.52.5761140573281411
410.08333333333331.831955405041466
513.583333333333314.151507040423356
610.91666666666672.574643252722198
710.16666666666671.749458790771044
820.2525.291482576335790
911.41666666666672.108783937953278
10111.537412229571615
119.751.544785951633314
1210.16666666666671.898963034411317
1310.58333333333332.6097137890209510
1411.08333333333331.781640374554426
1510.41666666666671.928651593652157
169.333333333333332.188122205883119
17111.809068067466586
1810.41666666666671.729862492345636
1910.251.912875037500076
2010.41666666666672.108783937953277
2110.08333333333332.151461800448228
2210.08333333333331.676486224400925
2310.16666666666671.527525231651954
2410.91666666666672.065224325624588
2510.66666666666673.6013465495140812
2610.83333333333332.329000305762637
2710.33333333333331.92275055505645
2810.252.667140109487389
2918.833333333333325.380140172022691
3011.58333333333330.9962049198956223
3110.83333333333331.585922922197524
3212.251.815338686155996
3318.416666666666725.450337855708391
3411.66666666666673.0846639225613412
3517.7525.740399799113197
3616.666666666666722.556326801761881
3710.33333333333333.3393884397468914
381126
3910.66666666666671.825741858350556
4011.41666666666671.621353717973936
41101.858640754569178
42112.29624198914827
4312.41666666666672.234373344457968
449.916666666666673.0883456393154611
4510.58333333333331.505042031024894
4610.83333333333331.267304464625853
4710.251.959823739755467
4810.08333333333331.505042031024895
49111.906925178491186
5011.751.544785951633315
5111.33333333333331.723280873710667
5210.252.094364733365148
539.252.261335084333238
5411.08333333333332.274696116900557
5511.58333333333332.874917653629678
5610.33333333333331.61432976992335
5710.33333333333331.92275055505647
5811.41666666666671.564279289951035
5915.083333333333317.40145413638262
6012.583333333333311.904608224116343
619.833333333333332.405801069888947
6211.33333333333331.969463855669327
6310.751.65831239517774
6410.58333333333331.378954368902454
6518.333333333333325.492720291855691
6611.58333333333331.621353717973935
6718.7525.313040117694390
6825.666666666666734.277830984029691
6925.916666666666734.153286367448990
70112.215646837627997
7124.583333333333334.817598301938594


Regression: S.E.(k) = alpha + beta * Mean(k)
alpha-23.6243316468202
beta2.43485535258571
S.D.0.0807508439437339
T-STAT30.1526923270583
p-value1.84984263294566e-41

\begin{tabular}{lllllllll}
\hline
Regression: S.E.(k) = alpha + beta * Mean(k) \tabularnewline
alpha & -23.6243316468202 \tabularnewline
beta & 2.43485535258571 \tabularnewline
S.D. & 0.0807508439437339 \tabularnewline
T-STAT & 30.1526923270583 \tabularnewline
p-value & 1.84984263294566e-41 \tabularnewline
\hline
\end{tabular}
%Source: https://freestatistics.org/blog/index.php?pk=231138&T=2

[TABLE]
[ROW][C]Regression: S.E.(k) = alpha + beta * Mean(k)[/C][/ROW]
[ROW][C]alpha[/C][C]-23.6243316468202[/C][/ROW]
[ROW][C]beta[/C][C]2.43485535258571[/C][/ROW]
[ROW][C]S.D.[/C][C]0.0807508439437339[/C][/ROW]
[ROW][C]T-STAT[/C][C]30.1526923270583[/C][/ROW]
[ROW][C]p-value[/C][C]1.84984263294566e-41[/C][/ROW]
[/TABLE]
Source: https://freestatistics.org/blog/index.php?pk=231138&T=2

Globally Unique Identifier (entire table): ba.freestatistics.org/blog/index.php?pk=231138&T=2

As an alternative you can also use a QR Code:  

The GUIDs for individual cells are displayed in the table below:

Regression: S.E.(k) = alpha + beta * Mean(k)
alpha-23.6243316468202
beta2.43485535258571
S.D.0.0807508439437339
T-STAT30.1526923270583
p-value1.84984263294566e-41


Regression: ln S.E.(k) = alpha + beta * ln Mean(k)
alpha-8.31093376794258
beta3.81435553504291
S.D.0.222722346858183
T-STAT17.1260566748233
p-value1.50575124036882e-26
Lambda-2.81435553504291

\begin{tabular}{lllllllll}
\hline
Regression: ln S.E.(k) = alpha + beta * ln Mean(k) \tabularnewline
alpha & -8.31093376794258 \tabularnewline
beta & 3.81435553504291 \tabularnewline
S.D. & 0.222722346858183 \tabularnewline
T-STAT & 17.1260566748233 \tabularnewline
p-value & 1.50575124036882e-26 \tabularnewline
Lambda & -2.81435553504291 \tabularnewline
\hline
\end{tabular}
%Source: https://freestatistics.org/blog/index.php?pk=231138&T=3

[TABLE]
[ROW][C]Regression: ln S.E.(k) = alpha + beta * ln Mean(k)[/C][/ROW]
[ROW][C]alpha[/C][C]-8.31093376794258[/C][/ROW]
[ROW][C]beta[/C][C]3.81435553504291[/C][/ROW]
[ROW][C]S.D.[/C][C]0.222722346858183[/C][/ROW]
[ROW][C]T-STAT[/C][C]17.1260566748233[/C][/ROW]
[ROW][C]p-value[/C][C]1.50575124036882e-26[/C][/ROW]
[ROW][C]Lambda[/C][C]-2.81435553504291[/C][/ROW]
[/TABLE]
Source: https://freestatistics.org/blog/index.php?pk=231138&T=3

Globally Unique Identifier (entire table): ba.freestatistics.org/blog/index.php?pk=231138&T=3

As an alternative you can also use a QR Code:  

The GUIDs for individual cells are displayed in the table below:

Regression: ln S.E.(k) = alpha + beta * ln Mean(k)
alpha-8.31093376794258
beta3.81435553504291
S.D.0.222722346858183
T-STAT17.1260566748233
p-value1.50575124036882e-26
Lambda-2.81435553504291


Parameters (Session):
par1 = 12 ;
Parameters (R input):
par1 = 12 ;
R code (references can be found in the software module):
par1 <- as.numeric(par1)
(n <- length(x))
(np <- floor(n / par1))
arr <- array(NA,dim=c(par1,np))
j <- 0
k <- 1
for (i in 1:(np*par1))
{
j = j + 1
arr[j,k] <- x[i]
if (j == par1) {
j = 0
k=k+1
}
}
arr
arr.mean <- array(NA,dim=np)
arr.sd <- array(NA,dim=np)
arr.range <- array(NA,dim=np)
for (j in 1:np)
{
arr.mean[j] <- mean(arr[,j],na.rm=TRUE)
arr.sd[j] <- sd(arr[,j],na.rm=TRUE)
arr.range[j] <- max(arr[,j],na.rm=TRUE) - min(arr[,j],na.rm=TRUE)
}
arr.mean
arr.sd
arr.range
(lm1 <- lm(arr.sd~arr.mean))
(lnlm1 <- lm(log(arr.sd)~log(arr.mean)))
(lm2 <- lm(arr.range~arr.mean))
bitmap(file='test1.png')
plot(arr.mean,arr.sd,main='Standard Deviation-Mean Plot',xlab='mean',ylab='standard deviation')
dev.off()
bitmap(file='test2.png')
plot(arr.mean,arr.range,main='Range-Mean Plot',xlab='mean',ylab='range')
dev.off()
load(file='createtable')
a<-table.start()
a<-table.row.start(a)
a<-table.element(a,'Standard Deviation-Mean Plot',4,TRUE)
a<-table.row.end(a)
a<-table.row.start(a)
a<-table.element(a,'Section',header=TRUE)
a<-table.element(a,'Mean',header=TRUE)
a<-table.element(a,'Standard Deviation',header=TRUE)
a<-table.element(a,'Range',header=TRUE)
a<-table.row.end(a)
for (j in 1:np) {
a<-table.row.start(a)
a<-table.element(a,j,header=TRUE)
a<-table.element(a,arr.mean[j])
a<-table.element(a,arr.sd[j] )
a<-table.element(a,arr.range[j] )
a<-table.row.end(a)
}
a<-table.end(a)
table.save(a,file='mytable.tab')
a<-table.start()
a<-table.row.start(a)
a<-table.element(a,'Regression: S.E.(k) = alpha + beta * Mean(k)',2,TRUE)
a<-table.row.end(a)
a<-table.row.start(a)
a<-table.element(a,'alpha',header=TRUE)
a<-table.element(a,lm1$coefficients[[1]])
a<-table.row.end(a)
a<-table.row.start(a)
a<-table.element(a,'beta',header=TRUE)
a<-table.element(a,lm1$coefficients[[2]])
a<-table.row.end(a)
a<-table.row.start(a)
a<-table.element(a,'S.D.',header=TRUE)
a<-table.element(a,summary(lm1)$coefficients[2,2])
a<-table.row.end(a)
a<-table.row.start(a)
a<-table.element(a,'T-STAT',header=TRUE)
a<-table.element(a,summary(lm1)$coefficients[2,3])
a<-table.row.end(a)
a<-table.row.start(a)
a<-table.element(a,'p-value',header=TRUE)
a<-table.element(a,summary(lm1)$coefficients[2,4])
a<-table.row.end(a)
a<-table.end(a)
table.save(a,file='mytable1.tab')
a<-table.start()
a<-table.row.start(a)
a<-table.element(a,'Regression: ln S.E.(k) = alpha + beta * ln Mean(k)',2,TRUE)
a<-table.row.end(a)
a<-table.row.start(a)
a<-table.element(a,'alpha',header=TRUE)
a<-table.element(a,lnlm1$coefficients[[1]])
a<-table.row.end(a)
a<-table.row.start(a)
a<-table.element(a,'beta',header=TRUE)
a<-table.element(a,lnlm1$coefficients[[2]])
a<-table.row.end(a)
a<-table.row.start(a)
a<-table.element(a,'S.D.',header=TRUE)
a<-table.element(a,summary(lnlm1)$coefficients[2,2])
a<-table.row.end(a)
a<-table.row.start(a)
a<-table.element(a,'T-STAT',header=TRUE)
a<-table.element(a,summary(lnlm1)$coefficients[2,3])
a<-table.row.end(a)
a<-table.row.start(a)
a<-table.element(a,'p-value',header=TRUE)
a<-table.element(a,summary(lnlm1)$coefficients[2,4])
a<-table.row.end(a)
a<-table.row.start(a)
a<-table.element(a,'Lambda',header=TRUE)
a<-table.element(a,1-lnlm1$coefficients[[2]])
a<-table.row.end(a)
a<-table.end(a)
table.save(a,file='mytable2.tab')