Free Statistics
of Irreproducible Research!
Description of Statistical Computation | |||||||||||||||||||||||||||||||||||||||||
|---|---|---|---|---|---|---|---|---|---|---|---|---|---|---|---|---|---|---|---|---|---|---|---|---|---|---|---|---|---|---|---|---|---|---|---|---|---|---|---|---|---|
| Author's title | |||||||||||||||||||||||||||||||||||||||||
| Author | *The author of this computation has been verified* | ||||||||||||||||||||||||||||||||||||||||
| R Software Module | rwasp_univariatedataseries.wasp | ||||||||||||||||||||||||||||||||||||||||
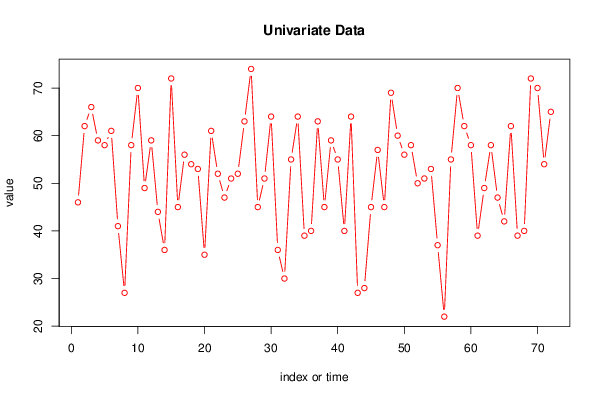
| Title produced by software | Univariate Data Series | ||||||||||||||||||||||||||||||||||||||||
| Date of computation | Wed, 04 Dec 2013 09:18:19 -0500 | ||||||||||||||||||||||||||||||||||||||||
| Cite this page as follows | Statistical Computations at FreeStatistics.org, Office for Research Development and Education, URL https://freestatistics.org/blog/index.php?v=date/2013/Dec/04/t1386167301vmf8r4ww0384muk.htm/, Retrieved Fri, 19 Apr 2024 16:51:57 +0000 | ||||||||||||||||||||||||||||||||||||||||
| Statistical Computations at FreeStatistics.org, Office for Research Development and Education, URL https://freestatistics.org/blog/index.php?pk=230617, Retrieved Fri, 19 Apr 2024 16:51:57 +0000 | |||||||||||||||||||||||||||||||||||||||||
| QR Codes: | |||||||||||||||||||||||||||||||||||||||||
|
| |||||||||||||||||||||||||||||||||||||||||
| Original text written by user: | |||||||||||||||||||||||||||||||||||||||||
| IsPrivate? | No (this computation is public) | ||||||||||||||||||||||||||||||||||||||||
| User-defined keywords | |||||||||||||||||||||||||||||||||||||||||
| Estimated Impact | 79 | ||||||||||||||||||||||||||||||||||||||||
Tree of Dependent Computations | |||||||||||||||||||||||||||||||||||||||||
| Family? (F = Feedback message, R = changed R code, M = changed R Module, P = changed Parameters, D = changed Data) | |||||||||||||||||||||||||||||||||||||||||
| - [Univariate Data Series] [] [2008-12-14 11:54:22] [d2d412c7f4d35ffbf5ee5ee89db327d4] - RMP [Univariate Data Series] [WS 9 - Univariate...] [2013-12-04 14:18:19] [022e78770bd486b2574ab5ebcc241092] [Current] | |||||||||||||||||||||||||||||||||||||||||
| Feedback Forum | |||||||||||||||||||||||||||||||||||||||||
Post a new message | |||||||||||||||||||||||||||||||||||||||||
Dataset | |||||||||||||||||||||||||||||||||||||||||
| Dataseries X: | |||||||||||||||||||||||||||||||||||||||||
46 62 66 59 58 61 41 27 58 70 49 59 44 36 72 45 56 54 53 35 61 52 47 51 52 63 74 45 51 64 36 30 55 64 39 40 63 45 59 55 40 64 27 28 45 57 45 69 60 56 58 50 51 53 37 22 55 70 62 58 39 49 58 47 42 62 39 40 72 70 54 65 | |||||||||||||||||||||||||||||||||||||||||
Tables (Output of Computation) | |||||||||||||||||||||||||||||||||||||||||
| |||||||||||||||||||||||||||||||||||||||||
Figures (Output of Computation) | |||||||||||||||||||||||||||||||||||||||||
Input Parameters & R Code | |||||||||||||||||||||||||||||||||||||||||
| Parameters (Session): | |||||||||||||||||||||||||||||||||||||||||
| par1 = aantal faillisementen ; par2 = ecodata ; par3 = http://ecodata.economie.fgov.be/mdn/faillissementen.jsp?ROWDIMENSIONS=Jaar%2CActiviteit&ROWDIMENSIONS=Maand&COLUMNDIMENSIONS=Geografische+zone&STATISTICSPERMEASURE=number:SUM ; par4 = 12 ; | |||||||||||||||||||||||||||||||||||||||||
| Parameters (R input): | |||||||||||||||||||||||||||||||||||||||||
| par1 = aantal faillisementen ; par2 = ecodata ; par3 = http://ecodata.economie.fgov.be/mdn/faillissementen.jsp?ROWDIMENSIONS=Jaar%2CActiviteit&ROWDIMENSIONS=Maand&COLUMNDIMENSIONS=Geografische+zone&STATISTICSPERMEASURE=number:SUM ; par4 = 12 ; | |||||||||||||||||||||||||||||||||||||||||
| R code (references can be found in the software module): | |||||||||||||||||||||||||||||||||||||||||
bitmap(file='test1.png') | |||||||||||||||||||||||||||||||||||||||||