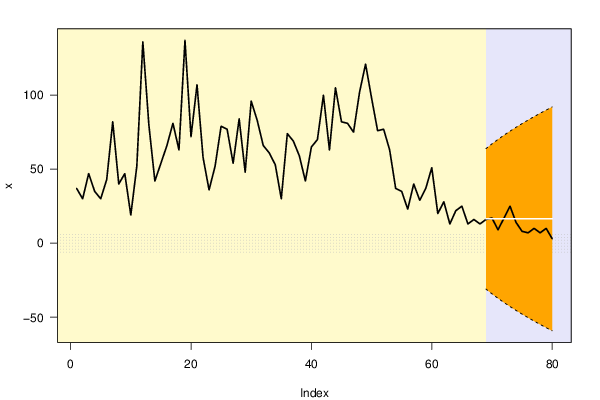
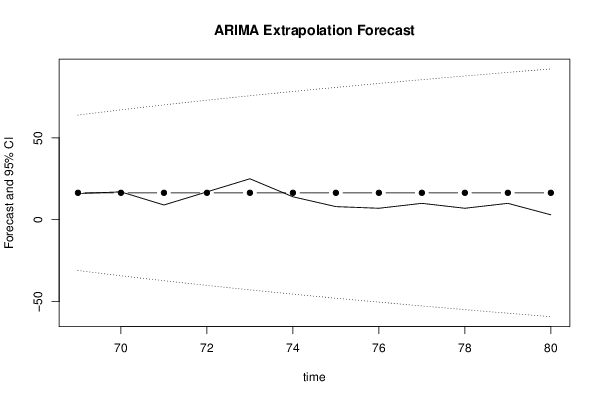
| Univariate ARIMA Extrapolation Forecast | ||||||||
| time | Y[t] | F[t] | 95% LB | 95% UB | p-value (H0: Y[t] = F[t]) | P(F[t]>Y[t-1]) | P(F[t]>Y[t-s]) | P(F[t]>Y[68]) |
| 56 | 23 | - | - | - | - | - | - | - |
| 57 | 40 | - | - | - | - | - | - | - |
| 58 | 29 | - | - | - | - | - | - | - |
| 59 | 37 | - | - | - | - | - | - | - |
| 60 | 51 | - | - | - | - | - | - | - |
| 61 | 20 | - | - | - | - | - | - | - |
| 62 | 28 | - | - | - | - | - | - | - |
| 63 | 13 | - | - | - | - | - | - | - |
| 64 | 22 | - | - | - | - | - | - | - |
| 65 | 25 | - | - | - | - | - | - | - |
| 66 | 13 | - | - | - | - | - | - | - |
| 67 | 16 | - | - | - | - | - | - | - |
| 68 | 13 | - | - | - | - | - | - | - |
| 69 | 16 | 16.4372 | -31.0135 | 63.888 | 0.4928 | 0.5565 | 0.1652 | 0.5565 |
| 70 | 17 | 16.4372 | -34.2262 | 67.1007 | 0.4913 | 0.5067 | 0.3135 | 0.5529 |
| 71 | 9 | 16.4372 | -37.2471 | 70.1216 | 0.393 | 0.4918 | 0.2264 | 0.5499 |
| 72 | 17 | 16.4372 | -40.1068 | 72.9813 | 0.4922 | 0.6017 | 0.1154 | 0.5474 |
| 73 | 25 | 16.4372 | -42.8286 | 75.7031 | 0.3885 | 0.4926 | 0.4531 | 0.5453 |
| 74 | 14 | 16.4372 | -45.4308 | 78.3053 | 0.4692 | 0.3931 | 0.3571 | 0.5434 |
| 75 | 8 | 16.4372 | -47.9279 | 80.8024 | 0.3986 | 0.5296 | 0.5417 | 0.5417 |
| 76 | 7 | 16.4372 | -50.3317 | 83.2062 | 0.3909 | 0.5978 | 0.4351 | 0.5402 |
| 77 | 10 | 16.4372 | -52.6519 | 85.5264 | 0.4275 | 0.6055 | 0.404 | 0.5388 |
| 78 | 7 | 16.4372 | -54.8967 | 87.7712 | 0.3977 | 0.5702 | 0.5376 | 0.5376 |
| 79 | 10 | 16.4372 | -57.0729 | 89.9474 | 0.4319 | 0.5993 | 0.5047 | 0.5365 |
| 80 | 3 | 16.4372 | -59.1866 | 92.0611 | 0.3638 | 0.5663 | 0.5355 | 0.5355 |
| Univariate ARIMA Extrapolation Forecast Performance | |||||||||
| time | % S.E. | PE | MAPE | sMAPE | Sq.E | MSE | RMSE | ScaledE | MASE |
| 69 | 1.4728 | -0.0273 | 0.0273 | 0.027 | 0.1912 | 0 | 0 | -0.0815 | 0.0815 |
| 70 | 1.5726 | 0.0331 | 0.0302 | 0.0303 | 0.3167 | 0.2539 | 0.5039 | 0.1049 | 0.0932 |
| 71 | 1.6663 | -0.8264 | 0.2956 | 0.2151 | 55.3127 | 18.6068 | 4.3136 | -1.3866 | 0.5243 |
| 72 | 1.7551 | 0.0331 | 0.23 | 0.1698 | 0.3167 | 14.0343 | 3.7462 | 0.1049 | 0.4195 |
| 73 | 1.8396 | 0.3425 | 0.2525 | 0.2185 | 73.3207 | 25.8916 | 5.0884 | 1.5964 | 0.6549 |
| 74 | 1.9204 | -0.1741 | 0.2394 | 0.2087 | 5.9402 | 22.5664 | 4.7504 | -0.4544 | 0.6215 |
| 75 | 1.9979 | -1.0547 | 0.3559 | 0.2776 | 71.1872 | 29.5122 | 5.4325 | -1.573 | 0.7574 |
| 76 | 2.0725 | -1.3482 | 0.4799 | 0.3435 | 89.0617 | 36.9559 | 6.0791 | -1.7595 | 0.8827 |
| 77 | 2.1445 | -0.6437 | 0.4981 | 0.3595 | 41.4382 | 37.4539 | 6.12 | -1.2002 | 0.9179 |
| 78 | 2.2142 | -1.3482 | 0.5831 | 0.4041 | 89.0617 | 42.6147 | 6.528 | -1.7595 | 1.0021 |
| 79 | 2.2817 | -0.6437 | 0.5886 | 0.4116 | 41.4382 | 42.5077 | 6.5198 | -1.2002 | 1.0201 |
| 80 | 2.3473 | -4.4791 | 0.9128 | 0.4925 | 180.5597 | 54.0121 | 7.3493 | -2.5052 | 1.1439 |