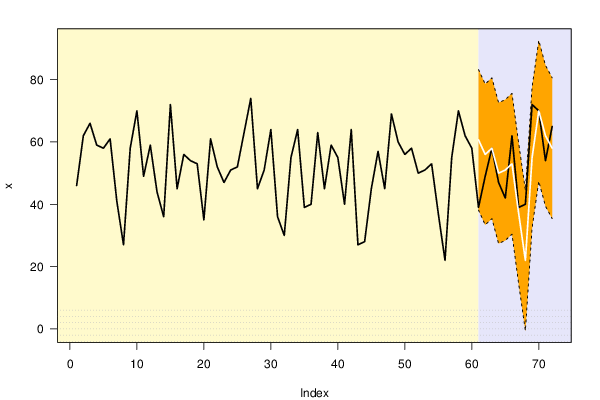
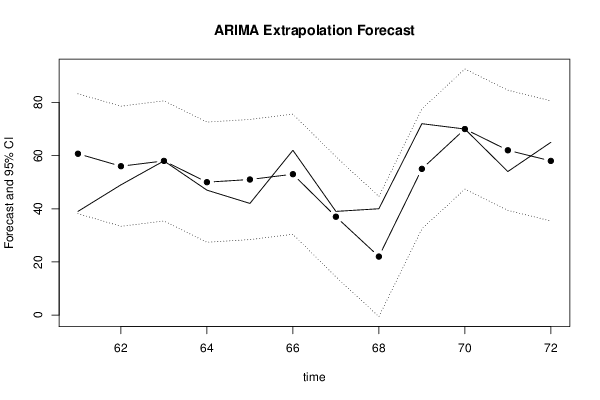
| Univariate ARIMA Extrapolation Forecast | ||||||||
| time | Y[t] | F[t] | 95% LB | 95% UB | p-value (H0: Y[t] = F[t]) | P(F[t]>Y[t-1]) | P(F[t]>Y[t-s]) | P(F[t]>Y[60]) |
| 48 | 69 | - | - | - | - | - | - | - |
| 49 | 60 | - | - | - | - | - | - | - |
| 50 | 56 | - | - | - | - | - | - | - |
| 51 | 58 | - | - | - | - | - | - | - |
| 52 | 50 | - | - | - | - | - | - | - |
| 53 | 51 | - | - | - | - | - | - | - |
| 54 | 53 | - | - | - | - | - | - | - |
| 55 | 37 | - | - | - | - | - | - | - |
| 56 | 22 | - | - | - | - | - | - | - |
| 57 | 55 | - | - | - | - | - | - | - |
| 58 | 70 | - | - | - | - | - | - | - |
| 59 | 62 | - | - | - | - | - | - | - |
| 60 | 58 | - | - | - | - | - | - | - |
| 61 | 39 | 60.6978 | 38.1515 | 83.2441 | 0.0296 | 0.5927 | 0.5242 | 0.5927 |
| 62 | 49 | 56 | 33.3955 | 78.6045 | 0.2719 | 0.9298 | 0.5 | 0.4312 |
| 63 | 58 | 58 | 35.3955 | 80.6045 | 0.5 | 0.7824 | 0.5 | 0.5 |
| 64 | 47 | 50 | 27.3955 | 72.6045 | 0.3974 | 0.2439 | 0.5 | 0.2439 |
| 65 | 42 | 51 | 28.3955 | 73.6045 | 0.2176 | 0.6356 | 0.5 | 0.2719 |
| 66 | 62 | 53 | 30.3955 | 75.6045 | 0.2176 | 0.8299 | 0.5 | 0.3323 |
| 67 | 39 | 37 | 14.3955 | 59.6045 | 0.4312 | 0.0151 | 0.5 | 0.0343 |
| 68 | 40 | 22 | -0.6045 | 44.6045 | 0.0593 | 0.0702 | 0.5 | 9e-04 |
| 69 | 72 | 55 | 32.3955 | 77.6045 | 0.0702 | 0.9033 | 0.5 | 0.3974 |
| 70 | 70 | 70 | 47.3955 | 92.6045 | 0.5 | 0.4312 | 0.5 | 0.8509 |
| 71 | 54 | 62 | 39.3955 | 84.6045 | 0.2439 | 0.2439 | 0.5 | 0.6356 |
| 72 | 65 | 58 | 35.3955 | 80.6045 | 0.2719 | 0.6356 | 0.5 | 0.5 |
| Univariate ARIMA Extrapolation Forecast Performance | |||||||||
| time | % S.E. | PE | MAPE | sMAPE | Sq.E | MSE | RMSE | ScaledE | MASE |
| 61 | 0.1895 | -0.5564 | 0.5564 | 0.4353 | 470.7948 | 0 | 0 | -1.7048 | 1.7048 |
| 62 | 0.2059 | -0.1429 | 0.3496 | 0.2843 | 49 | 259.8974 | 16.1213 | -0.55 | 1.1274 |
| 63 | 0.1988 | 0 | 0.2331 | 0.1895 | 0 | 173.2649 | 13.163 | 0 | 0.7516 |
| 64 | 0.2307 | -0.0638 | 0.1908 | 0.1576 | 9 | 132.1987 | 11.4978 | -0.2357 | 0.6226 |
| 65 | 0.2261 | -0.2143 | 0.1955 | 0.1648 | 81 | 121.959 | 11.0435 | -0.7071 | 0.6395 |
| 66 | 0.2176 | 0.1452 | 0.1871 | 0.1634 | 81 | 115.1325 | 10.73 | 0.7071 | 0.6508 |
| 67 | 0.3117 | 0.0513 | 0.1677 | 0.1476 | 4 | 99.2564 | 9.9628 | 0.1571 | 0.5803 |
| 68 | 0.5242 | 0.45 | 0.203 | 0.2017 | 324 | 127.3493 | 11.2849 | 1.4143 | 0.6845 |
| 69 | 0.2097 | 0.2361 | 0.2067 | 0.2091 | 289 | 145.3105 | 12.0545 | 1.3357 | 0.7569 |
| 70 | 0.1648 | 0 | 0.186 | 0.1882 | 0 | 130.7795 | 11.4359 | 0 | 0.6812 |
| 71 | 0.186 | -0.1481 | 0.1825 | 0.1836 | 64 | 124.7086 | 11.1673 | -0.6286 | 0.6764 |
| 72 | 0.1988 | 0.1077 | 0.1763 | 0.1778 | 49 | 118.3996 | 10.8812 | 0.55 | 0.6659 |