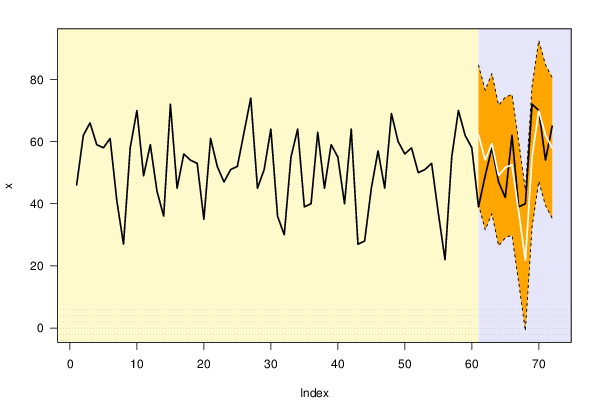
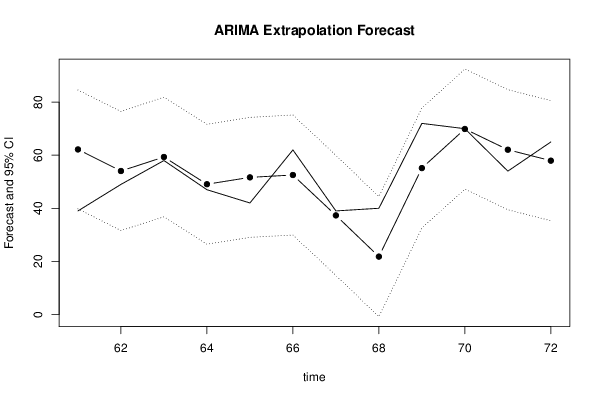
| Univariate ARIMA Extrapolation Forecast | ||||||||
| time | Y[t] | F[t] | 95% LB | 95% UB | p-value (H0: Y[t] = F[t]) | P(F[t]>Y[t-1]) | P(F[t]>Y[t-s]) | P(F[t]>Y[60]) |
| 48 | 69 | - | - | - | - | - | - | - |
| 49 | 60 | - | - | - | - | - | - | - |
| 50 | 56 | - | - | - | - | - | - | - |
| 51 | 58 | - | - | - | - | - | - | - |
| 52 | 50 | - | - | - | - | - | - | - |
| 53 | 51 | - | - | - | - | - | - | - |
| 54 | 53 | - | - | - | - | - | - | - |
| 55 | 37 | - | - | - | - | - | - | - |
| 56 | 22 | - | - | - | - | - | - | - |
| 57 | 55 | - | - | - | - | - | - | - |
| 58 | 70 | - | - | - | - | - | - | - |
| 59 | 62 | - | - | - | - | - | - | - |
| 60 | 58 | - | - | - | - | - | - | - |
| 61 | 39 | 62.1869 | 39.7923 | 84.5815 | 0.0212 | 0.643 | 0.5759 | 0.643 |
| 62 | 49 | 54.0501 | 31.6031 | 76.497 | 0.3296 | 0.9056 | 0.4324 | 0.3651 |
| 63 | 58 | 59.3323 | 36.7827 | 81.8819 | 0.4539 | 0.8154 | 0.5461 | 0.5461 |
| 64 | 47 | 49.0654 | 26.471 | 71.6598 | 0.4289 | 0.2192 | 0.4677 | 0.2192 |
| 65 | 42 | 51.6537 | 29.0372 | 74.2703 | 0.2014 | 0.6566 | 0.5226 | 0.2912 |
| 66 | 62 | 52.5426 | 29.9152 | 75.17 | 0.2063 | 0.8194 | 0.4842 | 0.3182 |
| 67 | 39 | 37.32 | 14.6873 | 59.9527 | 0.4422 | 0.0163 | 0.5111 | 0.0367 |
| 68 | 40 | 21.7761 | -0.8592 | 44.4114 | 0.0573 | 0.0679 | 0.4923 | 9e-04 |
| 69 | 72 | 55.1567 | 32.5201 | 77.7932 | 0.0724 | 0.9053 | 0.5054 | 0.4028 |
| 70 | 70 | 69.8904 | 47.2532 | 92.5276 | 0.4962 | 0.4275 | 0.4962 | 0.8484 |
| 71 | 54 | 62.0767 | 39.4392 | 84.7142 | 0.2422 | 0.2464 | 0.5026 | 0.6379 |
| 72 | 65 | 57.9463 | 35.3087 | 80.584 | 0.2707 | 0.6337 | 0.4981 | 0.4981 |
| Univariate ARIMA Extrapolation Forecast Performance | |||||||||
| time | % S.E. | PE | MAPE | sMAPE | Sq.E | MSE | RMSE | ScaledE | MASE |
| 61 | 0.1837 | -0.5945 | 0.5945 | 0.4583 | 537.6305 | 0 | 0 | -1.8218 | 1.8218 |
| 62 | 0.2119 | -0.1031 | 0.3488 | 0.2782 | 25.5034 | 281.5669 | 16.78 | -0.3968 | 1.1093 |
| 63 | 0.1939 | -0.023 | 0.2402 | 0.193 | 1.775 | 188.303 | 13.7224 | -0.1047 | 0.7744 |
| 64 | 0.2349 | -0.0439 | 0.1911 | 0.1555 | 4.2659 | 142.2937 | 11.9287 | -0.1623 | 0.6214 |
| 65 | 0.2234 | -0.2299 | 0.1989 | 0.1656 | 93.1944 | 132.4738 | 11.5097 | -0.7585 | 0.6488 |
| 66 | 0.2197 | 0.1525 | 0.1912 | 0.1656 | 89.4425 | 125.3019 | 11.1938 | 0.7431 | 0.6645 |
| 67 | 0.3094 | 0.0431 | 0.17 | 0.1482 | 2.8223 | 107.8048 | 10.3829 | 0.132 | 0.5885 |
| 68 | 0.5303 | 0.4556 | 0.2057 | 0.2034 | 332.111 | 135.8431 | 11.6552 | 1.4319 | 0.6939 |
| 69 | 0.2094 | 0.2339 | 0.2088 | 0.2103 | 283.6979 | 152.2714 | 12.3398 | 1.3234 | 0.7638 |
| 70 | 0.1653 | 0.0016 | 0.1881 | 0.1894 | 0.012 | 137.0455 | 11.7066 | 0.0086 | 0.6883 |
| 71 | 0.1861 | -0.1496 | 0.1846 | 0.1848 | 65.233 | 130.5171 | 11.4244 | -0.6346 | 0.6834 |
| 72 | 0.1993 | 0.1085 | 0.1783 | 0.179 | 49.7541 | 123.7868 | 11.126 | 0.5542 | 0.6727 |