Free Statistics

of Irreproducible Research!

Author's title

Author*Unverified author*
R Software Modulerwasp_logisticregression.wasp
Title produced by softwareBias-Reduced Logistic Regression
Date of computationThu, 29 Aug 2013 05:12:00 -0400
Cite this page as followsStatistical Computations at FreeStatistics.org, Office for Research Development and Education, URL https://freestatistics.org/blog/index.php?v=date/2013/Aug/29/t1377768909lvt9h4b42fcjowt.htm/, Retrieved Mon, 29 Apr 2024 16:22:06 +0000
Statistical Computations at FreeStatistics.org, Office for Research Development and Education, URL https://freestatistics.org/blog/index.php?pk=211338, Retrieved Mon, 29 Apr 2024 16:22:06 +0000
QR Codes:

Original text written by user:
IsPrivate?No (this computation is public)
User-defined keywordsToxicity Assays
Estimated Impact194
Family? (F = Feedback message, R = changed R code, M = changed R Module, P = changed Parameters, D = changed Data)
-       [Bias-Reduced Logistic Regression] [] [2013-08-29 09:12:00] [d41d8cd98f00b204e9800998ecf8427e] [Current]
Feedback Forum

Post a new message
Dataseries X:
0	-11.15	11.67	2.14	1.31	-1.45	-1.45	-1.67	-1.67	-3.57	-1.67	-4.81	-5.54	6.50	3.40
0	3.61	13.67	2.14	-0.33	-1.45	-1.45	-2.04	-2.04	-2.14	-1.30	-5.19	-5.54	1.33	3.40
1	18.36	13.00	3.93	0.98	-1.64	-1.64	-2.04	-2.04	-2.14	0.00	0.00	-6.00	4.67	3.96
1	19.34	6.83	3.93	0.82	-1.45	-1.45	-1.85	-1.85	3.39	0.74	-1.11	-2.31	6.00	3.77
1	-8.81	2.76	0.73	-5.18	1.43	1.43	-4.75	-4.75	4.29	-2.04	3.73	1.31	-4.91	-2.83
1	-4.41	1.72	0.73	-5.89	5.00	5.00	1.36	1.36	5.18	-2.04	2.16	-0.16	-4.91	-2.83
0	-4.07	6.03	0.73	-7.50	3.21	3.21	-1.69	-1.69	6.07	-2.04	1.18	-0.98	-2.98	-2.83
1	0.68	7.41	11.45	-4.46	3.57	3.57	-2.71	-2.71	6.25	-0.56	2.94	4.59	-2.46	-5.83
1	11.86	4.41	5.93	0.00	6.17	6.17	-2.42	-2.42	1.61	-1.48	-0.52	0.57	9.50	2.30
1	11.69	6.61	2.41	0.00	6.17	6.17	-3.06	-3.06	0.18	-2.22	-0.52	0.75	5.17	0.16
1	13.05	5.76	6.67	-0.68	4.50	4.50	-4.03	-4.03	1.43	-2.22	-1.03	1.70	5.33	-1.48
1	13.39	4.24	7.78	4.24	8.50	8.50	-5.16	-5.16	1.07	-2.22	-2.76	1.70	5.33	-0.98
0	9.83	-1.43	4.07	-1.13	-6.10	-6.10	6.15	6.15	-1.61	1.70	-3.75	-22.26	-1.17	-4.26
0	7.12	2.14	7.29	-1.13	-3.05	-3.05	-0.96	-0.96	-3.21	-0.38	-3.75	-15.28	-1.17	-4.26
0	9.83	3.93	7.97	1.13	-5.08	-5.08	-6.35	-6.35	-3.21	-0.75	-1.96	-15.09	-1.17	-3.15
0	11.36	3.93	4.07	3.06	-2.37	-2.37	-4.42	-4.42	-2.32	-1.32	-4.11	-5.85	-1.17	-1.48
0	5.42	-11.19	2.20	-2.78	-1.75	-1.75	0.18	0.18	13.75	-10.20	0.57	-2.60	0.51	-5.65
1	5.76	-12.37	2.71	-2.04	-2.81	-2.81	0.09	0.09	14.29	-7.84	1.89	-4.00	0.17	-5.65
0	7.63	-12.37	0.51	-0.56	-1.40	-1.40	-0.42	-0.42	18.39	-7.84	2.45	0.20	2.20	-2.74
0	6.44	-10.68	-0.17	-5.00	-0.70	-0.70	0.09	0.09	16.96	-0.98	3.96	-4.00	3.05	-2.42
1	-6.95	2.78	4.81	1.30	4.63	4.63	-6.96	-6.96	15.89	-4.31	-1.13	2.50	-2.54	-8.27
0	-4.92	2.78	5.37	1.48	5.56	5.56	-5.29	-5.29	15.18	-4.31	-1.13	-3.14	-1.69	-7.88
1	2.71	0.56	5.00	2.22	5.56	5.56	-5.29	-5.29	9.64	-6.08	-0.94	-1.18	-2.88	-5.96
0	-0.17	-0.19	5.37	2.78	6.48	6.48	-3.33	-3.33	10.71	-3.92	-0.38	-0.20	-3.56	-5.96


Summary of computational transaction
Raw Inputview raw input (R code)
Raw Outputview raw output of R engine
Computing time2 seconds
R Server'Sir Maurice George Kendall' @ kendall.wessa.net

\begin{tabular}{lllllllll}
\hline
Summary of computational transaction \tabularnewline
Raw Input & view raw input (R code)  \tabularnewline
Raw Output & view raw output of R engine  \tabularnewline
Computing time & 2 seconds \tabularnewline
R Server & 'Sir Maurice George Kendall' @ kendall.wessa.net \tabularnewline
\hline
\end{tabular}
%Source: https://freestatistics.org/blog/index.php?pk=211338&T=0

[TABLE]
[ROW][C]Summary of computational transaction[/C][/ROW]
[ROW][C]Raw Input[/C][C]view raw input (R code) [/C][/ROW]
[ROW][C]Raw Output[/C][C]view raw output of R engine [/C][/ROW]
[ROW][C]Computing time[/C][C]2 seconds[/C][/ROW]
[ROW][C]R Server[/C][C]'Sir Maurice George Kendall' @ kendall.wessa.net[/C][/ROW]
[/TABLE]
Source: https://freestatistics.org/blog/index.php?pk=211338&T=0

Globally Unique Identifier (entire table): ba.freestatistics.org/blog/index.php?pk=211338&T=0

As an alternative you can also use a QR Code:  

The GUIDs for individual cells are displayed in the table below:

Summary of computational transaction
Raw Inputview raw input (R code)
Raw Outputview raw output of R engine
Computing time2 seconds
R Server'Sir Maurice George Kendall' @ kendall.wessa.net


Coefficients of Bias-Reduced Logistic Regression
VariableParameterS.E.t-stat2-sided p-value
(Intercept)1.75519578785612.772528527936030.6330668089329730.539628145234206
X10.0622621414111590.1029933895674840.6045256076397350.557757560987346
X20.1562896753826870.233069952253910.6705698176503790.5163265497267
X3-0.2944653454256920.487575575580417-0.6039378512247180.558134436598924
X40.2878921459425350.3924377581604720.733599507070910.478537016590769
X5-0.05296835897444950.24963985701588-0.2121790951477750.835847753403362
X70.1668990841631670.3198758550812810.5217620570979260.612180313024022
X9-0.2326085728070750.225243873853615-1.032696556081460.323917042896255
X10-0.000683325798034990.320931992400631-0.002129191898020470.998339275306805
X110.5857739122192450.5779302607068411.013571968878760.332562775476252
X120.1912144273589190.2366271066029450.8080833599498470.4361699756255
X130.2783537048530050.3535423699883230.7873277108545670.447722493385993
X14-0.6431646456494060.741959201391155-0.8668463770561630.404538617637183

\begin{tabular}{lllllllll}
\hline
Coefficients of Bias-Reduced Logistic Regression \tabularnewline
Variable & Parameter & S.E. & t-stat & 2-sided p-value \tabularnewline
(Intercept) & 1.7551957878561 & 2.77252852793603 & 0.633066808932973 & 0.539628145234206 \tabularnewline
X1 & 0.062262141411159 & 0.102993389567484 & 0.604525607639735 & 0.557757560987346 \tabularnewline
X2 & 0.156289675382687 & 0.23306995225391 & 0.670569817650379 & 0.5163265497267 \tabularnewline
X3 & -0.294465345425692 & 0.487575575580417 & -0.603937851224718 & 0.558134436598924 \tabularnewline
X4 & 0.287892145942535 & 0.392437758160472 & 0.73359950707091 & 0.478537016590769 \tabularnewline
X5 & -0.0529683589744495 & 0.24963985701588 & -0.212179095147775 & 0.835847753403362 \tabularnewline
X7 & 0.166899084163167 & 0.319875855081281 & 0.521762057097926 & 0.612180313024022 \tabularnewline
X9 & -0.232608572807075 & 0.225243873853615 & -1.03269655608146 & 0.323917042896255 \tabularnewline
X10 & -0.00068332579803499 & 0.320931992400631 & -0.00212919189802047 & 0.998339275306805 \tabularnewline
X11 & 0.585773912219245 & 0.577930260706841 & 1.01357196887876 & 0.332562775476252 \tabularnewline
X12 & 0.191214427358919 & 0.236627106602945 & 0.808083359949847 & 0.4361699756255 \tabularnewline
X13 & 0.278353704853005 & 0.353542369988323 & 0.787327710854567 & 0.447722493385993 \tabularnewline
X14 & -0.643164645649406 & 0.741959201391155 & -0.866846377056163 & 0.404538617637183 \tabularnewline
\hline
\end{tabular}
%Source: https://freestatistics.org/blog/index.php?pk=211338&T=1

[TABLE]
[ROW][C]Coefficients of Bias-Reduced Logistic Regression[/C][/ROW]
[ROW][C]Variable[/C][C]Parameter[/C][C]S.E.[/C][C]t-stat[/C][C]2-sided p-value[/C][/ROW]
[ROW][C](Intercept)[/C][C]1.7551957878561[/C][C]2.77252852793603[/C][C]0.633066808932973[/C][C]0.539628145234206[/C][/ROW]
[ROW][C]X1[/C][C]0.062262141411159[/C][C]0.102993389567484[/C][C]0.604525607639735[/C][C]0.557757560987346[/C][/ROW]
[ROW][C]X2[/C][C]0.156289675382687[/C][C]0.23306995225391[/C][C]0.670569817650379[/C][C]0.5163265497267[/C][/ROW]
[ROW][C]X3[/C][C]-0.294465345425692[/C][C]0.487575575580417[/C][C]-0.603937851224718[/C][C]0.558134436598924[/C][/ROW]
[ROW][C]X4[/C][C]0.287892145942535[/C][C]0.392437758160472[/C][C]0.73359950707091[/C][C]0.478537016590769[/C][/ROW]
[ROW][C]X5[/C][C]-0.0529683589744495[/C][C]0.24963985701588[/C][C]-0.212179095147775[/C][C]0.835847753403362[/C][/ROW]
[ROW][C]X7[/C][C]0.166899084163167[/C][C]0.319875855081281[/C][C]0.521762057097926[/C][C]0.612180313024022[/C][/ROW]
[ROW][C]X9[/C][C]-0.232608572807075[/C][C]0.225243873853615[/C][C]-1.03269655608146[/C][C]0.323917042896255[/C][/ROW]
[ROW][C]X10[/C][C]-0.00068332579803499[/C][C]0.320931992400631[/C][C]-0.00212919189802047[/C][C]0.998339275306805[/C][/ROW]
[ROW][C]X11[/C][C]0.585773912219245[/C][C]0.577930260706841[/C][C]1.01357196887876[/C][C]0.332562775476252[/C][/ROW]
[ROW][C]X12[/C][C]0.191214427358919[/C][C]0.236627106602945[/C][C]0.808083359949847[/C][C]0.4361699756255[/C][/ROW]
[ROW][C]X13[/C][C]0.278353704853005[/C][C]0.353542369988323[/C][C]0.787327710854567[/C][C]0.447722493385993[/C][/ROW]
[ROW][C]X14[/C][C]-0.643164645649406[/C][C]0.741959201391155[/C][C]-0.866846377056163[/C][C]0.404538617637183[/C][/ROW]
[/TABLE]
Source: https://freestatistics.org/blog/index.php?pk=211338&T=1

Globally Unique Identifier (entire table): ba.freestatistics.org/blog/index.php?pk=211338&T=1

As an alternative you can also use a QR Code:  

The GUIDs for individual cells are displayed in the table below:

Coefficients of Bias-Reduced Logistic Regression
VariableParameterS.E.t-stat2-sided p-value
(Intercept)1.75519578785612.772528527936030.6330668089329730.539628145234206
X10.0622621414111590.1029933895674840.6045256076397350.557757560987346
X20.1562896753826870.233069952253910.6705698176503790.5163265497267
X3-0.2944653454256920.487575575580417-0.6039378512247180.558134436598924
X40.2878921459425350.3924377581604720.733599507070910.478537016590769
X5-0.05296835897444950.24963985701588-0.2121790951477750.835847753403362
X70.1668990841631670.3198758550812810.5217620570979260.612180313024022
X9-0.2326085728070750.225243873853615-1.032696556081460.323917042896255
X10-0.000683325798034990.320931992400631-0.002129191898020470.998339275306805
X110.5857739122192450.5779302607068411.013571968878760.332562775476252
X120.1912144273589190.2366271066029450.8080833599498470.4361699756255
X130.2783537048530050.3535423699883230.7873277108545670.447722493385993
X14-0.6431646456494060.741959201391155-0.8668463770561630.404538617637183


Summary of Bias-Reduced Logistic Regression
Deviance18.3160512964583
Penalized deviance-23.4501265321443
Residual Degrees of Freedom11
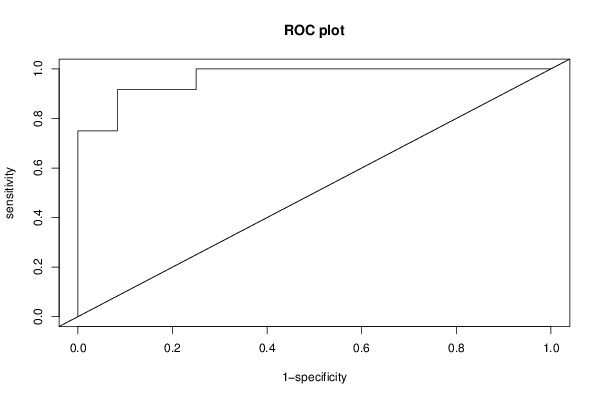
ROC Area0.965277777777778
Hosmer–Lemeshow test
Chi-square7.0179695668174
Degrees of Freedom8
P(>Chi)0.534695132295383

\begin{tabular}{lllllllll}
\hline
Summary of Bias-Reduced Logistic Regression \tabularnewline
Deviance & 18.3160512964583 \tabularnewline
Penalized deviance & -23.4501265321443 \tabularnewline
Residual Degrees of Freedom & 11 \tabularnewline
ROC Area & 0.965277777777778 \tabularnewline
Hosmer–Lemeshow test \tabularnewline
Chi-square & 7.0179695668174 \tabularnewline
Degrees of Freedom & 8 \tabularnewline
P(>Chi) & 0.534695132295383 \tabularnewline
\hline
\end{tabular}
%Source: https://freestatistics.org/blog/index.php?pk=211338&T=2

[TABLE]
[ROW][C]Summary of Bias-Reduced Logistic Regression[/C][/ROW]
[ROW][C]Deviance[/C][C]18.3160512964583[/C][/ROW]
[ROW][C]Penalized deviance[/C][C]-23.4501265321443[/C][/ROW]
[ROW][C]Residual Degrees of Freedom[/C][C]11[/C][/ROW]
[ROW][C]ROC Area[/C][C]0.965277777777778[/C][/ROW]
[ROW][C]Hosmer–Lemeshow test[/C][/ROW]
[ROW][C]Chi-square[/C][C]7.0179695668174[/C][/ROW]
[ROW][C]Degrees of Freedom[/C][C]8[/C][/ROW]
[ROW][C]P(>Chi)[/C][C]0.534695132295383[/C][/ROW]
[/TABLE]
Source: https://freestatistics.org/blog/index.php?pk=211338&T=2

Globally Unique Identifier (entire table): ba.freestatistics.org/blog/index.php?pk=211338&T=2

As an alternative you can also use a QR Code:  

The GUIDs for individual cells are displayed in the table below:

Summary of Bias-Reduced Logistic Regression
Deviance18.3160512964583
Penalized deviance-23.4501265321443
Residual Degrees of Freedom11
ROC Area0.965277777777778
Hosmer–Lemeshow test
Chi-square7.0179695668174
Degrees of Freedom8
P(>Chi)0.534695132295383


Fit of Logistic Regression
IndexActualFittedError
100.270345876489286-0.270345876489286
200.0919744656815909-0.0919744656815909
310.8704394143157770.129560585684223
410.5592444036546710.440755596345329
510.7222479036865690.277752096313431
610.5709021088770710.429097891122929
700.426027366293624-0.426027366293624
810.8664522812378570.133547718762143
910.7861638253062760.213836174693724
1010.9570395855563360.0429604144436638
1110.9023177502090150.0976822497909847
1210.8091855888261490.190814411173851
1300.154980953187815-0.154980953187815
1400.13068157324353-0.13068157324353
1500.195146250789963-0.195146250789963
1600.447113007460719-0.447113007460719
1700.363437322194751-0.363437322194751
1810.4167618863587570.583238113641243
1900.393013562028847-0.393013562028847
2000.30270705013301-0.30270705013301
2110.5107081679355610.489291832064439
2200.344812968907321-0.344812968907321
2310.5044979062520140.495502093747986
2400.531930108194096-0.531930108194096

\begin{tabular}{lllllllll}
\hline
Fit of Logistic Regression \tabularnewline
Index & Actual & Fitted & Error \tabularnewline
1 & 0 & 0.270345876489286 & -0.270345876489286 \tabularnewline
2 & 0 & 0.0919744656815909 & -0.0919744656815909 \tabularnewline
3 & 1 & 0.870439414315777 & 0.129560585684223 \tabularnewline
4 & 1 & 0.559244403654671 & 0.440755596345329 \tabularnewline
5 & 1 & 0.722247903686569 & 0.277752096313431 \tabularnewline
6 & 1 & 0.570902108877071 & 0.429097891122929 \tabularnewline
7 & 0 & 0.426027366293624 & -0.426027366293624 \tabularnewline
8 & 1 & 0.866452281237857 & 0.133547718762143 \tabularnewline
9 & 1 & 0.786163825306276 & 0.213836174693724 \tabularnewline
10 & 1 & 0.957039585556336 & 0.0429604144436638 \tabularnewline
11 & 1 & 0.902317750209015 & 0.0976822497909847 \tabularnewline
12 & 1 & 0.809185588826149 & 0.190814411173851 \tabularnewline
13 & 0 & 0.154980953187815 & -0.154980953187815 \tabularnewline
14 & 0 & 0.13068157324353 & -0.13068157324353 \tabularnewline
15 & 0 & 0.195146250789963 & -0.195146250789963 \tabularnewline
16 & 0 & 0.447113007460719 & -0.447113007460719 \tabularnewline
17 & 0 & 0.363437322194751 & -0.363437322194751 \tabularnewline
18 & 1 & 0.416761886358757 & 0.583238113641243 \tabularnewline
19 & 0 & 0.393013562028847 & -0.393013562028847 \tabularnewline
20 & 0 & 0.30270705013301 & -0.30270705013301 \tabularnewline
21 & 1 & 0.510708167935561 & 0.489291832064439 \tabularnewline
22 & 0 & 0.344812968907321 & -0.344812968907321 \tabularnewline
23 & 1 & 0.504497906252014 & 0.495502093747986 \tabularnewline
24 & 0 & 0.531930108194096 & -0.531930108194096 \tabularnewline
\hline
\end{tabular}
%Source: https://freestatistics.org/blog/index.php?pk=211338&T=3

[TABLE]
[ROW][C]Fit of Logistic Regression[/C][/ROW]
[ROW][C]Index[/C][C]Actual[/C][C]Fitted[/C][C]Error[/C][/ROW]
[ROW][C]1[/C][C]0[/C][C]0.270345876489286[/C][C]-0.270345876489286[/C][/ROW]
[ROW][C]2[/C][C]0[/C][C]0.0919744656815909[/C][C]-0.0919744656815909[/C][/ROW]
[ROW][C]3[/C][C]1[/C][C]0.870439414315777[/C][C]0.129560585684223[/C][/ROW]
[ROW][C]4[/C][C]1[/C][C]0.559244403654671[/C][C]0.440755596345329[/C][/ROW]
[ROW][C]5[/C][C]1[/C][C]0.722247903686569[/C][C]0.277752096313431[/C][/ROW]
[ROW][C]6[/C][C]1[/C][C]0.570902108877071[/C][C]0.429097891122929[/C][/ROW]
[ROW][C]7[/C][C]0[/C][C]0.426027366293624[/C][C]-0.426027366293624[/C][/ROW]
[ROW][C]8[/C][C]1[/C][C]0.866452281237857[/C][C]0.133547718762143[/C][/ROW]
[ROW][C]9[/C][C]1[/C][C]0.786163825306276[/C][C]0.213836174693724[/C][/ROW]
[ROW][C]10[/C][C]1[/C][C]0.957039585556336[/C][C]0.0429604144436638[/C][/ROW]
[ROW][C]11[/C][C]1[/C][C]0.902317750209015[/C][C]0.0976822497909847[/C][/ROW]
[ROW][C]12[/C][C]1[/C][C]0.809185588826149[/C][C]0.190814411173851[/C][/ROW]
[ROW][C]13[/C][C]0[/C][C]0.154980953187815[/C][C]-0.154980953187815[/C][/ROW]
[ROW][C]14[/C][C]0[/C][C]0.13068157324353[/C][C]-0.13068157324353[/C][/ROW]
[ROW][C]15[/C][C]0[/C][C]0.195146250789963[/C][C]-0.195146250789963[/C][/ROW]
[ROW][C]16[/C][C]0[/C][C]0.447113007460719[/C][C]-0.447113007460719[/C][/ROW]
[ROW][C]17[/C][C]0[/C][C]0.363437322194751[/C][C]-0.363437322194751[/C][/ROW]
[ROW][C]18[/C][C]1[/C][C]0.416761886358757[/C][C]0.583238113641243[/C][/ROW]
[ROW][C]19[/C][C]0[/C][C]0.393013562028847[/C][C]-0.393013562028847[/C][/ROW]
[ROW][C]20[/C][C]0[/C][C]0.30270705013301[/C][C]-0.30270705013301[/C][/ROW]
[ROW][C]21[/C][C]1[/C][C]0.510708167935561[/C][C]0.489291832064439[/C][/ROW]
[ROW][C]22[/C][C]0[/C][C]0.344812968907321[/C][C]-0.344812968907321[/C][/ROW]
[ROW][C]23[/C][C]1[/C][C]0.504497906252014[/C][C]0.495502093747986[/C][/ROW]
[ROW][C]24[/C][C]0[/C][C]0.531930108194096[/C][C]-0.531930108194096[/C][/ROW]
[/TABLE]
Source: https://freestatistics.org/blog/index.php?pk=211338&T=3

Globally Unique Identifier (entire table): ba.freestatistics.org/blog/index.php?pk=211338&T=3

As an alternative you can also use a QR Code:  

The GUIDs for individual cells are displayed in the table below:

Fit of Logistic Regression
IndexActualFittedError
100.270345876489286-0.270345876489286
200.0919744656815909-0.0919744656815909
310.8704394143157770.129560585684223
410.5592444036546710.440755596345329
510.7222479036865690.277752096313431
610.5709021088770710.429097891122929
700.426027366293624-0.426027366293624
810.8664522812378570.133547718762143
910.7861638253062760.213836174693724
1010.9570395855563360.0429604144436638
1110.9023177502090150.0976822497909847
1210.8091855888261490.190814411173851
1300.154980953187815-0.154980953187815
1400.13068157324353-0.13068157324353
1500.195146250789963-0.195146250789963
1600.447113007460719-0.447113007460719
1700.363437322194751-0.363437322194751
1810.4167618863587570.583238113641243
1900.393013562028847-0.393013562028847
2000.30270705013301-0.30270705013301
2110.5107081679355610.489291832064439
2200.344812968907321-0.344812968907321
2310.5044979062520140.495502093747986
2400.531930108194096-0.531930108194096


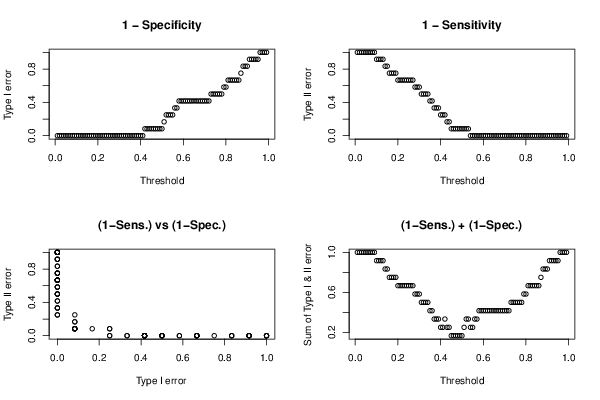
Type I & II errors for various threshold values
ThresholdType IType II
0.0101
0.0201
0.0301
0.0401
0.0501
0.0601
0.0701
0.0801
0.0901
0.100.916666666666667
0.1100.916666666666667
0.1200.916666666666667
0.1300.916666666666667
0.1400.833333333333333
0.1500.833333333333333
0.1600.75
0.1700.75
0.1800.75
0.1900.75
0.200.666666666666667
0.2100.666666666666667
0.2200.666666666666667
0.2300.666666666666667
0.2400.666666666666667
0.2500.666666666666667
0.2600.666666666666667
0.2700.666666666666667
0.2800.583333333333333
0.2900.583333333333333
0.300.583333333333333
0.3100.5
0.3200.5
0.3300.5
0.3400.5
0.3500.416666666666667
0.3600.416666666666667
0.3700.333333333333333
0.3800.333333333333333
0.3900.333333333333333
0.400.25
0.4100.25
0.420.08333333333333330.25
0.430.08333333333333330.166666666666667
0.440.08333333333333330.166666666666667
0.450.08333333333333330.0833333333333333
0.460.08333333333333330.0833333333333333
0.470.08333333333333330.0833333333333333
0.480.08333333333333330.0833333333333333
0.490.08333333333333330.0833333333333333
0.50.08333333333333330.0833333333333333
0.510.1666666666666670.0833333333333333
0.520.250.0833333333333333
0.530.250.0833333333333333
0.540.250
0.550.250
0.560.3333333333333330
0.570.3333333333333330
0.580.4166666666666670
0.590.4166666666666670
0.60.4166666666666670
0.610.4166666666666670
0.620.4166666666666670
0.630.4166666666666670
0.640.4166666666666670
0.650.4166666666666670
0.660.4166666666666670
0.670.4166666666666670
0.680.4166666666666670
0.690.4166666666666670
0.70.4166666666666670
0.710.4166666666666670
0.720.4166666666666670
0.730.50
0.740.50
0.750.50
0.760.50
0.770.50
0.780.50
0.790.5833333333333330
0.80.5833333333333330
0.810.6666666666666670
0.820.6666666666666670
0.830.6666666666666670
0.840.6666666666666670
0.850.6666666666666670
0.860.6666666666666670
0.870.750
0.880.8333333333333330
0.890.8333333333333330
0.90.8333333333333330
0.910.9166666666666670
0.920.9166666666666670
0.930.9166666666666670
0.940.9166666666666670
0.950.9166666666666670
0.9610
0.9710
0.9810
0.9910

\begin{tabular}{lllllllll}
\hline
Type I & II errors for various threshold values \tabularnewline
Threshold & Type I & Type II \tabularnewline
0.01 & 0 & 1 \tabularnewline
0.02 & 0 & 1 \tabularnewline
0.03 & 0 & 1 \tabularnewline
0.04 & 0 & 1 \tabularnewline
0.05 & 0 & 1 \tabularnewline
0.06 & 0 & 1 \tabularnewline
0.07 & 0 & 1 \tabularnewline
0.08 & 0 & 1 \tabularnewline
0.09 & 0 & 1 \tabularnewline
0.1 & 0 & 0.916666666666667 \tabularnewline
0.11 & 0 & 0.916666666666667 \tabularnewline
0.12 & 0 & 0.916666666666667 \tabularnewline
0.13 & 0 & 0.916666666666667 \tabularnewline
0.14 & 0 & 0.833333333333333 \tabularnewline
0.15 & 0 & 0.833333333333333 \tabularnewline
0.16 & 0 & 0.75 \tabularnewline
0.17 & 0 & 0.75 \tabularnewline
0.18 & 0 & 0.75 \tabularnewline
0.19 & 0 & 0.75 \tabularnewline
0.2 & 0 & 0.666666666666667 \tabularnewline
0.21 & 0 & 0.666666666666667 \tabularnewline
0.22 & 0 & 0.666666666666667 \tabularnewline
0.23 & 0 & 0.666666666666667 \tabularnewline
0.24 & 0 & 0.666666666666667 \tabularnewline
0.25 & 0 & 0.666666666666667 \tabularnewline
0.26 & 0 & 0.666666666666667 \tabularnewline
0.27 & 0 & 0.666666666666667 \tabularnewline
0.28 & 0 & 0.583333333333333 \tabularnewline
0.29 & 0 & 0.583333333333333 \tabularnewline
0.3 & 0 & 0.583333333333333 \tabularnewline
0.31 & 0 & 0.5 \tabularnewline
0.32 & 0 & 0.5 \tabularnewline
0.33 & 0 & 0.5 \tabularnewline
0.34 & 0 & 0.5 \tabularnewline
0.35 & 0 & 0.416666666666667 \tabularnewline
0.36 & 0 & 0.416666666666667 \tabularnewline
0.37 & 0 & 0.333333333333333 \tabularnewline
0.38 & 0 & 0.333333333333333 \tabularnewline
0.39 & 0 & 0.333333333333333 \tabularnewline
0.4 & 0 & 0.25 \tabularnewline
0.41 & 0 & 0.25 \tabularnewline
0.42 & 0.0833333333333333 & 0.25 \tabularnewline
0.43 & 0.0833333333333333 & 0.166666666666667 \tabularnewline
0.44 & 0.0833333333333333 & 0.166666666666667 \tabularnewline
0.45 & 0.0833333333333333 & 0.0833333333333333 \tabularnewline
0.46 & 0.0833333333333333 & 0.0833333333333333 \tabularnewline
0.47 & 0.0833333333333333 & 0.0833333333333333 \tabularnewline
0.48 & 0.0833333333333333 & 0.0833333333333333 \tabularnewline
0.49 & 0.0833333333333333 & 0.0833333333333333 \tabularnewline
0.5 & 0.0833333333333333 & 0.0833333333333333 \tabularnewline
0.51 & 0.166666666666667 & 0.0833333333333333 \tabularnewline
0.52 & 0.25 & 0.0833333333333333 \tabularnewline
0.53 & 0.25 & 0.0833333333333333 \tabularnewline
0.54 & 0.25 & 0 \tabularnewline
0.55 & 0.25 & 0 \tabularnewline
0.56 & 0.333333333333333 & 0 \tabularnewline
0.57 & 0.333333333333333 & 0 \tabularnewline
0.58 & 0.416666666666667 & 0 \tabularnewline
0.59 & 0.416666666666667 & 0 \tabularnewline
0.6 & 0.416666666666667 & 0 \tabularnewline
0.61 & 0.416666666666667 & 0 \tabularnewline
0.62 & 0.416666666666667 & 0 \tabularnewline
0.63 & 0.416666666666667 & 0 \tabularnewline
0.64 & 0.416666666666667 & 0 \tabularnewline
0.65 & 0.416666666666667 & 0 \tabularnewline
0.66 & 0.416666666666667 & 0 \tabularnewline
0.67 & 0.416666666666667 & 0 \tabularnewline
0.68 & 0.416666666666667 & 0 \tabularnewline
0.69 & 0.416666666666667 & 0 \tabularnewline
0.7 & 0.416666666666667 & 0 \tabularnewline
0.71 & 0.416666666666667 & 0 \tabularnewline
0.72 & 0.416666666666667 & 0 \tabularnewline
0.73 & 0.5 & 0 \tabularnewline
0.74 & 0.5 & 0 \tabularnewline
0.75 & 0.5 & 0 \tabularnewline
0.76 & 0.5 & 0 \tabularnewline
0.77 & 0.5 & 0 \tabularnewline
0.78 & 0.5 & 0 \tabularnewline
0.79 & 0.583333333333333 & 0 \tabularnewline
0.8 & 0.583333333333333 & 0 \tabularnewline
0.81 & 0.666666666666667 & 0 \tabularnewline
0.82 & 0.666666666666667 & 0 \tabularnewline
0.83 & 0.666666666666667 & 0 \tabularnewline
0.84 & 0.666666666666667 & 0 \tabularnewline
0.85 & 0.666666666666667 & 0 \tabularnewline
0.86 & 0.666666666666667 & 0 \tabularnewline
0.87 & 0.75 & 0 \tabularnewline
0.88 & 0.833333333333333 & 0 \tabularnewline
0.89 & 0.833333333333333 & 0 \tabularnewline
0.9 & 0.833333333333333 & 0 \tabularnewline
0.91 & 0.916666666666667 & 0 \tabularnewline
0.92 & 0.916666666666667 & 0 \tabularnewline
0.93 & 0.916666666666667 & 0 \tabularnewline
0.94 & 0.916666666666667 & 0 \tabularnewline
0.95 & 0.916666666666667 & 0 \tabularnewline
0.96 & 1 & 0 \tabularnewline
0.97 & 1 & 0 \tabularnewline
0.98 & 1 & 0 \tabularnewline
0.99 & 1 & 0 \tabularnewline
\hline
\end{tabular}
%Source: https://freestatistics.org/blog/index.php?pk=211338&T=4

[TABLE]
[ROW][C]Type I & II errors for various threshold values[/C][/ROW]
[ROW][C]Threshold[/C][C]Type I[/C][C]Type II[/C][/ROW]
[ROW][C]0.01[/C][C]0[/C][C]1[/C][/ROW]
[ROW][C]0.02[/C][C]0[/C][C]1[/C][/ROW]
[ROW][C]0.03[/C][C]0[/C][C]1[/C][/ROW]
[ROW][C]0.04[/C][C]0[/C][C]1[/C][/ROW]
[ROW][C]0.05[/C][C]0[/C][C]1[/C][/ROW]
[ROW][C]0.06[/C][C]0[/C][C]1[/C][/ROW]
[ROW][C]0.07[/C][C]0[/C][C]1[/C][/ROW]
[ROW][C]0.08[/C][C]0[/C][C]1[/C][/ROW]
[ROW][C]0.09[/C][C]0[/C][C]1[/C][/ROW]
[ROW][C]0.1[/C][C]0[/C][C]0.916666666666667[/C][/ROW]
[ROW][C]0.11[/C][C]0[/C][C]0.916666666666667[/C][/ROW]
[ROW][C]0.12[/C][C]0[/C][C]0.916666666666667[/C][/ROW]
[ROW][C]0.13[/C][C]0[/C][C]0.916666666666667[/C][/ROW]
[ROW][C]0.14[/C][C]0[/C][C]0.833333333333333[/C][/ROW]
[ROW][C]0.15[/C][C]0[/C][C]0.833333333333333[/C][/ROW]
[ROW][C]0.16[/C][C]0[/C][C]0.75[/C][/ROW]
[ROW][C]0.17[/C][C]0[/C][C]0.75[/C][/ROW]
[ROW][C]0.18[/C][C]0[/C][C]0.75[/C][/ROW]
[ROW][C]0.19[/C][C]0[/C][C]0.75[/C][/ROW]
[ROW][C]0.2[/C][C]0[/C][C]0.666666666666667[/C][/ROW]
[ROW][C]0.21[/C][C]0[/C][C]0.666666666666667[/C][/ROW]
[ROW][C]0.22[/C][C]0[/C][C]0.666666666666667[/C][/ROW]
[ROW][C]0.23[/C][C]0[/C][C]0.666666666666667[/C][/ROW]
[ROW][C]0.24[/C][C]0[/C][C]0.666666666666667[/C][/ROW]
[ROW][C]0.25[/C][C]0[/C][C]0.666666666666667[/C][/ROW]
[ROW][C]0.26[/C][C]0[/C][C]0.666666666666667[/C][/ROW]
[ROW][C]0.27[/C][C]0[/C][C]0.666666666666667[/C][/ROW]
[ROW][C]0.28[/C][C]0[/C][C]0.583333333333333[/C][/ROW]
[ROW][C]0.29[/C][C]0[/C][C]0.583333333333333[/C][/ROW]
[ROW][C]0.3[/C][C]0[/C][C]0.583333333333333[/C][/ROW]
[ROW][C]0.31[/C][C]0[/C][C]0.5[/C][/ROW]
[ROW][C]0.32[/C][C]0[/C][C]0.5[/C][/ROW]
[ROW][C]0.33[/C][C]0[/C][C]0.5[/C][/ROW]
[ROW][C]0.34[/C][C]0[/C][C]0.5[/C][/ROW]
[ROW][C]0.35[/C][C]0[/C][C]0.416666666666667[/C][/ROW]
[ROW][C]0.36[/C][C]0[/C][C]0.416666666666667[/C][/ROW]
[ROW][C]0.37[/C][C]0[/C][C]0.333333333333333[/C][/ROW]
[ROW][C]0.38[/C][C]0[/C][C]0.333333333333333[/C][/ROW]
[ROW][C]0.39[/C][C]0[/C][C]0.333333333333333[/C][/ROW]
[ROW][C]0.4[/C][C]0[/C][C]0.25[/C][/ROW]
[ROW][C]0.41[/C][C]0[/C][C]0.25[/C][/ROW]
[ROW][C]0.42[/C][C]0.0833333333333333[/C][C]0.25[/C][/ROW]
[ROW][C]0.43[/C][C]0.0833333333333333[/C][C]0.166666666666667[/C][/ROW]
[ROW][C]0.44[/C][C]0.0833333333333333[/C][C]0.166666666666667[/C][/ROW]
[ROW][C]0.45[/C][C]0.0833333333333333[/C][C]0.0833333333333333[/C][/ROW]
[ROW][C]0.46[/C][C]0.0833333333333333[/C][C]0.0833333333333333[/C][/ROW]
[ROW][C]0.47[/C][C]0.0833333333333333[/C][C]0.0833333333333333[/C][/ROW]
[ROW][C]0.48[/C][C]0.0833333333333333[/C][C]0.0833333333333333[/C][/ROW]
[ROW][C]0.49[/C][C]0.0833333333333333[/C][C]0.0833333333333333[/C][/ROW]
[ROW][C]0.5[/C][C]0.0833333333333333[/C][C]0.0833333333333333[/C][/ROW]
[ROW][C]0.51[/C][C]0.166666666666667[/C][C]0.0833333333333333[/C][/ROW]
[ROW][C]0.52[/C][C]0.25[/C][C]0.0833333333333333[/C][/ROW]
[ROW][C]0.53[/C][C]0.25[/C][C]0.0833333333333333[/C][/ROW]
[ROW][C]0.54[/C][C]0.25[/C][C]0[/C][/ROW]
[ROW][C]0.55[/C][C]0.25[/C][C]0[/C][/ROW]
[ROW][C]0.56[/C][C]0.333333333333333[/C][C]0[/C][/ROW]
[ROW][C]0.57[/C][C]0.333333333333333[/C][C]0[/C][/ROW]
[ROW][C]0.58[/C][C]0.416666666666667[/C][C]0[/C][/ROW]
[ROW][C]0.59[/C][C]0.416666666666667[/C][C]0[/C][/ROW]
[ROW][C]0.6[/C][C]0.416666666666667[/C][C]0[/C][/ROW]
[ROW][C]0.61[/C][C]0.416666666666667[/C][C]0[/C][/ROW]
[ROW][C]0.62[/C][C]0.416666666666667[/C][C]0[/C][/ROW]
[ROW][C]0.63[/C][C]0.416666666666667[/C][C]0[/C][/ROW]
[ROW][C]0.64[/C][C]0.416666666666667[/C][C]0[/C][/ROW]
[ROW][C]0.65[/C][C]0.416666666666667[/C][C]0[/C][/ROW]
[ROW][C]0.66[/C][C]0.416666666666667[/C][C]0[/C][/ROW]
[ROW][C]0.67[/C][C]0.416666666666667[/C][C]0[/C][/ROW]
[ROW][C]0.68[/C][C]0.416666666666667[/C][C]0[/C][/ROW]
[ROW][C]0.69[/C][C]0.416666666666667[/C][C]0[/C][/ROW]
[ROW][C]0.7[/C][C]0.416666666666667[/C][C]0[/C][/ROW]
[ROW][C]0.71[/C][C]0.416666666666667[/C][C]0[/C][/ROW]
[ROW][C]0.72[/C][C]0.416666666666667[/C][C]0[/C][/ROW]
[ROW][C]0.73[/C][C]0.5[/C][C]0[/C][/ROW]
[ROW][C]0.74[/C][C]0.5[/C][C]0[/C][/ROW]
[ROW][C]0.75[/C][C]0.5[/C][C]0[/C][/ROW]
[ROW][C]0.76[/C][C]0.5[/C][C]0[/C][/ROW]
[ROW][C]0.77[/C][C]0.5[/C][C]0[/C][/ROW]
[ROW][C]0.78[/C][C]0.5[/C][C]0[/C][/ROW]
[ROW][C]0.79[/C][C]0.583333333333333[/C][C]0[/C][/ROW]
[ROW][C]0.8[/C][C]0.583333333333333[/C][C]0[/C][/ROW]
[ROW][C]0.81[/C][C]0.666666666666667[/C][C]0[/C][/ROW]
[ROW][C]0.82[/C][C]0.666666666666667[/C][C]0[/C][/ROW]
[ROW][C]0.83[/C][C]0.666666666666667[/C][C]0[/C][/ROW]
[ROW][C]0.84[/C][C]0.666666666666667[/C][C]0[/C][/ROW]
[ROW][C]0.85[/C][C]0.666666666666667[/C][C]0[/C][/ROW]
[ROW][C]0.86[/C][C]0.666666666666667[/C][C]0[/C][/ROW]
[ROW][C]0.87[/C][C]0.75[/C][C]0[/C][/ROW]
[ROW][C]0.88[/C][C]0.833333333333333[/C][C]0[/C][/ROW]
[ROW][C]0.89[/C][C]0.833333333333333[/C][C]0[/C][/ROW]
[ROW][C]0.9[/C][C]0.833333333333333[/C][C]0[/C][/ROW]
[ROW][C]0.91[/C][C]0.916666666666667[/C][C]0[/C][/ROW]
[ROW][C]0.92[/C][C]0.916666666666667[/C][C]0[/C][/ROW]
[ROW][C]0.93[/C][C]0.916666666666667[/C][C]0[/C][/ROW]
[ROW][C]0.94[/C][C]0.916666666666667[/C][C]0[/C][/ROW]
[ROW][C]0.95[/C][C]0.916666666666667[/C][C]0[/C][/ROW]
[ROW][C]0.96[/C][C]1[/C][C]0[/C][/ROW]
[ROW][C]0.97[/C][C]1[/C][C]0[/C][/ROW]
[ROW][C]0.98[/C][C]1[/C][C]0[/C][/ROW]
[ROW][C]0.99[/C][C]1[/C][C]0[/C][/ROW]
[/TABLE]
Source: https://freestatistics.org/blog/index.php?pk=211338&T=4

Globally Unique Identifier (entire table): ba.freestatistics.org/blog/index.php?pk=211338&T=4

As an alternative you can also use a QR Code:  

The GUIDs for individual cells are displayed in the table below:

Type I & II errors for various threshold values
ThresholdType IType II
0.0101
0.0201
0.0301
0.0401
0.0501
0.0601
0.0701
0.0801
0.0901
0.100.916666666666667
0.1100.916666666666667
0.1200.916666666666667
0.1300.916666666666667
0.1400.833333333333333
0.1500.833333333333333
0.1600.75
0.1700.75
0.1800.75
0.1900.75
0.200.666666666666667
0.2100.666666666666667
0.2200.666666666666667
0.2300.666666666666667
0.2400.666666666666667
0.2500.666666666666667
0.2600.666666666666667
0.2700.666666666666667
0.2800.583333333333333
0.2900.583333333333333
0.300.583333333333333
0.3100.5
0.3200.5
0.3300.5
0.3400.5
0.3500.416666666666667
0.3600.416666666666667
0.3700.333333333333333
0.3800.333333333333333
0.3900.333333333333333
0.400.25
0.4100.25
0.420.08333333333333330.25
0.430.08333333333333330.166666666666667
0.440.08333333333333330.166666666666667
0.450.08333333333333330.0833333333333333
0.460.08333333333333330.0833333333333333
0.470.08333333333333330.0833333333333333
0.480.08333333333333330.0833333333333333
0.490.08333333333333330.0833333333333333
0.50.08333333333333330.0833333333333333
0.510.1666666666666670.0833333333333333
0.520.250.0833333333333333
0.530.250.0833333333333333
0.540.250
0.550.250
0.560.3333333333333330
0.570.3333333333333330
0.580.4166666666666670
0.590.4166666666666670
0.60.4166666666666670
0.610.4166666666666670
0.620.4166666666666670
0.630.4166666666666670
0.640.4166666666666670
0.650.4166666666666670
0.660.4166666666666670
0.670.4166666666666670
0.680.4166666666666670
0.690.4166666666666670
0.70.4166666666666670
0.710.4166666666666670
0.720.4166666666666670
0.730.50
0.740.50
0.750.50
0.760.50
0.770.50
0.780.50
0.790.5833333333333330
0.80.5833333333333330
0.810.6666666666666670
0.820.6666666666666670
0.830.6666666666666670
0.840.6666666666666670
0.850.6666666666666670
0.860.6666666666666670
0.870.750
0.880.8333333333333330
0.890.8333333333333330
0.90.8333333333333330
0.910.9166666666666670
0.920.9166666666666670
0.930.9166666666666670
0.940.9166666666666670
0.950.9166666666666670
0.9610
0.9710
0.9810
0.9910


Parameters (Session):
Parameters (R input):
R code (references can be found in the software module):
library(brglm)
roc.plot <- function (sd, sdc, newplot = TRUE, ...)
{
sall <- sort(c(sd, sdc))
sens <- 0
specc <- 0
for (i in length(sall):1) {
sens <- c(sens, mean(sd >= sall[i], na.rm = T))
specc <- c(specc, mean(sdc >= sall[i], na.rm = T))
}
if (newplot) {
plot(specc, sens, xlim = c(0, 1), ylim = c(0, 1), type = 'l',
xlab = '1-specificity', ylab = 'sensitivity', main = 'ROC plot', ...)
abline(0, 1)
}
else lines(specc, sens, ...)
npoints <- length(sens)
area <- sum(0.5 * (sens[-1] + sens[-npoints]) * (specc[-1] -
specc[-npoints]))
lift <- (sens - specc)[-1]
cutoff <- sall[lift == max(lift)][1]
sensopt <- sens[-1][lift == max(lift)][1]
specopt <- 1 - specc[-1][lift == max(lift)][1]
list(area = area, cutoff = cutoff, sensopt = sensopt, specopt = specopt)
}
roc.analysis <- function (object, newdata = NULL, newplot = TRUE, ...)
{
if (is.null(newdata)) {
sd <- object$fitted[object$y == 1]
sdc <- object$fitted[object$y == 0]
}
else {
sd <- predict(object, newdata, type = 'response')[newdata$y ==
1]
sdc <- predict(object, newdata, type = 'response')[newdata$y ==
0]
}
roc.plot(sd, sdc, newplot, ...)
}
hosmerlem <- function (y, yhat, g = 10)
{
cutyhat <- cut(yhat, breaks = quantile(yhat, probs = seq(0,
1, 1/g)), include.lowest = T)
obs <- xtabs(cbind(1 - y, y) ~ cutyhat)
expect <- xtabs(cbind(1 - yhat, yhat) ~ cutyhat)
chisq <- sum((obs - expect)^2/expect)
P <- 1 - pchisq(chisq, g - 2)
c('X^2' = chisq, Df = g - 2, 'P(>Chi)' = P)
}
x <- as.data.frame(t(y))
r <- brglm(x)
summary(r)
rc <- summary(r)$coeff
try(hm <- hosmerlem(y[1,],r$fitted.values),silent=T)
try(hm,silent=T)
bitmap(file='test0.png')
ra <- roc.analysis(r)
dev.off()
te <- array(0,dim=c(2,99))
for (i in 1:99) {
threshold <- i / 100
numcorr1 <- 0
numfaul1 <- 0
numcorr0 <- 0
numfaul0 <- 0
for (j in 1:length(r$fitted.values)) {
if (y[1,j] > 0.99) {
if (r$fitted.values[j] >= threshold) numcorr1 = numcorr1 + 1 else numfaul1 = numfaul1 + 1
} else {
if (r$fitted.values[j] < threshold) numcorr0 = numcorr0 + 1 else numfaul0 = numfaul0 + 1
}
}
te[1,i] <- numfaul1 / (numfaul1 + numcorr1)
te[2,i] <- numfaul0 / (numfaul0 + numcorr0)
}
bitmap(file='test1.png')
op <- par(mfrow=c(2,2))
plot((1:99)/100,te[1,],xlab='Threshold',ylab='Type I error', main='1 - Specificity')
plot((1:99)/100,te[2,],xlab='Threshold',ylab='Type II error', main='1 - Sensitivity')
plot(te[1,],te[2,],xlab='Type I error',ylab='Type II error', main='(1-Sens.) vs (1-Spec.)')
plot((1:99)/100,te[1,]+te[2,],xlab='Threshold',ylab='Sum of Type I & II error', main='(1-Sens.) + (1-Spec.)')
par(op)
dev.off()
load(file='createtable')
a<-table.start()
a<-table.row.start(a)
a<-table.element(a,'Coefficients of Bias-Reduced Logistic Regression',5,TRUE)
a<-table.row.end(a)
a<-table.row.start(a)
a<-table.element(a,'Variable',header=TRUE)
a<-table.element(a,'Parameter',header=TRUE)
a<-table.element(a,'S.E.',header=TRUE)
a<-table.element(a,'t-stat',header=TRUE)
a<-table.element(a,'2-sided p-value',header=TRUE)
a<-table.row.end(a)
for (i in 1:length(rc[,1])) {
a<-table.row.start(a)
a<-table.element(a,labels(rc)[[1]][i],header=TRUE)
a<-table.element(a,rc[i,1])
a<-table.element(a,rc[i,2])
a<-table.element(a,rc[i,3])
a<-table.element(a,2*(1-pt(abs(rc[i,3]),r$df.residual)))
a<-table.row.end(a)
}
a<-table.end(a)
table.save(a,file='mytable.tab')
a<-table.start()
a<-table.row.start(a)
a<-table.element(a,'Summary of Bias-Reduced Logistic Regression',2,TRUE)
a<-table.row.end(a)
a<-table.row.start(a)
a<-table.element(a,'Deviance',1,TRUE)
a<-table.element(a,r$deviance)
a<-table.row.end(a)
a<-table.row.start(a)
a<-table.element(a,'Penalized deviance',1,TRUE)
a<-table.element(a,r$penalized.deviance)
a<-table.row.end(a)
a<-table.row.start(a)
a<-table.element(a,'Residual Degrees of Freedom',1,TRUE)
a<-table.element(a,r$df.residual)
a<-table.row.end(a)
a<-table.row.start(a)
a<-table.element(a,'ROC Area',1,TRUE)
a<-table.element(a,ra$area)
a<-table.row.end(a)
a<-table.row.start(a)
a<-table.element(a,'Hosmer–Lemeshow test',2,TRUE)
a<-table.row.end(a)
a<-table.row.start(a)
a<-table.element(a,'Chi-square',1,TRUE)
phm <- array('NA',dim=3)
for (i in 1:3) { try(phm[i] <- hm[i],silent=T) }
a<-table.element(a,phm[1])
a<-table.row.end(a)
a<-table.row.start(a)
a<-table.element(a,'Degrees of Freedom',1,TRUE)
a<-table.element(a,phm[2])
a<-table.row.end(a)
a<-table.row.start(a)
a<-table.element(a,'P(>Chi)',1,TRUE)
a<-table.element(a,phm[3])
a<-table.row.end(a)
a<-table.end(a)
table.save(a,file='mytable1.tab')
a<-table.start()
a<-table.row.start(a)
a<-table.element(a,'Fit of Logistic Regression',4,TRUE)
a<-table.row.end(a)
a<-table.row.start(a)
a<-table.element(a,'Index',1,TRUE)
a<-table.element(a,'Actual',1,TRUE)
a<-table.element(a,'Fitted',1,TRUE)
a<-table.element(a,'Error',1,TRUE)
a<-table.row.end(a)
for (i in 1:length(r$fitted.values)) {
a<-table.row.start(a)
a<-table.element(a,i,1,TRUE)
a<-table.element(a,y[1,i])
a<-table.element(a,r$fitted.values[i])
a<-table.element(a,y[1,i]-r$fitted.values[i])
a<-table.row.end(a)
}
a<-table.end(a)
table.save(a,file='mytable2.tab')
a<-table.start()
a<-table.row.start(a)
a<-table.element(a,'Type I & II errors for various threshold values',3,TRUE)
a<-table.row.end(a)
a<-table.row.start(a)
a<-table.element(a,'Threshold',1,TRUE)
a<-table.element(a,'Type I',1,TRUE)
a<-table.element(a,'Type II',1,TRUE)
a<-table.row.end(a)
for (i in 1:99) {
a<-table.row.start(a)
a<-table.element(a,i/100,1,TRUE)
a<-table.element(a,te[1,i])
a<-table.element(a,te[2,i])
a<-table.row.end(a)
}
a<-table.end(a)
table.save(a,file='mytable3.tab')