Free Statistics

of Irreproducible Research!

Author's title

Author*Unverified author*
R Software Modulerwasp_smp.wasp
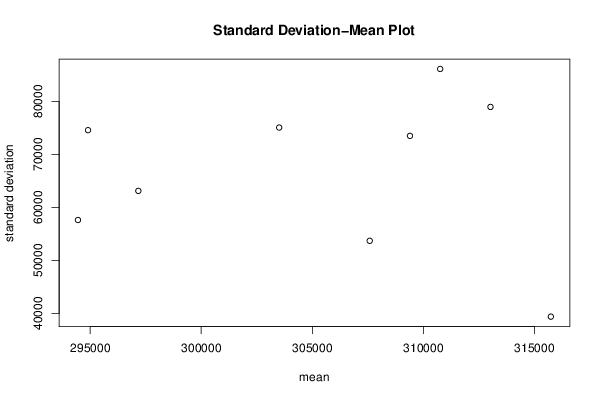
Title produced by softwareStandard Deviation-Mean Plot
Date of computationWed, 21 Aug 2013 05:38:50 -0400
Cite this page as followsStatistical Computations at FreeStatistics.org, Office for Research Development and Education, URL https://freestatistics.org/blog/index.php?v=date/2013/Aug/21/t1377078026a428mdxrl0vm0ij.htm/, Retrieved Sat, 27 Apr 2024 10:48:54 +0000
Statistical Computations at FreeStatistics.org, Office for Research Development and Education, URL https://freestatistics.org/blog/index.php?pk=211321, Retrieved Sat, 27 Apr 2024 10:48:54 +0000
QR Codes:

Original text written by user:
IsPrivate?No (this computation is public)
User-defined keywords
Estimated Impact119
Family? (F = Feedback message, R = changed R code, M = changed R Module, P = changed Parameters, D = changed Data)
-       [Standard Deviation-Mean Plot] [] [2013-08-21 09:38:50] [bdb7c0ed7ba273e65f9ee772c5dda4f0] [Current]
Feedback Forum

Post a new message
Dataseries X:
293544
282672
298980
239184
309852
304416
326160
337032
375084
326160
309852
385956
326160
244620
288108
217440
304416
250056
331596
298980
315288
353340
347904
413136
298980
250056
277236
201132
288108
222876
315288
298980
266364
380520
342468
391392
293544
271800
244620
201132
266364
239184
326160
315288
271800
364212
337032
434880
347904
212004
212004
212004
250056
250056
337032
309852
277236
347904
320724
462060
364212
212004
222876
184824
255492
293544
369648
364212
293544
342468
304416
434880
331596
266364
239184
179388
266364
320724
375084
353340
260928
375084
293544
451188
375084
271800
250056
168516
266364
255492
385956
385956
293544
380520
282672
440316
375084
277236
212004
146772
288108
277236
364212
418572
309852
347904
260928
451188


Summary of computational transaction
Raw Inputview raw input (R code)
Raw Outputview raw output of R engine
Computing time2 seconds
R Server'Gertrude Mary Cox' @ cox.wessa.net

\begin{tabular}{lllllllll}
\hline
Summary of computational transaction \tabularnewline
Raw Input & view raw input (R code)  \tabularnewline
Raw Output & view raw output of R engine  \tabularnewline
Computing time & 2 seconds \tabularnewline
R Server & 'Gertrude Mary Cox' @ cox.wessa.net \tabularnewline
\hline
\end{tabular}
%Source: https://freestatistics.org/blog/index.php?pk=211321&T=0

[TABLE]
[ROW][C]Summary of computational transaction[/C][/ROW]
[ROW][C]Raw Input[/C][C]view raw input (R code) [/C][/ROW]
[ROW][C]Raw Output[/C][C]view raw output of R engine [/C][/ROW]
[ROW][C]Computing time[/C][C]2 seconds[/C][/ROW]
[ROW][C]R Server[/C][C]'Gertrude Mary Cox' @ cox.wessa.net[/C][/ROW]
[/TABLE]
Source: https://freestatistics.org/blog/index.php?pk=211321&T=0

Globally Unique Identifier (entire table): ba.freestatistics.org/blog/index.php?pk=211321&T=0

As an alternative you can also use a QR Code:  

The GUIDs for individual cells are displayed in the table below:

Summary of computational transaction
Raw Inputview raw input (R code)
Raw Outputview raw output of R engine
Computing time2 seconds
R Server'Gertrude Mary Cox' @ cox.wessa.net


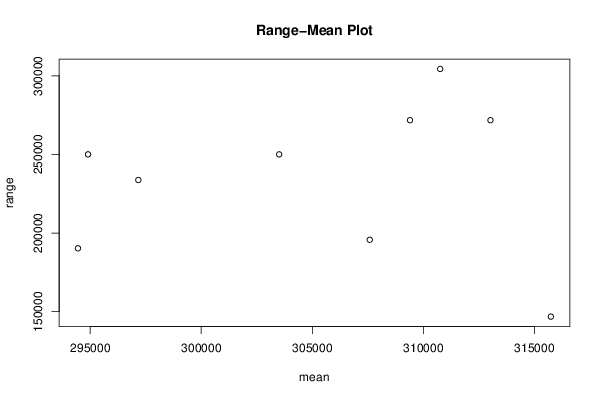
Standard Deviation-Mean Plot
SectionMeanStandard DeviationRange
131574139367.6642621142146772
230758753686.6247944326195696
329445057614.7618583988190260
429716863110.9717705106233748
529490374575.2129451749250056
630351075067.3947959735250056
730939973498.7820233036271800
831302378961.0435065062271800
931075886132.8335242089304416

\begin{tabular}{lllllllll}
\hline
Standard Deviation-Mean Plot \tabularnewline
Section & Mean & Standard Deviation & Range \tabularnewline
1 & 315741 & 39367.6642621142 & 146772 \tabularnewline
2 & 307587 & 53686.6247944326 & 195696 \tabularnewline
3 & 294450 & 57614.7618583988 & 190260 \tabularnewline
4 & 297168 & 63110.9717705106 & 233748 \tabularnewline
5 & 294903 & 74575.2129451749 & 250056 \tabularnewline
6 & 303510 & 75067.3947959735 & 250056 \tabularnewline
7 & 309399 & 73498.7820233036 & 271800 \tabularnewline
8 & 313023 & 78961.0435065062 & 271800 \tabularnewline
9 & 310758 & 86132.8335242089 & 304416 \tabularnewline
\hline
\end{tabular}
%Source: https://freestatistics.org/blog/index.php?pk=211321&T=1

[TABLE]
[ROW][C]Standard Deviation-Mean Plot[/C][/ROW]
[ROW][C]Section[/C][C]Mean[/C][C]Standard Deviation[/C][C]Range[/C][/ROW]
[ROW][C]1[/C][C]315741[/C][C]39367.6642621142[/C][C]146772[/C][/ROW]
[ROW][C]2[/C][C]307587[/C][C]53686.6247944326[/C][C]195696[/C][/ROW]
[ROW][C]3[/C][C]294450[/C][C]57614.7618583988[/C][C]190260[/C][/ROW]
[ROW][C]4[/C][C]297168[/C][C]63110.9717705106[/C][C]233748[/C][/ROW]
[ROW][C]5[/C][C]294903[/C][C]74575.2129451749[/C][C]250056[/C][/ROW]
[ROW][C]6[/C][C]303510[/C][C]75067.3947959735[/C][C]250056[/C][/ROW]
[ROW][C]7[/C][C]309399[/C][C]73498.7820233036[/C][C]271800[/C][/ROW]
[ROW][C]8[/C][C]313023[/C][C]78961.0435065062[/C][C]271800[/C][/ROW]
[ROW][C]9[/C][C]310758[/C][C]86132.8335242089[/C][C]304416[/C][/ROW]
[/TABLE]
Source: https://freestatistics.org/blog/index.php?pk=211321&T=1

Globally Unique Identifier (entire table): ba.freestatistics.org/blog/index.php?pk=211321&T=1

As an alternative you can also use a QR Code:  

The GUIDs for individual cells are displayed in the table below:

Standard Deviation-Mean Plot
SectionMeanStandard DeviationRange
131574139367.6642621142146772
230758753686.6247944326195696
329445057614.7618583988190260
429716863110.9717705106233748
529490374575.2129451749250056
630351075067.3947959735250056
730939973498.7820233036271800
831302378961.0435065062271800
931075886132.8335242089304416


Regression: S.E.(k) = alpha + beta * Mean(k)
alpha99680.6980855447
beta-0.107448317059863
S.D.0.68875700161761
T-STAT-0.156003230177712
p-value0.880434120508983

\begin{tabular}{lllllllll}
\hline
Regression: S.E.(k) = alpha + beta * Mean(k) \tabularnewline
alpha & 99680.6980855447 \tabularnewline
beta & -0.107448317059863 \tabularnewline
S.D. & 0.68875700161761 \tabularnewline
T-STAT & -0.156003230177712 \tabularnewline
p-value & 0.880434120508983 \tabularnewline
\hline
\end{tabular}
%Source: https://freestatistics.org/blog/index.php?pk=211321&T=2

[TABLE]
[ROW][C]Regression: S.E.(k) = alpha + beta * Mean(k)[/C][/ROW]
[ROW][C]alpha[/C][C]99680.6980855447[/C][/ROW]
[ROW][C]beta[/C][C]-0.107448317059863[/C][/ROW]
[ROW][C]S.D.[/C][C]0.68875700161761[/C][/ROW]
[ROW][C]T-STAT[/C][C]-0.156003230177712[/C][/ROW]
[ROW][C]p-value[/C][C]0.880434120508983[/C][/ROW]
[/TABLE]
Source: https://freestatistics.org/blog/index.php?pk=211321&T=2

Globally Unique Identifier (entire table): ba.freestatistics.org/blog/index.php?pk=211321&T=2

As an alternative you can also use a QR Code:  

The GUIDs for individual cells are displayed in the table below:

Regression: S.E.(k) = alpha + beta * Mean(k)
alpha99680.6980855447
beta-0.107448317059863
S.D.0.68875700161761
T-STAT-0.156003230177712
p-value0.880434120508983


Regression: ln S.E.(k) = alpha + beta * ln Mean(k)
alpha27.4568588718378
beta-1.29633550728096
S.D.3.4558277278628
T-STAT-0.3751157781475
p-value0.718681736243665
Lambda2.29633550728096

\begin{tabular}{lllllllll}
\hline
Regression: ln S.E.(k) = alpha + beta * ln Mean(k) \tabularnewline
alpha & 27.4568588718378 \tabularnewline
beta & -1.29633550728096 \tabularnewline
S.D. & 3.4558277278628 \tabularnewline
T-STAT & -0.3751157781475 \tabularnewline
p-value & 0.718681736243665 \tabularnewline
Lambda & 2.29633550728096 \tabularnewline
\hline
\end{tabular}
%Source: https://freestatistics.org/blog/index.php?pk=211321&T=3

[TABLE]
[ROW][C]Regression: ln S.E.(k) = alpha + beta * ln Mean(k)[/C][/ROW]
[ROW][C]alpha[/C][C]27.4568588718378[/C][/ROW]
[ROW][C]beta[/C][C]-1.29633550728096[/C][/ROW]
[ROW][C]S.D.[/C][C]3.4558277278628[/C][/ROW]
[ROW][C]T-STAT[/C][C]-0.3751157781475[/C][/ROW]
[ROW][C]p-value[/C][C]0.718681736243665[/C][/ROW]
[ROW][C]Lambda[/C][C]2.29633550728096[/C][/ROW]
[/TABLE]
Source: https://freestatistics.org/blog/index.php?pk=211321&T=3

Globally Unique Identifier (entire table): ba.freestatistics.org/blog/index.php?pk=211321&T=3

As an alternative you can also use a QR Code:  

The GUIDs for individual cells are displayed in the table below:

Regression: ln S.E.(k) = alpha + beta * ln Mean(k)
alpha27.4568588718378
beta-1.29633550728096
S.D.3.4558277278628
T-STAT-0.3751157781475
p-value0.718681736243665
Lambda2.29633550728096


Parameters (Session):
par1 = 48 ; par2 = 1 ; par3 = 1 ; par4 = 0 ; par5 = 12 ; par6 = White Noise ; par7 = 0.95 ;
Parameters (R input):
par1 = 12 ;
R code (references can be found in the software module):
par1 <- as.numeric(par1)
(n <- length(x))
(np <- floor(n / par1))
arr <- array(NA,dim=c(par1,np))
j <- 0
k <- 1
for (i in 1:(np*par1))
{
j = j + 1
arr[j,k] <- x[i]
if (j == par1) {
j = 0
k=k+1
}
}
arr
arr.mean <- array(NA,dim=np)
arr.sd <- array(NA,dim=np)
arr.range <- array(NA,dim=np)
for (j in 1:np)
{
arr.mean[j] <- mean(arr[,j],na.rm=TRUE)
arr.sd[j] <- sd(arr[,j],na.rm=TRUE)
arr.range[j] <- max(arr[,j],na.rm=TRUE) - min(arr[,j],na.rm=TRUE)
}
arr.mean
arr.sd
arr.range
(lm1 <- lm(arr.sd~arr.mean))
(lnlm1 <- lm(log(arr.sd)~log(arr.mean)))
(lm2 <- lm(arr.range~arr.mean))
bitmap(file='test1.png')
plot(arr.mean,arr.sd,main='Standard Deviation-Mean Plot',xlab='mean',ylab='standard deviation')
dev.off()
bitmap(file='test2.png')
plot(arr.mean,arr.range,main='Range-Mean Plot',xlab='mean',ylab='range')
dev.off()
load(file='createtable')
a<-table.start()
a<-table.row.start(a)
a<-table.element(a,'Standard Deviation-Mean Plot',4,TRUE)
a<-table.row.end(a)
a<-table.row.start(a)
a<-table.element(a,'Section',header=TRUE)
a<-table.element(a,'Mean',header=TRUE)
a<-table.element(a,'Standard Deviation',header=TRUE)
a<-table.element(a,'Range',header=TRUE)
a<-table.row.end(a)
for (j in 1:np) {
a<-table.row.start(a)
a<-table.element(a,j,header=TRUE)
a<-table.element(a,arr.mean[j])
a<-table.element(a,arr.sd[j] )
a<-table.element(a,arr.range[j] )
a<-table.row.end(a)
}
a<-table.end(a)
table.save(a,file='mytable.tab')
a<-table.start()
a<-table.row.start(a)
a<-table.element(a,'Regression: S.E.(k) = alpha + beta * Mean(k)',2,TRUE)
a<-table.row.end(a)
a<-table.row.start(a)
a<-table.element(a,'alpha',header=TRUE)
a<-table.element(a,lm1$coefficients[[1]])
a<-table.row.end(a)
a<-table.row.start(a)
a<-table.element(a,'beta',header=TRUE)
a<-table.element(a,lm1$coefficients[[2]])
a<-table.row.end(a)
a<-table.row.start(a)
a<-table.element(a,'S.D.',header=TRUE)
a<-table.element(a,summary(lm1)$coefficients[2,2])
a<-table.row.end(a)
a<-table.row.start(a)
a<-table.element(a,'T-STAT',header=TRUE)
a<-table.element(a,summary(lm1)$coefficients[2,3])
a<-table.row.end(a)
a<-table.row.start(a)
a<-table.element(a,'p-value',header=TRUE)
a<-table.element(a,summary(lm1)$coefficients[2,4])
a<-table.row.end(a)
a<-table.end(a)
table.save(a,file='mytable1.tab')
a<-table.start()
a<-table.row.start(a)
a<-table.element(a,'Regression: ln S.E.(k) = alpha + beta * ln Mean(k)',2,TRUE)
a<-table.row.end(a)
a<-table.row.start(a)
a<-table.element(a,'alpha',header=TRUE)
a<-table.element(a,lnlm1$coefficients[[1]])
a<-table.row.end(a)
a<-table.row.start(a)
a<-table.element(a,'beta',header=TRUE)
a<-table.element(a,lnlm1$coefficients[[2]])
a<-table.row.end(a)
a<-table.row.start(a)
a<-table.element(a,'S.D.',header=TRUE)
a<-table.element(a,summary(lnlm1)$coefficients[2,2])
a<-table.row.end(a)
a<-table.row.start(a)
a<-table.element(a,'T-STAT',header=TRUE)
a<-table.element(a,summary(lnlm1)$coefficients[2,3])
a<-table.row.end(a)
a<-table.row.start(a)
a<-table.element(a,'p-value',header=TRUE)
a<-table.element(a,summary(lnlm1)$coefficients[2,4])
a<-table.row.end(a)
a<-table.row.start(a)
a<-table.element(a,'Lambda',header=TRUE)
a<-table.element(a,1-lnlm1$coefficients[[2]])
a<-table.row.end(a)
a<-table.end(a)
table.save(a,file='mytable2.tab')