Free Statistics

of Irreproducible Research!

Author's title

Author*Unverified author*
R Software Modulerwasp_smp.wasp
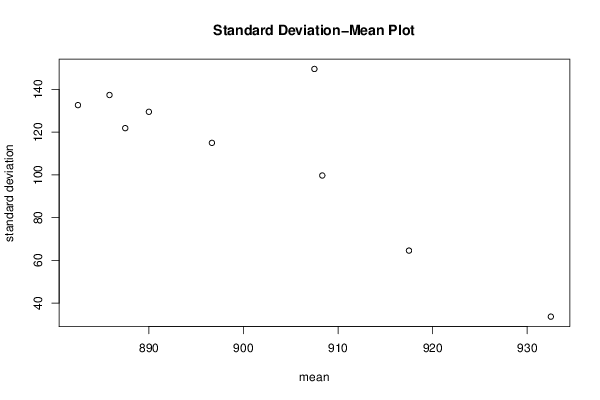
Title produced by softwareStandard Deviation-Mean Plot
Date of computationWed, 21 Aug 2013 04:56:07 -0400
Cite this page as followsStatistical Computations at FreeStatistics.org, Office for Research Development and Education, URL https://freestatistics.org/blog/index.php?v=date/2013/Aug/21/t13770756745z790d3gyg9f5l2.htm/, Retrieved Sat, 27 Apr 2024 08:00:40 +0000
Statistical Computations at FreeStatistics.org, Office for Research Development and Education, URL https://freestatistics.org/blog/index.php?pk=211308, Retrieved Sat, 27 Apr 2024 08:00:40 +0000
QR Codes:

Original text written by user:
IsPrivate?No (this computation is public)
User-defined keywordsRaedts Mathias
Estimated Impact108
Family? (F = Feedback message, R = changed R code, M = changed R Module, P = changed Parameters, D = changed Data)
-       [Standard Deviation-Mean Plot] [Tijdreeks B - Sta...] [2013-08-21 08:56:07] [e2e43c39163d7563005e2a800525cced] [Current]
Feedback Forum

Post a new message
Dataseries X:
910
910
970
950
980
860
920
950
900
950
950
940
860
810
870
960
970
860
850
910
970
980
970
1000
910
740
810
1050
920
830
880
910
880
960
900
1110
870
720
780
970
1020
830
820
920
840
920
920
1150
820
760
760
960
1010
790
820
880
820
870
870
1230
760
810
850
990
940
850
860
860
780
880
850
1220
850
800
840
1090
810
870
810
860
800
870
860
1220
820
860
750
1020
780
830
860
850
820
790
1020
1230
760
880
760
1090
840
900
930
820
780
870
990
1270


Summary of computational transaction
Raw Inputview raw input (R code)
Raw Outputview raw output of R engine
Computing time2 seconds
R Server'Gwilym Jenkins' @ jenkins.wessa.net

\begin{tabular}{lllllllll}
\hline
Summary of computational transaction \tabularnewline
Raw Input & view raw input (R code)  \tabularnewline
Raw Output & view raw output of R engine  \tabularnewline
Computing time & 2 seconds \tabularnewline
R Server & 'Gwilym Jenkins' @ jenkins.wessa.net \tabularnewline
\hline
\end{tabular}
%Source: https://freestatistics.org/blog/index.php?pk=211308&T=0

[TABLE]
[ROW][C]Summary of computational transaction[/C][/ROW]
[ROW][C]Raw Input[/C][C]view raw input (R code) [/C][/ROW]
[ROW][C]Raw Output[/C][C]view raw output of R engine [/C][/ROW]
[ROW][C]Computing time[/C][C]2 seconds[/C][/ROW]
[ROW][C]R Server[/C][C]'Gwilym Jenkins' @ jenkins.wessa.net[/C][/ROW]
[/TABLE]
Source: https://freestatistics.org/blog/index.php?pk=211308&T=0

Globally Unique Identifier (entire table): ba.freestatistics.org/blog/index.php?pk=211308&T=0

As an alternative you can also use a QR Code:  

The GUIDs for individual cells are displayed in the table below:

Summary of computational transaction
Raw Inputview raw input (R code)
Raw Outputview raw output of R engine
Computing time2 seconds
R Server'Gwilym Jenkins' @ jenkins.wessa.net


Standard Deviation-Mean Plot
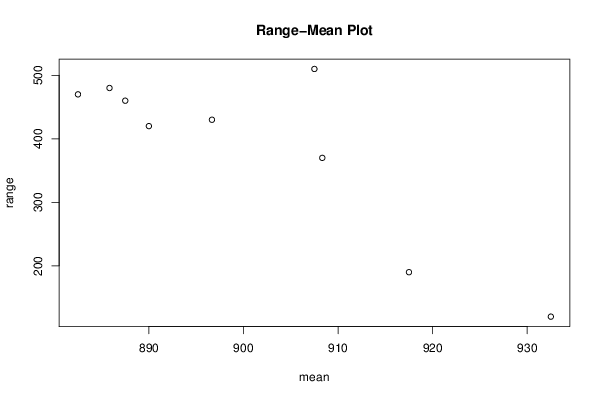
SectionMeanStandard DeviationRange
1932.533.6087109920249120
2917.564.5438540134465190
3908.33333333333399.7117056439425370
4896.666666666667114.996706145187430
5882.5132.673557000906470
6887.5121.888548198008460
7890129.544657094834420
8885.833333333333137.408371673856480
9907.5149.613137488293510

\begin{tabular}{lllllllll}
\hline
Standard Deviation-Mean Plot \tabularnewline
Section & Mean & Standard Deviation & Range \tabularnewline
1 & 932.5 & 33.6087109920249 & 120 \tabularnewline
2 & 917.5 & 64.5438540134465 & 190 \tabularnewline
3 & 908.333333333333 & 99.7117056439425 & 370 \tabularnewline
4 & 896.666666666667 & 114.996706145187 & 430 \tabularnewline
5 & 882.5 & 132.673557000906 & 470 \tabularnewline
6 & 887.5 & 121.888548198008 & 460 \tabularnewline
7 & 890 & 129.544657094834 & 420 \tabularnewline
8 & 885.833333333333 & 137.408371673856 & 480 \tabularnewline
9 & 907.5 & 149.613137488293 & 510 \tabularnewline
\hline
\end{tabular}
%Source: https://freestatistics.org/blog/index.php?pk=211308&T=1

[TABLE]
[ROW][C]Standard Deviation-Mean Plot[/C][/ROW]
[ROW][C]Section[/C][C]Mean[/C][C]Standard Deviation[/C][C]Range[/C][/ROW]
[ROW][C]1[/C][C]932.5[/C][C]33.6087109920249[/C][C]120[/C][/ROW]
[ROW][C]2[/C][C]917.5[/C][C]64.5438540134465[/C][C]190[/C][/ROW]
[ROW][C]3[/C][C]908.333333333333[/C][C]99.7117056439425[/C][C]370[/C][/ROW]
[ROW][C]4[/C][C]896.666666666667[/C][C]114.996706145187[/C][C]430[/C][/ROW]
[ROW][C]5[/C][C]882.5[/C][C]132.673557000906[/C][C]470[/C][/ROW]
[ROW][C]6[/C][C]887.5[/C][C]121.888548198008[/C][C]460[/C][/ROW]
[ROW][C]7[/C][C]890[/C][C]129.544657094834[/C][C]420[/C][/ROW]
[ROW][C]8[/C][C]885.833333333333[/C][C]137.408371673856[/C][C]480[/C][/ROW]
[ROW][C]9[/C][C]907.5[/C][C]149.613137488293[/C][C]510[/C][/ROW]
[/TABLE]
Source: https://freestatistics.org/blog/index.php?pk=211308&T=1

Globally Unique Identifier (entire table): ba.freestatistics.org/blog/index.php?pk=211308&T=1

As an alternative you can also use a QR Code:  

The GUIDs for individual cells are displayed in the table below:

Standard Deviation-Mean Plot
SectionMeanStandard DeviationRange
1932.533.6087109920249120
2917.564.5438540134465190
3908.33333333333399.7117056439425370
4896.666666666667114.996706145187430
5882.5132.673557000906470
6887.5121.888548198008460
7890129.544657094834420
8885.833333333333137.408371673856480
9907.5149.613137488293510


Regression: S.E.(k) = alpha + beta * Mean(k)
alpha1790.31046567037
beta-1.86583411421782
S.D.0.47337800275328
T-STAT-3.94153108797974
p-value0.00559235731747911

\begin{tabular}{lllllllll}
\hline
Regression: S.E.(k) = alpha + beta * Mean(k) \tabularnewline
alpha & 1790.31046567037 \tabularnewline
beta & -1.86583411421782 \tabularnewline
S.D. & 0.47337800275328 \tabularnewline
T-STAT & -3.94153108797974 \tabularnewline
p-value & 0.00559235731747911 \tabularnewline
\hline
\end{tabular}
%Source: https://freestatistics.org/blog/index.php?pk=211308&T=2

[TABLE]
[ROW][C]Regression: S.E.(k) = alpha + beta * Mean(k)[/C][/ROW]
[ROW][C]alpha[/C][C]1790.31046567037[/C][/ROW]
[ROW][C]beta[/C][C]-1.86583411421782[/C][/ROW]
[ROW][C]S.D.[/C][C]0.47337800275328[/C][/ROW]
[ROW][C]T-STAT[/C][C]-3.94153108797974[/C][/ROW]
[ROW][C]p-value[/C][C]0.00559235731747911[/C][/ROW]
[/TABLE]
Source: https://freestatistics.org/blog/index.php?pk=211308&T=2

Globally Unique Identifier (entire table): ba.freestatistics.org/blog/index.php?pk=211308&T=2

As an alternative you can also use a QR Code:  

The GUIDs for individual cells are displayed in the table below:

Regression: S.E.(k) = alpha + beta * Mean(k)
alpha1790.31046567037
beta-1.86583411421782
S.D.0.47337800275328
T-STAT-3.94153108797974
p-value0.00559235731747911


Regression: ln S.E.(k) = alpha + beta * ln Mean(k)
alpha154.725272411434
beta-22.0647511103723
S.D.5.15589428451188
T-STAT-4.27951969004756
p-value0.00365754072303344
Lambda23.0647511103723

\begin{tabular}{lllllllll}
\hline
Regression: ln S.E.(k) = alpha + beta * ln Mean(k) \tabularnewline
alpha & 154.725272411434 \tabularnewline
beta & -22.0647511103723 \tabularnewline
S.D. & 5.15589428451188 \tabularnewline
T-STAT & -4.27951969004756 \tabularnewline
p-value & 0.00365754072303344 \tabularnewline
Lambda & 23.0647511103723 \tabularnewline
\hline
\end{tabular}
%Source: https://freestatistics.org/blog/index.php?pk=211308&T=3

[TABLE]
[ROW][C]Regression: ln S.E.(k) = alpha + beta * ln Mean(k)[/C][/ROW]
[ROW][C]alpha[/C][C]154.725272411434[/C][/ROW]
[ROW][C]beta[/C][C]-22.0647511103723[/C][/ROW]
[ROW][C]S.D.[/C][C]5.15589428451188[/C][/ROW]
[ROW][C]T-STAT[/C][C]-4.27951969004756[/C][/ROW]
[ROW][C]p-value[/C][C]0.00365754072303344[/C][/ROW]
[ROW][C]Lambda[/C][C]23.0647511103723[/C][/ROW]
[/TABLE]
Source: https://freestatistics.org/blog/index.php?pk=211308&T=3

Globally Unique Identifier (entire table): ba.freestatistics.org/blog/index.php?pk=211308&T=3

As an alternative you can also use a QR Code:  

The GUIDs for individual cells are displayed in the table below:

Regression: ln S.E.(k) = alpha + beta * ln Mean(k)
alpha154.725272411434
beta-22.0647511103723
S.D.5.15589428451188
T-STAT-4.27951969004756
p-value0.00365754072303344
Lambda23.0647511103723


Parameters (Session):
par1 = 22 ; par2 = grey ; par3 = FALSE ; par4 = Unknown ;
Parameters (R input):
par1 = 12 ;
R code (references can be found in the software module):
par1 <- as.numeric(par1)
(n <- length(x))
(np <- floor(n / par1))
arr <- array(NA,dim=c(par1,np))
j <- 0
k <- 1
for (i in 1:(np*par1))
{
j = j + 1
arr[j,k] <- x[i]
if (j == par1) {
j = 0
k=k+1
}
}
arr
arr.mean <- array(NA,dim=np)
arr.sd <- array(NA,dim=np)
arr.range <- array(NA,dim=np)
for (j in 1:np)
{
arr.mean[j] <- mean(arr[,j],na.rm=TRUE)
arr.sd[j] <- sd(arr[,j],na.rm=TRUE)
arr.range[j] <- max(arr[,j],na.rm=TRUE) - min(arr[,j],na.rm=TRUE)
}
arr.mean
arr.sd
arr.range
(lm1 <- lm(arr.sd~arr.mean))
(lnlm1 <- lm(log(arr.sd)~log(arr.mean)))
(lm2 <- lm(arr.range~arr.mean))
bitmap(file='test1.png')
plot(arr.mean,arr.sd,main='Standard Deviation-Mean Plot',xlab='mean',ylab='standard deviation')
dev.off()
bitmap(file='test2.png')
plot(arr.mean,arr.range,main='Range-Mean Plot',xlab='mean',ylab='range')
dev.off()
load(file='createtable')
a<-table.start()
a<-table.row.start(a)
a<-table.element(a,'Standard Deviation-Mean Plot',4,TRUE)
a<-table.row.end(a)
a<-table.row.start(a)
a<-table.element(a,'Section',header=TRUE)
a<-table.element(a,'Mean',header=TRUE)
a<-table.element(a,'Standard Deviation',header=TRUE)
a<-table.element(a,'Range',header=TRUE)
a<-table.row.end(a)
for (j in 1:np) {
a<-table.row.start(a)
a<-table.element(a,j,header=TRUE)
a<-table.element(a,arr.mean[j])
a<-table.element(a,arr.sd[j] )
a<-table.element(a,arr.range[j] )
a<-table.row.end(a)
}
a<-table.end(a)
table.save(a,file='mytable.tab')
a<-table.start()
a<-table.row.start(a)
a<-table.element(a,'Regression: S.E.(k) = alpha + beta * Mean(k)',2,TRUE)
a<-table.row.end(a)
a<-table.row.start(a)
a<-table.element(a,'alpha',header=TRUE)
a<-table.element(a,lm1$coefficients[[1]])
a<-table.row.end(a)
a<-table.row.start(a)
a<-table.element(a,'beta',header=TRUE)
a<-table.element(a,lm1$coefficients[[2]])
a<-table.row.end(a)
a<-table.row.start(a)
a<-table.element(a,'S.D.',header=TRUE)
a<-table.element(a,summary(lm1)$coefficients[2,2])
a<-table.row.end(a)
a<-table.row.start(a)
a<-table.element(a,'T-STAT',header=TRUE)
a<-table.element(a,summary(lm1)$coefficients[2,3])
a<-table.row.end(a)
a<-table.row.start(a)
a<-table.element(a,'p-value',header=TRUE)
a<-table.element(a,summary(lm1)$coefficients[2,4])
a<-table.row.end(a)
a<-table.end(a)
table.save(a,file='mytable1.tab')
a<-table.start()
a<-table.row.start(a)
a<-table.element(a,'Regression: ln S.E.(k) = alpha + beta * ln Mean(k)',2,TRUE)
a<-table.row.end(a)
a<-table.row.start(a)
a<-table.element(a,'alpha',header=TRUE)
a<-table.element(a,lnlm1$coefficients[[1]])
a<-table.row.end(a)
a<-table.row.start(a)
a<-table.element(a,'beta',header=TRUE)
a<-table.element(a,lnlm1$coefficients[[2]])
a<-table.row.end(a)
a<-table.row.start(a)
a<-table.element(a,'S.D.',header=TRUE)
a<-table.element(a,summary(lnlm1)$coefficients[2,2])
a<-table.row.end(a)
a<-table.row.start(a)
a<-table.element(a,'T-STAT',header=TRUE)
a<-table.element(a,summary(lnlm1)$coefficients[2,3])
a<-table.row.end(a)
a<-table.row.start(a)
a<-table.element(a,'p-value',header=TRUE)
a<-table.element(a,summary(lnlm1)$coefficients[2,4])
a<-table.row.end(a)
a<-table.row.start(a)
a<-table.element(a,'Lambda',header=TRUE)
a<-table.element(a,1-lnlm1$coefficients[[2]])
a<-table.row.end(a)
a<-table.end(a)
table.save(a,file='mytable2.tab')