Free Statistics

of Irreproducible Research!

Author's title

Author*Unverified author*
R Software Modulerwasp_smp.wasp
Title produced by softwareStandard Deviation-Mean Plot
Date of computationWed, 21 Aug 2013 03:34:46 -0400
Cite this page as followsStatistical Computations at FreeStatistics.org, Office for Research Development and Education, URL https://freestatistics.org/blog/index.php?v=date/2013/Aug/21/t1377070592zz9ahk4yjszavuy.htm/, Retrieved Sat, 27 Apr 2024 06:50:37 +0000
Statistical Computations at FreeStatistics.org, Office for Research Development and Education, URL https://freestatistics.org/blog/index.php?pk=211298, Retrieved Sat, 27 Apr 2024 06:50:37 +0000
QR Codes:

Original text written by user:
IsPrivate?No (this computation is public)
User-defined keywordsJoris Claus
Estimated Impact120
Family? (F = Feedback message, R = changed R code, M = changed R Module, P = changed Parameters, D = changed Data)
-       [Standard Deviation-Mean Plot] [Tijdreeks A - Sta...] [2013-08-21 07:34:46] [5b48cba8ffed7710e2defc0d8d22bd89] [Current]
Feedback Forum

Post a new message
Dataseries X:
865911
858030
850038
833499
997113
988455
865911
784437
792318
792318
801087
816849
865911
850038
874569
914862
1144188
1144188
1095237
1046175
1086468
1135530
1144188
1168719
1242312
1193250
1193250
1266843
1470861
1487400
1446330
1348206
1421799
1421799
1429680
1470861
1503273
1519812
1519812
1568874
1757130
1806081
1813962
1691418
1757130
1732599
1683537
1789542
1813962
1772892
1781550
1838493
2051280
2157174
2157174
2108223
2181705
2108223
2067042
2222886
2247306
2189586
2336661
2394381
2565987
2679873
2664111
2655342
2721054
2713062
2615049
2762124
2811186
2762124
2966142
3064266
3292704
3382836
3358416
3309354
3350424
3399486
3235761
3366297
3448548
3415359
3628035
3701517
4012317
4069260
3995778
4036848
4061379
4085910
3930066
4077141
4158615
4077141
4314459
4387941
4706622
4755684
4771446
4853697
4853697
4886109
4739034
4812627
4861578
4771446
5033184
5082246
5408808
5466528
5548002
5621595
5629476
5638134
5491059
5638134


Summary of computational transaction
Raw Inputview raw input (R code)
Raw Outputview raw output of R engine
Computing time1 seconds
R Server'Gwilym Jenkins' @ jenkins.wessa.net

\begin{tabular}{lllllllll}
\hline
Summary of computational transaction \tabularnewline
Raw Input & view raw input (R code)  \tabularnewline
Raw Output & view raw output of R engine  \tabularnewline
Computing time & 1 seconds \tabularnewline
R Server & 'Gwilym Jenkins' @ jenkins.wessa.net \tabularnewline
\hline
\end{tabular}
%Source: https://freestatistics.org/blog/index.php?pk=211298&T=0

[TABLE]
[ROW][C]Summary of computational transaction[/C][/ROW]
[ROW][C]Raw Input[/C][C]view raw input (R code) [/C][/ROW]
[ROW][C]Raw Output[/C][C]view raw output of R engine [/C][/ROW]
[ROW][C]Computing time[/C][C]1 seconds[/C][/ROW]
[ROW][C]R Server[/C][C]'Gwilym Jenkins' @ jenkins.wessa.net[/C][/ROW]
[/TABLE]
Source: https://freestatistics.org/blog/index.php?pk=211298&T=0

Globally Unique Identifier (entire table): ba.freestatistics.org/blog/index.php?pk=211298&T=0

As an alternative you can also use a QR Code:  

The GUIDs for individual cells are displayed in the table below:

Summary of computational transaction
Raw Inputview raw input (R code)
Raw Outputview raw output of R engine
Computing time1 seconds
R Server'Gwilym Jenkins' @ jenkins.wessa.net


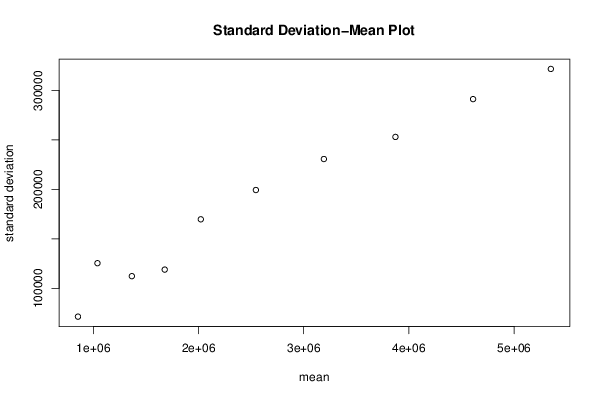
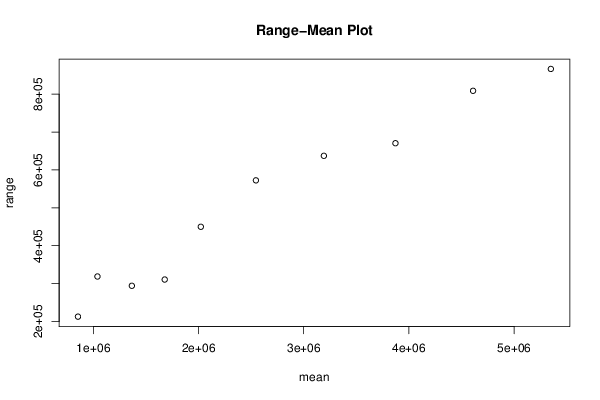
Standard Deviation-Mean Plot
SectionMeanStandard DeviationRange
1853830.571301.8154843454212676
21039172.75125379.342857894318681
31366049.25112248.620589317294150
41678597.5118906.954640631310689
52021717169755.029322738449994
62545378199388.575542605572538
73191583230731.523718093637362
83871846.5253087.893357768670551
94609756291342.60670152808968
105349182.5321839.883304924866688

\begin{tabular}{lllllllll}
\hline
Standard Deviation-Mean Plot \tabularnewline
Section & Mean & Standard Deviation & Range \tabularnewline
1 & 853830.5 & 71301.8154843454 & 212676 \tabularnewline
2 & 1039172.75 & 125379.342857894 & 318681 \tabularnewline
3 & 1366049.25 & 112248.620589317 & 294150 \tabularnewline
4 & 1678597.5 & 118906.954640631 & 310689 \tabularnewline
5 & 2021717 & 169755.029322738 & 449994 \tabularnewline
6 & 2545378 & 199388.575542605 & 572538 \tabularnewline
7 & 3191583 & 230731.523718093 & 637362 \tabularnewline
8 & 3871846.5 & 253087.893357768 & 670551 \tabularnewline
9 & 4609756 & 291342.60670152 & 808968 \tabularnewline
10 & 5349182.5 & 321839.883304924 & 866688 \tabularnewline
\hline
\end{tabular}
%Source: https://freestatistics.org/blog/index.php?pk=211298&T=1

[TABLE]
[ROW][C]Standard Deviation-Mean Plot[/C][/ROW]
[ROW][C]Section[/C][C]Mean[/C][C]Standard Deviation[/C][C]Range[/C][/ROW]
[ROW][C]1[/C][C]853830.5[/C][C]71301.8154843454[/C][C]212676[/C][/ROW]
[ROW][C]2[/C][C]1039172.75[/C][C]125379.342857894[/C][C]318681[/C][/ROW]
[ROW][C]3[/C][C]1366049.25[/C][C]112248.620589317[/C][C]294150[/C][/ROW]
[ROW][C]4[/C][C]1678597.5[/C][C]118906.954640631[/C][C]310689[/C][/ROW]
[ROW][C]5[/C][C]2021717[/C][C]169755.029322738[/C][C]449994[/C][/ROW]
[ROW][C]6[/C][C]2545378[/C][C]199388.575542605[/C][C]572538[/C][/ROW]
[ROW][C]7[/C][C]3191583[/C][C]230731.523718093[/C][C]637362[/C][/ROW]
[ROW][C]8[/C][C]3871846.5[/C][C]253087.893357768[/C][C]670551[/C][/ROW]
[ROW][C]9[/C][C]4609756[/C][C]291342.60670152[/C][C]808968[/C][/ROW]
[ROW][C]10[/C][C]5349182.5[/C][C]321839.883304924[/C][C]866688[/C][/ROW]
[/TABLE]
Source: https://freestatistics.org/blog/index.php?pk=211298&T=1

Globally Unique Identifier (entire table): ba.freestatistics.org/blog/index.php?pk=211298&T=1

As an alternative you can also use a QR Code:  

The GUIDs for individual cells are displayed in the table below:

Standard Deviation-Mean Plot
SectionMeanStandard DeviationRange
1853830.571301.8154843454212676
21039172.75125379.342857894318681
31366049.25112248.620589317294150
41678597.5118906.954640631310689
52021717169755.029322738449994
62545378199388.575542605572538
73191583230731.523718093637362
83871846.5253087.893357768670551
94609756291342.60670152808968
105349182.5321839.883304924866688


Regression: S.E.(k) = alpha + beta * Mean(k)
alpha48829.7450145218
beta0.0529904929863501
S.D.0.0034995679875414
T-STAT15.1420098637884
p-value3.58189365240398e-07

\begin{tabular}{lllllllll}
\hline
Regression: S.E.(k) = alpha + beta * Mean(k) \tabularnewline
alpha & 48829.7450145218 \tabularnewline
beta & 0.0529904929863501 \tabularnewline
S.D. & 0.0034995679875414 \tabularnewline
T-STAT & 15.1420098637884 \tabularnewline
p-value & 3.58189365240398e-07 \tabularnewline
\hline
\end{tabular}
%Source: https://freestatistics.org/blog/index.php?pk=211298&T=2

[TABLE]
[ROW][C]Regression: S.E.(k) = alpha + beta * Mean(k)[/C][/ROW]
[ROW][C]alpha[/C][C]48829.7450145218[/C][/ROW]
[ROW][C]beta[/C][C]0.0529904929863501[/C][/ROW]
[ROW][C]S.D.[/C][C]0.0034995679875414[/C][/ROW]
[ROW][C]T-STAT[/C][C]15.1420098637884[/C][/ROW]
[ROW][C]p-value[/C][C]3.58189365240398e-07[/C][/ROW]
[/TABLE]
Source: https://freestatistics.org/blog/index.php?pk=211298&T=2

Globally Unique Identifier (entire table): ba.freestatistics.org/blog/index.php?pk=211298&T=2

As an alternative you can also use a QR Code:  

The GUIDs for individual cells are displayed in the table below:

Regression: S.E.(k) = alpha + beta * Mean(k)
alpha48829.7450145218
beta0.0529904929863501
S.D.0.0034995679875414
T-STAT15.1420098637884
p-value3.58189365240398e-07


Regression: ln S.E.(k) = alpha + beta * ln Mean(k)
alpha1.13762209162309
beta0.746475079031392
S.D.0.0667729072615218
T-STAT11.1793107361307
p-value3.67147108450728e-06
Lambda0.253524920968608

\begin{tabular}{lllllllll}
\hline
Regression: ln S.E.(k) = alpha + beta * ln Mean(k) \tabularnewline
alpha & 1.13762209162309 \tabularnewline
beta & 0.746475079031392 \tabularnewline
S.D. & 0.0667729072615218 \tabularnewline
T-STAT & 11.1793107361307 \tabularnewline
p-value & 3.67147108450728e-06 \tabularnewline
Lambda & 0.253524920968608 \tabularnewline
\hline
\end{tabular}
%Source: https://freestatistics.org/blog/index.php?pk=211298&T=3

[TABLE]
[ROW][C]Regression: ln S.E.(k) = alpha + beta * ln Mean(k)[/C][/ROW]
[ROW][C]alpha[/C][C]1.13762209162309[/C][/ROW]
[ROW][C]beta[/C][C]0.746475079031392[/C][/ROW]
[ROW][C]S.D.[/C][C]0.0667729072615218[/C][/ROW]
[ROW][C]T-STAT[/C][C]11.1793107361307[/C][/ROW]
[ROW][C]p-value[/C][C]3.67147108450728e-06[/C][/ROW]
[ROW][C]Lambda[/C][C]0.253524920968608[/C][/ROW]
[/TABLE]
Source: https://freestatistics.org/blog/index.php?pk=211298&T=3

Globally Unique Identifier (entire table): ba.freestatistics.org/blog/index.php?pk=211298&T=3

As an alternative you can also use a QR Code:  

The GUIDs for individual cells are displayed in the table below:

Regression: ln S.E.(k) = alpha + beta * ln Mean(k)
alpha1.13762209162309
beta0.746475079031392
S.D.0.0667729072615218
T-STAT11.1793107361307
p-value3.67147108450728e-06
Lambda0.253524920968608


Parameters (Session):
par1 = 12 ;
Parameters (R input):
par1 = 12 ;
R code (references can be found in the software module):
par1 <- as.numeric(par1)
(n <- length(x))
(np <- floor(n / par1))
arr <- array(NA,dim=c(par1,np))
j <- 0
k <- 1
for (i in 1:(np*par1))
{
j = j + 1
arr[j,k] <- x[i]
if (j == par1) {
j = 0
k=k+1
}
}
arr
arr.mean <- array(NA,dim=np)
arr.sd <- array(NA,dim=np)
arr.range <- array(NA,dim=np)
for (j in 1:np)
{
arr.mean[j] <- mean(arr[,j],na.rm=TRUE)
arr.sd[j] <- sd(arr[,j],na.rm=TRUE)
arr.range[j] <- max(arr[,j],na.rm=TRUE) - min(arr[,j],na.rm=TRUE)
}
arr.mean
arr.sd
arr.range
(lm1 <- lm(arr.sd~arr.mean))
(lnlm1 <- lm(log(arr.sd)~log(arr.mean)))
(lm2 <- lm(arr.range~arr.mean))
bitmap(file='test1.png')
plot(arr.mean,arr.sd,main='Standard Deviation-Mean Plot',xlab='mean',ylab='standard deviation')
dev.off()
bitmap(file='test2.png')
plot(arr.mean,arr.range,main='Range-Mean Plot',xlab='mean',ylab='range')
dev.off()
load(file='createtable')
a<-table.start()
a<-table.row.start(a)
a<-table.element(a,'Standard Deviation-Mean Plot',4,TRUE)
a<-table.row.end(a)
a<-table.row.start(a)
a<-table.element(a,'Section',header=TRUE)
a<-table.element(a,'Mean',header=TRUE)
a<-table.element(a,'Standard Deviation',header=TRUE)
a<-table.element(a,'Range',header=TRUE)
a<-table.row.end(a)
for (j in 1:np) {
a<-table.row.start(a)
a<-table.element(a,j,header=TRUE)
a<-table.element(a,arr.mean[j])
a<-table.element(a,arr.sd[j] )
a<-table.element(a,arr.range[j] )
a<-table.row.end(a)
}
a<-table.end(a)
table.save(a,file='mytable.tab')
a<-table.start()
a<-table.row.start(a)
a<-table.element(a,'Regression: S.E.(k) = alpha + beta * Mean(k)',2,TRUE)
a<-table.row.end(a)
a<-table.row.start(a)
a<-table.element(a,'alpha',header=TRUE)
a<-table.element(a,lm1$coefficients[[1]])
a<-table.row.end(a)
a<-table.row.start(a)
a<-table.element(a,'beta',header=TRUE)
a<-table.element(a,lm1$coefficients[[2]])
a<-table.row.end(a)
a<-table.row.start(a)
a<-table.element(a,'S.D.',header=TRUE)
a<-table.element(a,summary(lm1)$coefficients[2,2])
a<-table.row.end(a)
a<-table.row.start(a)
a<-table.element(a,'T-STAT',header=TRUE)
a<-table.element(a,summary(lm1)$coefficients[2,3])
a<-table.row.end(a)
a<-table.row.start(a)
a<-table.element(a,'p-value',header=TRUE)
a<-table.element(a,summary(lm1)$coefficients[2,4])
a<-table.row.end(a)
a<-table.end(a)
table.save(a,file='mytable1.tab')
a<-table.start()
a<-table.row.start(a)
a<-table.element(a,'Regression: ln S.E.(k) = alpha + beta * ln Mean(k)',2,TRUE)
a<-table.row.end(a)
a<-table.row.start(a)
a<-table.element(a,'alpha',header=TRUE)
a<-table.element(a,lnlm1$coefficients[[1]])
a<-table.row.end(a)
a<-table.row.start(a)
a<-table.element(a,'beta',header=TRUE)
a<-table.element(a,lnlm1$coefficients[[2]])
a<-table.row.end(a)
a<-table.row.start(a)
a<-table.element(a,'S.D.',header=TRUE)
a<-table.element(a,summary(lnlm1)$coefficients[2,2])
a<-table.row.end(a)
a<-table.row.start(a)
a<-table.element(a,'T-STAT',header=TRUE)
a<-table.element(a,summary(lnlm1)$coefficients[2,3])
a<-table.row.end(a)
a<-table.row.start(a)
a<-table.element(a,'p-value',header=TRUE)
a<-table.element(a,summary(lnlm1)$coefficients[2,4])
a<-table.row.end(a)
a<-table.row.start(a)
a<-table.element(a,'Lambda',header=TRUE)
a<-table.element(a,1-lnlm1$coefficients[[2]])
a<-table.row.end(a)
a<-table.end(a)
table.save(a,file='mytable2.tab')