Free Statistics

of Irreproducible Research!

Author's title

Author*Unverified author*
R Software Modulerwasp_autocorrelation.wasp
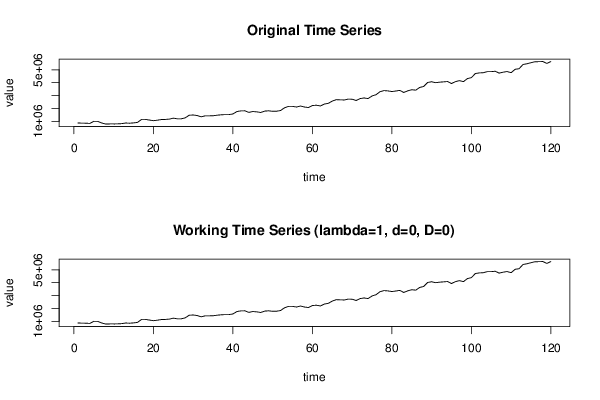
Title produced by software(Partial) Autocorrelation Function
Date of computationWed, 21 Aug 2013 02:48:46 -0400
Cite this page as followsStatistical Computations at FreeStatistics.org, Office for Research Development and Education, URL https://freestatistics.org/blog/index.php?v=date/2013/Aug/21/t13770678626lphkltw2itat34.htm/, Retrieved Sat, 27 Apr 2024 05:58:56 +0000
Statistical Computations at FreeStatistics.org, Office for Research Development and Education, URL https://freestatistics.org/blog/index.php?pk=211293, Retrieved Sat, 27 Apr 2024 05:58:56 +0000
QR Codes:

Original text written by user:
IsPrivate?No (this computation is public)
User-defined keywordsJoris Claus
Estimated Impact109
Family? (F = Feedback message, R = changed R code, M = changed R Module, P = changed Parameters, D = changed Data)
-       [(Partial) Autocorrelation Function] [Tijdreeks A - Sta...] [2013-08-21 06:48:46] [5b48cba8ffed7710e2defc0d8d22bd89] [Current]
Feedback Forum

Post a new message
Dataseries X:
865911
858030
850038
833499
997113
988455
865911
784437
792318
792318
801087
816849
865911
850038
874569
914862
1144188
1144188
1095237
1046175
1086468
1135530
1144188
1168719
1242312
1193250
1193250
1266843
1470861
1487400
1446330
1348206
1421799
1421799
1429680
1470861
1503273
1519812
1519812
1568874
1757130
1806081
1813962
1691418
1757130
1732599
1683537
1789542
1813962
1772892
1781550
1838493
2051280
2157174
2157174
2108223
2181705
2108223
2067042
2222886
2247306
2189586
2336661
2394381
2565987
2679873
2664111
2655342
2721054
2713062
2615049
2762124
2811186
2762124
2966142
3064266
3292704
3382836
3358416
3309354
3350424
3399486
3235761
3366297
3448548
3415359
3628035
3701517
4012317
4069260
3995778
4036848
4061379
4085910
3930066
4077141
4158615
4077141
4314459
4387941
4706622
4755684
4771446
4853697
4853697
4886109
4739034
4812627
4861578
4771446
5033184
5082246
5408808
5466528
5548002
5621595
5629476
5638134
5491059
5638134


Summary of computational transaction
Raw Inputview raw input (R code)
Raw Outputview raw output of R engine
Computing time3 seconds
R Server'Herman Ole Andreas Wold' @ wold.wessa.net

\begin{tabular}{lllllllll}
\hline
Summary of computational transaction \tabularnewline
Raw Input & view raw input (R code)  \tabularnewline
Raw Output & view raw output of R engine  \tabularnewline
Computing time & 3 seconds \tabularnewline
R Server & 'Herman Ole Andreas Wold' @ wold.wessa.net \tabularnewline
\hline
\end{tabular}
%Source: https://freestatistics.org/blog/index.php?pk=211293&T=0

[TABLE]
[ROW][C]Summary of computational transaction[/C][/ROW]
[ROW][C]Raw Input[/C][C]view raw input (R code) [/C][/ROW]
[ROW][C]Raw Output[/C][C]view raw output of R engine [/C][/ROW]
[ROW][C]Computing time[/C][C]3 seconds[/C][/ROW]
[ROW][C]R Server[/C][C]'Herman Ole Andreas Wold' @ wold.wessa.net[/C][/ROW]
[/TABLE]
Source: https://freestatistics.org/blog/index.php?pk=211293&T=0

Globally Unique Identifier (entire table): ba.freestatistics.org/blog/index.php?pk=211293&T=0

As an alternative you can also use a QR Code:  

The GUIDs for individual cells are displayed in the table below:

Summary of computational transaction
Raw Inputview raw input (R code)
Raw Outputview raw output of R engine
Computing time3 seconds
R Server'Herman Ole Andreas Wold' @ wold.wessa.net


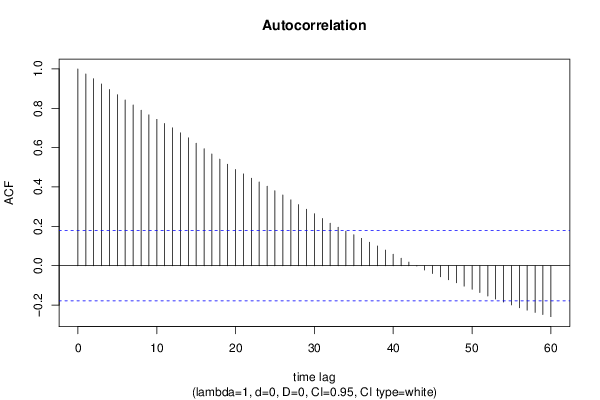
Autocorrelation Function
Time lag kACF(k)T-STATP-value
10.97471910.67750
20.95039510.41110
30.92351610.11660
40.8958759.81380
50.8690729.52020
60.8423119.22710
70.8164468.94370
80.78988.65180
90.7667178.3990
100.7435868.14560
110.7229077.91910
120.7006387.67510
130.6751797.39620
140.6498347.11860
150.6222476.81640
160.5944656.5120
170.5678066.220
180.5415125.9320
190.5156235.64840
200.4892595.35960
210.4665485.11081e-06
220.444634.87072e-06
230.425054.65624e-06
240.4040814.42651.1e-05
250.3812884.17682.8e-05
260.3591693.93457e-05
270.3347333.66680.000184
280.3102513.39860.00046
290.2869823.14370.001051
300.2639372.89130.002278
310.2401662.63090.004817
320.2159122.36520.009812
330.1953362.13980.017198
340.1754081.92150.02852
350.1575811.72620.043441
360.1390181.52290.065211
370.1191111.30480.09723
380.1001561.09710.137386
390.0790280.86570.194189
400.0579960.63530.263217
410.0382730.41930.337888
420.0181420.19870.421405
43-0.001973-0.02160.491396
44-0.022262-0.24390.403874
45-0.03994-0.43750.331261
46-0.056616-0.62020.268153
47-0.071658-0.7850.217009
48-0.087163-0.95480.170793
49-0.103814-1.13720.128855
50-0.119635-1.31050.096259
51-0.136568-1.4960.068637
52-0.153921-1.68610.047186
53-0.169469-1.85640.032922
54-0.184435-2.02040.022785
55-0.199432-2.18470.015429
56-0.213685-2.34080.010446
57-0.225838-2.47390.007381
58-0.237558-2.60230.005213
59-0.24825-2.71940.003755
60-0.25906-2.83790.002667

\begin{tabular}{lllllllll}
\hline
Autocorrelation Function \tabularnewline
Time lag k & ACF(k) & T-STAT & P-value \tabularnewline
1 & 0.974719 & 10.6775 & 0 \tabularnewline
2 & 0.950395 & 10.4111 & 0 \tabularnewline
3 & 0.923516 & 10.1166 & 0 \tabularnewline
4 & 0.895875 & 9.8138 & 0 \tabularnewline
5 & 0.869072 & 9.5202 & 0 \tabularnewline
6 & 0.842311 & 9.2271 & 0 \tabularnewline
7 & 0.816446 & 8.9437 & 0 \tabularnewline
8 & 0.7898 & 8.6518 & 0 \tabularnewline
9 & 0.766717 & 8.399 & 0 \tabularnewline
10 & 0.743586 & 8.1456 & 0 \tabularnewline
11 & 0.722907 & 7.9191 & 0 \tabularnewline
12 & 0.700638 & 7.6751 & 0 \tabularnewline
13 & 0.675179 & 7.3962 & 0 \tabularnewline
14 & 0.649834 & 7.1186 & 0 \tabularnewline
15 & 0.622247 & 6.8164 & 0 \tabularnewline
16 & 0.594465 & 6.512 & 0 \tabularnewline
17 & 0.567806 & 6.22 & 0 \tabularnewline
18 & 0.541512 & 5.932 & 0 \tabularnewline
19 & 0.515623 & 5.6484 & 0 \tabularnewline
20 & 0.489259 & 5.3596 & 0 \tabularnewline
21 & 0.466548 & 5.1108 & 1e-06 \tabularnewline
22 & 0.44463 & 4.8707 & 2e-06 \tabularnewline
23 & 0.42505 & 4.6562 & 4e-06 \tabularnewline
24 & 0.404081 & 4.4265 & 1.1e-05 \tabularnewline
25 & 0.381288 & 4.1768 & 2.8e-05 \tabularnewline
26 & 0.359169 & 3.9345 & 7e-05 \tabularnewline
27 & 0.334733 & 3.6668 & 0.000184 \tabularnewline
28 & 0.310251 & 3.3986 & 0.00046 \tabularnewline
29 & 0.286982 & 3.1437 & 0.001051 \tabularnewline
30 & 0.263937 & 2.8913 & 0.002278 \tabularnewline
31 & 0.240166 & 2.6309 & 0.004817 \tabularnewline
32 & 0.215912 & 2.3652 & 0.009812 \tabularnewline
33 & 0.195336 & 2.1398 & 0.017198 \tabularnewline
34 & 0.175408 & 1.9215 & 0.02852 \tabularnewline
35 & 0.157581 & 1.7262 & 0.043441 \tabularnewline
36 & 0.139018 & 1.5229 & 0.065211 \tabularnewline
37 & 0.119111 & 1.3048 & 0.09723 \tabularnewline
38 & 0.100156 & 1.0971 & 0.137386 \tabularnewline
39 & 0.079028 & 0.8657 & 0.194189 \tabularnewline
40 & 0.057996 & 0.6353 & 0.263217 \tabularnewline
41 & 0.038273 & 0.4193 & 0.337888 \tabularnewline
42 & 0.018142 & 0.1987 & 0.421405 \tabularnewline
43 & -0.001973 & -0.0216 & 0.491396 \tabularnewline
44 & -0.022262 & -0.2439 & 0.403874 \tabularnewline
45 & -0.03994 & -0.4375 & 0.331261 \tabularnewline
46 & -0.056616 & -0.6202 & 0.268153 \tabularnewline
47 & -0.071658 & -0.785 & 0.217009 \tabularnewline
48 & -0.087163 & -0.9548 & 0.170793 \tabularnewline
49 & -0.103814 & -1.1372 & 0.128855 \tabularnewline
50 & -0.119635 & -1.3105 & 0.096259 \tabularnewline
51 & -0.136568 & -1.496 & 0.068637 \tabularnewline
52 & -0.153921 & -1.6861 & 0.047186 \tabularnewline
53 & -0.169469 & -1.8564 & 0.032922 \tabularnewline
54 & -0.184435 & -2.0204 & 0.022785 \tabularnewline
55 & -0.199432 & -2.1847 & 0.015429 \tabularnewline
56 & -0.213685 & -2.3408 & 0.010446 \tabularnewline
57 & -0.225838 & -2.4739 & 0.007381 \tabularnewline
58 & -0.237558 & -2.6023 & 0.005213 \tabularnewline
59 & -0.24825 & -2.7194 & 0.003755 \tabularnewline
60 & -0.25906 & -2.8379 & 0.002667 \tabularnewline
\hline
\end{tabular}
%Source: https://freestatistics.org/blog/index.php?pk=211293&T=1

[TABLE]
[ROW][C]Autocorrelation Function[/C][/ROW]
[ROW][C]Time lag k[/C][C]ACF(k)[/C][C]T-STAT[/C][C]P-value[/C][/ROW]
[ROW][C]1[/C][C]0.974719[/C][C]10.6775[/C][C]0[/C][/ROW]
[ROW][C]2[/C][C]0.950395[/C][C]10.4111[/C][C]0[/C][/ROW]
[ROW][C]3[/C][C]0.923516[/C][C]10.1166[/C][C]0[/C][/ROW]
[ROW][C]4[/C][C]0.895875[/C][C]9.8138[/C][C]0[/C][/ROW]
[ROW][C]5[/C][C]0.869072[/C][C]9.5202[/C][C]0[/C][/ROW]
[ROW][C]6[/C][C]0.842311[/C][C]9.2271[/C][C]0[/C][/ROW]
[ROW][C]7[/C][C]0.816446[/C][C]8.9437[/C][C]0[/C][/ROW]
[ROW][C]8[/C][C]0.7898[/C][C]8.6518[/C][C]0[/C][/ROW]
[ROW][C]9[/C][C]0.766717[/C][C]8.399[/C][C]0[/C][/ROW]
[ROW][C]10[/C][C]0.743586[/C][C]8.1456[/C][C]0[/C][/ROW]
[ROW][C]11[/C][C]0.722907[/C][C]7.9191[/C][C]0[/C][/ROW]
[ROW][C]12[/C][C]0.700638[/C][C]7.6751[/C][C]0[/C][/ROW]
[ROW][C]13[/C][C]0.675179[/C][C]7.3962[/C][C]0[/C][/ROW]
[ROW][C]14[/C][C]0.649834[/C][C]7.1186[/C][C]0[/C][/ROW]
[ROW][C]15[/C][C]0.622247[/C][C]6.8164[/C][C]0[/C][/ROW]
[ROW][C]16[/C][C]0.594465[/C][C]6.512[/C][C]0[/C][/ROW]
[ROW][C]17[/C][C]0.567806[/C][C]6.22[/C][C]0[/C][/ROW]
[ROW][C]18[/C][C]0.541512[/C][C]5.932[/C][C]0[/C][/ROW]
[ROW][C]19[/C][C]0.515623[/C][C]5.6484[/C][C]0[/C][/ROW]
[ROW][C]20[/C][C]0.489259[/C][C]5.3596[/C][C]0[/C][/ROW]
[ROW][C]21[/C][C]0.466548[/C][C]5.1108[/C][C]1e-06[/C][/ROW]
[ROW][C]22[/C][C]0.44463[/C][C]4.8707[/C][C]2e-06[/C][/ROW]
[ROW][C]23[/C][C]0.42505[/C][C]4.6562[/C][C]4e-06[/C][/ROW]
[ROW][C]24[/C][C]0.404081[/C][C]4.4265[/C][C]1.1e-05[/C][/ROW]
[ROW][C]25[/C][C]0.381288[/C][C]4.1768[/C][C]2.8e-05[/C][/ROW]
[ROW][C]26[/C][C]0.359169[/C][C]3.9345[/C][C]7e-05[/C][/ROW]
[ROW][C]27[/C][C]0.334733[/C][C]3.6668[/C][C]0.000184[/C][/ROW]
[ROW][C]28[/C][C]0.310251[/C][C]3.3986[/C][C]0.00046[/C][/ROW]
[ROW][C]29[/C][C]0.286982[/C][C]3.1437[/C][C]0.001051[/C][/ROW]
[ROW][C]30[/C][C]0.263937[/C][C]2.8913[/C][C]0.002278[/C][/ROW]
[ROW][C]31[/C][C]0.240166[/C][C]2.6309[/C][C]0.004817[/C][/ROW]
[ROW][C]32[/C][C]0.215912[/C][C]2.3652[/C][C]0.009812[/C][/ROW]
[ROW][C]33[/C][C]0.195336[/C][C]2.1398[/C][C]0.017198[/C][/ROW]
[ROW][C]34[/C][C]0.175408[/C][C]1.9215[/C][C]0.02852[/C][/ROW]
[ROW][C]35[/C][C]0.157581[/C][C]1.7262[/C][C]0.043441[/C][/ROW]
[ROW][C]36[/C][C]0.139018[/C][C]1.5229[/C][C]0.065211[/C][/ROW]
[ROW][C]37[/C][C]0.119111[/C][C]1.3048[/C][C]0.09723[/C][/ROW]
[ROW][C]38[/C][C]0.100156[/C][C]1.0971[/C][C]0.137386[/C][/ROW]
[ROW][C]39[/C][C]0.079028[/C][C]0.8657[/C][C]0.194189[/C][/ROW]
[ROW][C]40[/C][C]0.057996[/C][C]0.6353[/C][C]0.263217[/C][/ROW]
[ROW][C]41[/C][C]0.038273[/C][C]0.4193[/C][C]0.337888[/C][/ROW]
[ROW][C]42[/C][C]0.018142[/C][C]0.1987[/C][C]0.421405[/C][/ROW]
[ROW][C]43[/C][C]-0.001973[/C][C]-0.0216[/C][C]0.491396[/C][/ROW]
[ROW][C]44[/C][C]-0.022262[/C][C]-0.2439[/C][C]0.403874[/C][/ROW]
[ROW][C]45[/C][C]-0.03994[/C][C]-0.4375[/C][C]0.331261[/C][/ROW]
[ROW][C]46[/C][C]-0.056616[/C][C]-0.6202[/C][C]0.268153[/C][/ROW]
[ROW][C]47[/C][C]-0.071658[/C][C]-0.785[/C][C]0.217009[/C][/ROW]
[ROW][C]48[/C][C]-0.087163[/C][C]-0.9548[/C][C]0.170793[/C][/ROW]
[ROW][C]49[/C][C]-0.103814[/C][C]-1.1372[/C][C]0.128855[/C][/ROW]
[ROW][C]50[/C][C]-0.119635[/C][C]-1.3105[/C][C]0.096259[/C][/ROW]
[ROW][C]51[/C][C]-0.136568[/C][C]-1.496[/C][C]0.068637[/C][/ROW]
[ROW][C]52[/C][C]-0.153921[/C][C]-1.6861[/C][C]0.047186[/C][/ROW]
[ROW][C]53[/C][C]-0.169469[/C][C]-1.8564[/C][C]0.032922[/C][/ROW]
[ROW][C]54[/C][C]-0.184435[/C][C]-2.0204[/C][C]0.022785[/C][/ROW]
[ROW][C]55[/C][C]-0.199432[/C][C]-2.1847[/C][C]0.015429[/C][/ROW]
[ROW][C]56[/C][C]-0.213685[/C][C]-2.3408[/C][C]0.010446[/C][/ROW]
[ROW][C]57[/C][C]-0.225838[/C][C]-2.4739[/C][C]0.007381[/C][/ROW]
[ROW][C]58[/C][C]-0.237558[/C][C]-2.6023[/C][C]0.005213[/C][/ROW]
[ROW][C]59[/C][C]-0.24825[/C][C]-2.7194[/C][C]0.003755[/C][/ROW]
[ROW][C]60[/C][C]-0.25906[/C][C]-2.8379[/C][C]0.002667[/C][/ROW]
[/TABLE]
Source: https://freestatistics.org/blog/index.php?pk=211293&T=1

Globally Unique Identifier (entire table): ba.freestatistics.org/blog/index.php?pk=211293&T=1

As an alternative you can also use a QR Code:  

The GUIDs for individual cells are displayed in the table below:

Autocorrelation Function
Time lag kACF(k)T-STATP-value
10.97471910.67750
20.95039510.41110
30.92351610.11660
40.8958759.81380
50.8690729.52020
60.8423119.22710
70.8164468.94370
80.78988.65180
90.7667178.3990
100.7435868.14560
110.7229077.91910
120.7006387.67510
130.6751797.39620
140.6498347.11860
150.6222476.81640
160.5944656.5120
170.5678066.220
180.5415125.9320
190.5156235.64840
200.4892595.35960
210.4665485.11081e-06
220.444634.87072e-06
230.425054.65624e-06
240.4040814.42651.1e-05
250.3812884.17682.8e-05
260.3591693.93457e-05
270.3347333.66680.000184
280.3102513.39860.00046
290.2869823.14370.001051
300.2639372.89130.002278
310.2401662.63090.004817
320.2159122.36520.009812
330.1953362.13980.017198
340.1754081.92150.02852
350.1575811.72620.043441
360.1390181.52290.065211
370.1191111.30480.09723
380.1001561.09710.137386
390.0790280.86570.194189
400.0579960.63530.263217
410.0382730.41930.337888
420.0181420.19870.421405
43-0.001973-0.02160.491396
44-0.022262-0.24390.403874
45-0.03994-0.43750.331261
46-0.056616-0.62020.268153
47-0.071658-0.7850.217009
48-0.087163-0.95480.170793
49-0.103814-1.13720.128855
50-0.119635-1.31050.096259
51-0.136568-1.4960.068637
52-0.153921-1.68610.047186
53-0.169469-1.85640.032922
54-0.184435-2.02040.022785
55-0.199432-2.18470.015429
56-0.213685-2.34080.010446
57-0.225838-2.47390.007381
58-0.237558-2.60230.005213
59-0.24825-2.71940.003755
60-0.25906-2.83790.002667


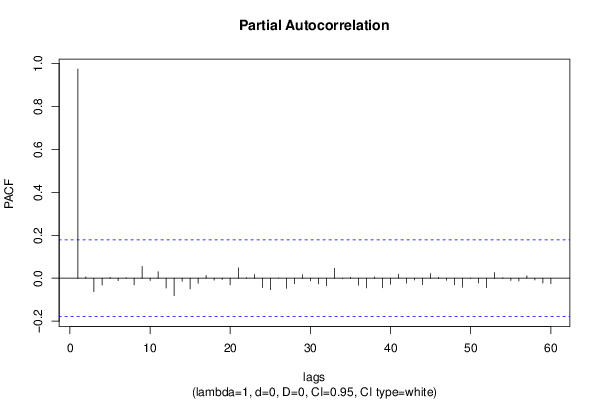
Partial Autocorrelation Function
Time lag kPACF(k)T-STATP-value
10.97471910.67750
20.006370.06980.472244
3-0.063311-0.69350.244658
4-0.031201-0.34180.366554
50.0041610.04560.481858
6-0.011187-0.12250.451335
70.0020640.02260.490998
8-0.030063-0.32930.371243
90.0548140.60050.274667
10-0.01043-0.11430.454611
110.0302580.33150.370436
12-0.045709-0.50070.308746
13-0.080955-0.88680.188475
14-0.014006-0.15340.439159
15-0.049486-0.54210.294382
16-0.023285-0.25510.399552
170.012970.14210.443626
18-0.008737-0.09570.461954
19-0.006112-0.0670.473364
20-0.030352-0.33250.370051
210.048360.52980.298631
220.0021730.02380.490523
230.0173640.19020.424733
24-0.043157-0.47280.318622
25-0.053012-0.58070.281261
26-7.7e-05-8e-040.499662
27-0.046986-0.51470.303852
28-0.025062-0.27450.39207
290.0165230.1810.428338
30-0.011394-0.12480.450439
31-0.026338-0.28850.386723
32-0.03544-0.38820.349267
330.0459450.50330.307839
34-0.00261-0.02860.488619
350.0042870.0470.481313
36-0.0322-0.35270.362454
37-0.045083-0.49390.311152
380.0056750.06220.475268
39-0.044362-0.4860.313942
40-0.028291-0.30990.378581
410.0185430.20310.419689
42-0.022864-0.25050.401327
43-0.008312-0.0910.463803
44-0.029984-0.32850.371567
450.021620.23680.406596
460.0039540.04330.482763
47-0.009773-0.10710.457463
48-0.030049-0.32920.371299
49-0.042057-0.46070.322918
500.0011210.01230.495113
51-0.022239-0.24360.40397
52-0.043898-0.48090.315738
530.0268850.29450.384439
540.0021170.02320.490768
55-0.010624-0.11640.453772
56-0.01323-0.14490.442505
570.0116440.12750.44936
58-0.0079-0.08650.465588
59-0.022428-0.24570.403173
60-0.025411-0.27840.390605

\begin{tabular}{lllllllll}
\hline
Partial Autocorrelation Function \tabularnewline
Time lag k & PACF(k) & T-STAT & P-value \tabularnewline
1 & 0.974719 & 10.6775 & 0 \tabularnewline
2 & 0.00637 & 0.0698 & 0.472244 \tabularnewline
3 & -0.063311 & -0.6935 & 0.244658 \tabularnewline
4 & -0.031201 & -0.3418 & 0.366554 \tabularnewline
5 & 0.004161 & 0.0456 & 0.481858 \tabularnewline
6 & -0.011187 & -0.1225 & 0.451335 \tabularnewline
7 & 0.002064 & 0.0226 & 0.490998 \tabularnewline
8 & -0.030063 & -0.3293 & 0.371243 \tabularnewline
9 & 0.054814 & 0.6005 & 0.274667 \tabularnewline
10 & -0.01043 & -0.1143 & 0.454611 \tabularnewline
11 & 0.030258 & 0.3315 & 0.370436 \tabularnewline
12 & -0.045709 & -0.5007 & 0.308746 \tabularnewline
13 & -0.080955 & -0.8868 & 0.188475 \tabularnewline
14 & -0.014006 & -0.1534 & 0.439159 \tabularnewline
15 & -0.049486 & -0.5421 & 0.294382 \tabularnewline
16 & -0.023285 & -0.2551 & 0.399552 \tabularnewline
17 & 0.01297 & 0.1421 & 0.443626 \tabularnewline
18 & -0.008737 & -0.0957 & 0.461954 \tabularnewline
19 & -0.006112 & -0.067 & 0.473364 \tabularnewline
20 & -0.030352 & -0.3325 & 0.370051 \tabularnewline
21 & 0.04836 & 0.5298 & 0.298631 \tabularnewline
22 & 0.002173 & 0.0238 & 0.490523 \tabularnewline
23 & 0.017364 & 0.1902 & 0.424733 \tabularnewline
24 & -0.043157 & -0.4728 & 0.318622 \tabularnewline
25 & -0.053012 & -0.5807 & 0.281261 \tabularnewline
26 & -7.7e-05 & -8e-04 & 0.499662 \tabularnewline
27 & -0.046986 & -0.5147 & 0.303852 \tabularnewline
28 & -0.025062 & -0.2745 & 0.39207 \tabularnewline
29 & 0.016523 & 0.181 & 0.428338 \tabularnewline
30 & -0.011394 & -0.1248 & 0.450439 \tabularnewline
31 & -0.026338 & -0.2885 & 0.386723 \tabularnewline
32 & -0.03544 & -0.3882 & 0.349267 \tabularnewline
33 & 0.045945 & 0.5033 & 0.307839 \tabularnewline
34 & -0.00261 & -0.0286 & 0.488619 \tabularnewline
35 & 0.004287 & 0.047 & 0.481313 \tabularnewline
36 & -0.0322 & -0.3527 & 0.362454 \tabularnewline
37 & -0.045083 & -0.4939 & 0.311152 \tabularnewline
38 & 0.005675 & 0.0622 & 0.475268 \tabularnewline
39 & -0.044362 & -0.486 & 0.313942 \tabularnewline
40 & -0.028291 & -0.3099 & 0.378581 \tabularnewline
41 & 0.018543 & 0.2031 & 0.419689 \tabularnewline
42 & -0.022864 & -0.2505 & 0.401327 \tabularnewline
43 & -0.008312 & -0.091 & 0.463803 \tabularnewline
44 & -0.029984 & -0.3285 & 0.371567 \tabularnewline
45 & 0.02162 & 0.2368 & 0.406596 \tabularnewline
46 & 0.003954 & 0.0433 & 0.482763 \tabularnewline
47 & -0.009773 & -0.1071 & 0.457463 \tabularnewline
48 & -0.030049 & -0.3292 & 0.371299 \tabularnewline
49 & -0.042057 & -0.4607 & 0.322918 \tabularnewline
50 & 0.001121 & 0.0123 & 0.495113 \tabularnewline
51 & -0.022239 & -0.2436 & 0.40397 \tabularnewline
52 & -0.043898 & -0.4809 & 0.315738 \tabularnewline
53 & 0.026885 & 0.2945 & 0.384439 \tabularnewline
54 & 0.002117 & 0.0232 & 0.490768 \tabularnewline
55 & -0.010624 & -0.1164 & 0.453772 \tabularnewline
56 & -0.01323 & -0.1449 & 0.442505 \tabularnewline
57 & 0.011644 & 0.1275 & 0.44936 \tabularnewline
58 & -0.0079 & -0.0865 & 0.465588 \tabularnewline
59 & -0.022428 & -0.2457 & 0.403173 \tabularnewline
60 & -0.025411 & -0.2784 & 0.390605 \tabularnewline
\hline
\end{tabular}
%Source: https://freestatistics.org/blog/index.php?pk=211293&T=2

[TABLE]
[ROW][C]Partial Autocorrelation Function[/C][/ROW]
[ROW][C]Time lag k[/C][C]PACF(k)[/C][C]T-STAT[/C][C]P-value[/C][/ROW]
[ROW][C]1[/C][C]0.974719[/C][C]10.6775[/C][C]0[/C][/ROW]
[ROW][C]2[/C][C]0.00637[/C][C]0.0698[/C][C]0.472244[/C][/ROW]
[ROW][C]3[/C][C]-0.063311[/C][C]-0.6935[/C][C]0.244658[/C][/ROW]
[ROW][C]4[/C][C]-0.031201[/C][C]-0.3418[/C][C]0.366554[/C][/ROW]
[ROW][C]5[/C][C]0.004161[/C][C]0.0456[/C][C]0.481858[/C][/ROW]
[ROW][C]6[/C][C]-0.011187[/C][C]-0.1225[/C][C]0.451335[/C][/ROW]
[ROW][C]7[/C][C]0.002064[/C][C]0.0226[/C][C]0.490998[/C][/ROW]
[ROW][C]8[/C][C]-0.030063[/C][C]-0.3293[/C][C]0.371243[/C][/ROW]
[ROW][C]9[/C][C]0.054814[/C][C]0.6005[/C][C]0.274667[/C][/ROW]
[ROW][C]10[/C][C]-0.01043[/C][C]-0.1143[/C][C]0.454611[/C][/ROW]
[ROW][C]11[/C][C]0.030258[/C][C]0.3315[/C][C]0.370436[/C][/ROW]
[ROW][C]12[/C][C]-0.045709[/C][C]-0.5007[/C][C]0.308746[/C][/ROW]
[ROW][C]13[/C][C]-0.080955[/C][C]-0.8868[/C][C]0.188475[/C][/ROW]
[ROW][C]14[/C][C]-0.014006[/C][C]-0.1534[/C][C]0.439159[/C][/ROW]
[ROW][C]15[/C][C]-0.049486[/C][C]-0.5421[/C][C]0.294382[/C][/ROW]
[ROW][C]16[/C][C]-0.023285[/C][C]-0.2551[/C][C]0.399552[/C][/ROW]
[ROW][C]17[/C][C]0.01297[/C][C]0.1421[/C][C]0.443626[/C][/ROW]
[ROW][C]18[/C][C]-0.008737[/C][C]-0.0957[/C][C]0.461954[/C][/ROW]
[ROW][C]19[/C][C]-0.006112[/C][C]-0.067[/C][C]0.473364[/C][/ROW]
[ROW][C]20[/C][C]-0.030352[/C][C]-0.3325[/C][C]0.370051[/C][/ROW]
[ROW][C]21[/C][C]0.04836[/C][C]0.5298[/C][C]0.298631[/C][/ROW]
[ROW][C]22[/C][C]0.002173[/C][C]0.0238[/C][C]0.490523[/C][/ROW]
[ROW][C]23[/C][C]0.017364[/C][C]0.1902[/C][C]0.424733[/C][/ROW]
[ROW][C]24[/C][C]-0.043157[/C][C]-0.4728[/C][C]0.318622[/C][/ROW]
[ROW][C]25[/C][C]-0.053012[/C][C]-0.5807[/C][C]0.281261[/C][/ROW]
[ROW][C]26[/C][C]-7.7e-05[/C][C]-8e-04[/C][C]0.499662[/C][/ROW]
[ROW][C]27[/C][C]-0.046986[/C][C]-0.5147[/C][C]0.303852[/C][/ROW]
[ROW][C]28[/C][C]-0.025062[/C][C]-0.2745[/C][C]0.39207[/C][/ROW]
[ROW][C]29[/C][C]0.016523[/C][C]0.181[/C][C]0.428338[/C][/ROW]
[ROW][C]30[/C][C]-0.011394[/C][C]-0.1248[/C][C]0.450439[/C][/ROW]
[ROW][C]31[/C][C]-0.026338[/C][C]-0.2885[/C][C]0.386723[/C][/ROW]
[ROW][C]32[/C][C]-0.03544[/C][C]-0.3882[/C][C]0.349267[/C][/ROW]
[ROW][C]33[/C][C]0.045945[/C][C]0.5033[/C][C]0.307839[/C][/ROW]
[ROW][C]34[/C][C]-0.00261[/C][C]-0.0286[/C][C]0.488619[/C][/ROW]
[ROW][C]35[/C][C]0.004287[/C][C]0.047[/C][C]0.481313[/C][/ROW]
[ROW][C]36[/C][C]-0.0322[/C][C]-0.3527[/C][C]0.362454[/C][/ROW]
[ROW][C]37[/C][C]-0.045083[/C][C]-0.4939[/C][C]0.311152[/C][/ROW]
[ROW][C]38[/C][C]0.005675[/C][C]0.0622[/C][C]0.475268[/C][/ROW]
[ROW][C]39[/C][C]-0.044362[/C][C]-0.486[/C][C]0.313942[/C][/ROW]
[ROW][C]40[/C][C]-0.028291[/C][C]-0.3099[/C][C]0.378581[/C][/ROW]
[ROW][C]41[/C][C]0.018543[/C][C]0.2031[/C][C]0.419689[/C][/ROW]
[ROW][C]42[/C][C]-0.022864[/C][C]-0.2505[/C][C]0.401327[/C][/ROW]
[ROW][C]43[/C][C]-0.008312[/C][C]-0.091[/C][C]0.463803[/C][/ROW]
[ROW][C]44[/C][C]-0.029984[/C][C]-0.3285[/C][C]0.371567[/C][/ROW]
[ROW][C]45[/C][C]0.02162[/C][C]0.2368[/C][C]0.406596[/C][/ROW]
[ROW][C]46[/C][C]0.003954[/C][C]0.0433[/C][C]0.482763[/C][/ROW]
[ROW][C]47[/C][C]-0.009773[/C][C]-0.1071[/C][C]0.457463[/C][/ROW]
[ROW][C]48[/C][C]-0.030049[/C][C]-0.3292[/C][C]0.371299[/C][/ROW]
[ROW][C]49[/C][C]-0.042057[/C][C]-0.4607[/C][C]0.322918[/C][/ROW]
[ROW][C]50[/C][C]0.001121[/C][C]0.0123[/C][C]0.495113[/C][/ROW]
[ROW][C]51[/C][C]-0.022239[/C][C]-0.2436[/C][C]0.40397[/C][/ROW]
[ROW][C]52[/C][C]-0.043898[/C][C]-0.4809[/C][C]0.315738[/C][/ROW]
[ROW][C]53[/C][C]0.026885[/C][C]0.2945[/C][C]0.384439[/C][/ROW]
[ROW][C]54[/C][C]0.002117[/C][C]0.0232[/C][C]0.490768[/C][/ROW]
[ROW][C]55[/C][C]-0.010624[/C][C]-0.1164[/C][C]0.453772[/C][/ROW]
[ROW][C]56[/C][C]-0.01323[/C][C]-0.1449[/C][C]0.442505[/C][/ROW]
[ROW][C]57[/C][C]0.011644[/C][C]0.1275[/C][C]0.44936[/C][/ROW]
[ROW][C]58[/C][C]-0.0079[/C][C]-0.0865[/C][C]0.465588[/C][/ROW]
[ROW][C]59[/C][C]-0.022428[/C][C]-0.2457[/C][C]0.403173[/C][/ROW]
[ROW][C]60[/C][C]-0.025411[/C][C]-0.2784[/C][C]0.390605[/C][/ROW]
[/TABLE]
Source: https://freestatistics.org/blog/index.php?pk=211293&T=2

Globally Unique Identifier (entire table): ba.freestatistics.org/blog/index.php?pk=211293&T=2

As an alternative you can also use a QR Code:  

The GUIDs for individual cells are displayed in the table below:

Partial Autocorrelation Function
Time lag kPACF(k)T-STATP-value
10.97471910.67750
20.006370.06980.472244
3-0.063311-0.69350.244658
4-0.031201-0.34180.366554
50.0041610.04560.481858
6-0.011187-0.12250.451335
70.0020640.02260.490998
8-0.030063-0.32930.371243
90.0548140.60050.274667
10-0.01043-0.11430.454611
110.0302580.33150.370436
12-0.045709-0.50070.308746
13-0.080955-0.88680.188475
14-0.014006-0.15340.439159
15-0.049486-0.54210.294382
16-0.023285-0.25510.399552
170.012970.14210.443626
18-0.008737-0.09570.461954
19-0.006112-0.0670.473364
20-0.030352-0.33250.370051
210.048360.52980.298631
220.0021730.02380.490523
230.0173640.19020.424733
24-0.043157-0.47280.318622
25-0.053012-0.58070.281261
26-7.7e-05-8e-040.499662
27-0.046986-0.51470.303852
28-0.025062-0.27450.39207
290.0165230.1810.428338
30-0.011394-0.12480.450439
31-0.026338-0.28850.386723
32-0.03544-0.38820.349267
330.0459450.50330.307839
34-0.00261-0.02860.488619
350.0042870.0470.481313
36-0.0322-0.35270.362454
37-0.045083-0.49390.311152
380.0056750.06220.475268
39-0.044362-0.4860.313942
40-0.028291-0.30990.378581
410.0185430.20310.419689
42-0.022864-0.25050.401327
43-0.008312-0.0910.463803
44-0.029984-0.32850.371567
450.021620.23680.406596
460.0039540.04330.482763
47-0.009773-0.10710.457463
48-0.030049-0.32920.371299
49-0.042057-0.46070.322918
500.0011210.01230.495113
51-0.022239-0.24360.40397
52-0.043898-0.48090.315738
530.0268850.29450.384439
540.0021170.02320.490768
55-0.010624-0.11640.453772
56-0.01323-0.14490.442505
570.0116440.12750.44936
58-0.0079-0.08650.465588
59-0.022428-0.24570.403173
60-0.025411-0.27840.390605


Parameters (Session):
par1 = 60 ; par2 = 1 ; par3 = 0 ; par4 = 0 ; par5 = 12 ; par6 = White Noise ; par7 = 0.95 ;
Parameters (R input):
par1 = 60 ; par2 = 1 ; par3 = 0 ; par4 = 0 ; par5 = 12 ; par6 = White Noise ; par7 = 0.95 ; par8 = ;
R code (references can be found in the software module):
par8 <- ''
par7 <- '0.95'
par6 <- 'White Noise'
par5 <- '12'
par4 <- '0'
par3 <- '0'
par2 <- '1'
par1 <- 'Default'
if (par1 == 'Default') {
par1 = 10*log10(length(x))
} else {
par1 <- as.numeric(par1)
}
par2 <- as.numeric(par2)
par3 <- as.numeric(par3)
par4 <- as.numeric(par4)
par5 <- as.numeric(par5)
if (par6 == 'White Noise') par6 <- 'white' else par6 <- 'ma'
par7 <- as.numeric(par7)
if (par8 != '') par8 <- as.numeric(par8)
ox <- x
if (par8 == '') {
if (par2 == 0) {
x <- log(x)
} else {
x <- (x ^ par2 - 1) / par2
}
} else {
x <- log(x,base=par8)
}
if (par3 > 0) x <- diff(x,lag=1,difference=par3)
if (par4 > 0) x <- diff(x,lag=par5,difference=par4)
bitmap(file='picts.png')
op <- par(mfrow=c(2,1))
plot(ox,type='l',main='Original Time Series',xlab='time',ylab='value')
if (par8=='') {
mytitle <- paste('Working Time Series (lambda=',par2,', d=',par3,', D=',par4,')',sep='')
mysub <- paste('(lambda=',par2,', d=',par3,', D=',par4,', CI=', par7, ', CI type=',par6,')',sep='')
} else {
mytitle <- paste('Working Time Series (base=',par8,', d=',par3,', D=',par4,')',sep='')
mysub <- paste('(base=',par8,', d=',par3,', D=',par4,', CI=', par7, ', CI type=',par6,')',sep='')
}
plot(x,type='l', main=mytitle,xlab='time',ylab='value')
par(op)
dev.off()
bitmap(file='pic1.png')
racf <- acf(x, par1, main='Autocorrelation', xlab='time lag', ylab='ACF', ci.type=par6, ci=par7, sub=mysub)
dev.off()
bitmap(file='pic2.png')
rpacf <- pacf(x,par1,main='Partial Autocorrelation',xlab='lags',ylab='PACF',sub=mysub)
dev.off()
(myacf <- c(racf$acf))
(mypacf <- c(rpacf$acf))
lengthx <- length(x)
sqrtn <- sqrt(lengthx)
load(file='createtable')
a<-table.start()
a<-table.row.start(a)
a<-table.element(a,'Autocorrelation Function',4,TRUE)
a<-table.row.end(a)
a<-table.row.start(a)
a<-table.element(a,'Time lag k',header=TRUE)
a<-table.element(a,hyperlink('basics.htm','ACF(k)','click here for more information about the Autocorrelation Function'),header=TRUE)
a<-table.element(a,'T-STAT',header=TRUE)
a<-table.element(a,'P-value',header=TRUE)
a<-table.row.end(a)
for (i in 2:(par1+1)) {
a<-table.row.start(a)
a<-table.element(a,i-1,header=TRUE)
a<-table.element(a,round(myacf[i],6))
mytstat <- myacf[i]*sqrtn
a<-table.element(a,round(mytstat,4))
a<-table.element(a,round(1-pt(abs(mytstat),lengthx),6))
a<-table.row.end(a)
}
a<-table.end(a)
table.save(a,file='mytable.tab')
a<-table.start()
a<-table.row.start(a)
a<-table.element(a,'Partial Autocorrelation Function',4,TRUE)
a<-table.row.end(a)
a<-table.row.start(a)
a<-table.element(a,'Time lag k',header=TRUE)
a<-table.element(a,hyperlink('basics.htm','PACF(k)','click here for more information about the Partial Autocorrelation Function'),header=TRUE)
a<-table.element(a,'T-STAT',header=TRUE)
a<-table.element(a,'P-value',header=TRUE)
a<-table.row.end(a)
for (i in 1:par1) {
a<-table.row.start(a)
a<-table.element(a,i,header=TRUE)
a<-table.element(a,round(mypacf[i],6))
mytstat <- mypacf[i]*sqrtn
a<-table.element(a,round(mytstat,4))
a<-table.element(a,round(1-pt(abs(mytstat),lengthx),6))
a<-table.row.end(a)
}
a<-table.end(a)
table.save(a,file='mytable1.tab')