Free Statistics
of Irreproducible Research!
Description of Statistical Computation | |||||||||||||||||||||||||||||||||||||||||
|---|---|---|---|---|---|---|---|---|---|---|---|---|---|---|---|---|---|---|---|---|---|---|---|---|---|---|---|---|---|---|---|---|---|---|---|---|---|---|---|---|---|
| Author's title | |||||||||||||||||||||||||||||||||||||||||
| Author | *Unverified author* | ||||||||||||||||||||||||||||||||||||||||
| R Software Module | rwasp_univariatedataseries.wasp | ||||||||||||||||||||||||||||||||||||||||
| Title produced by software | Univariate Data Series | ||||||||||||||||||||||||||||||||||||||||
| Date of computation | Fri, 16 Aug 2013 08:50:55 -0400 | ||||||||||||||||||||||||||||||||||||||||
| Cite this page as follows | Statistical Computations at FreeStatistics.org, Office for Research Development and Education, URL https://freestatistics.org/blog/index.php?v=date/2013/Aug/16/t13766574973m0f7kx8a6kg01a.htm/, Retrieved Sat, 27 Apr 2024 23:23:48 +0000 | ||||||||||||||||||||||||||||||||||||||||
| Statistical Computations at FreeStatistics.org, Office for Research Development and Education, URL https://freestatistics.org/blog/index.php?pk=211119, Retrieved Sat, 27 Apr 2024 23:23:48 +0000 | |||||||||||||||||||||||||||||||||||||||||
| QR Codes: | |||||||||||||||||||||||||||||||||||||||||
|
| |||||||||||||||||||||||||||||||||||||||||
| Original text written by user: | |||||||||||||||||||||||||||||||||||||||||
| IsPrivate? | No (this computation is public) | ||||||||||||||||||||||||||||||||||||||||
| User-defined keywords | De Laere Dieter | ||||||||||||||||||||||||||||||||||||||||
| Estimated Impact | 210 | ||||||||||||||||||||||||||||||||||||||||
Tree of Dependent Computations | |||||||||||||||||||||||||||||||||||||||||
| Family? (F = Feedback message, R = changed R code, M = changed R Module, P = changed Parameters, D = changed Data) | |||||||||||||||||||||||||||||||||||||||||
| - [Univariate Data Series] [Tijdreeks 1 - Stap 2] [2013-08-16 12:50:55] [bc2cf5f41ec5ca561b7a550898b8dd0d] [Current] | |||||||||||||||||||||||||||||||||||||||||
| Feedback Forum | |||||||||||||||||||||||||||||||||||||||||
Post a new message | |||||||||||||||||||||||||||||||||||||||||
Dataset | |||||||||||||||||||||||||||||||||||||||||
| Dataseries X: | |||||||||||||||||||||||||||||||||||||||||
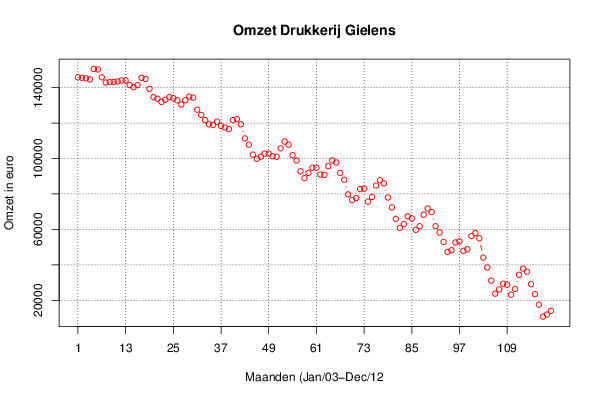
145756 145472 145160 144588 150460 150172 145756 142820 143108 143108 143392 143992 143992 141340 140172 141340 145472 144872 139288 134560 133676 131908 133104 134560 133988 132792 130456 132792 134872 134272 127492 124556 121620 119256 118972 120736 118372 117488 116604 121620 122192 119256 111304 107772 102188 99820 100988 102756 102756 101304 100988 105720 109540 107772 101872 98940 92756 88936 91872 94808 94808 90988 90704 95688 98940 97768 91872 88052 79788 76568 77736 82752 83036 75684 78336 84804 87740 85972 78024 72436 65968 60952 63004 67420 66252 59784 61836 68304 71840 69788 61836 58304 53004 47416 48300 52716 53288 47988 48872 56252 58016 55056 44168 38584 31204 23852 26216 29436 28868 23252 26500 34452 37984 36220 29152 23568 17668 10884 12084 14136 | |||||||||||||||||||||||||||||||||||||||||
Tables (Output of Computation) | |||||||||||||||||||||||||||||||||||||||||
| |||||||||||||||||||||||||||||||||||||||||
Figures (Output of Computation) | |||||||||||||||||||||||||||||||||||||||||
Input Parameters & R Code | |||||||||||||||||||||||||||||||||||||||||
| Parameters (Session): | |||||||||||||||||||||||||||||||||||||||||
| par1 = Omzet Drukkerij Gielens per maand ; par2 = niet gekend ; par3 = deze reeks geeft de omzet weer per maand in euro (Jan/03 -Dec/12 ; par4 = 12 ; | |||||||||||||||||||||||||||||||||||||||||
| Parameters (R input): | |||||||||||||||||||||||||||||||||||||||||
| par1 = Omzet Drukkerij Gielens per maand ; par2 = niet gekend ; par3 = deze reeks geeft de omzet weer per maand in euro (Jan/03 -Dec/12 ; par4 = 12 ; | |||||||||||||||||||||||||||||||||||||||||
| R code (references can be found in the software module): | |||||||||||||||||||||||||||||||||||||||||
if (par4 != 'No season') { | |||||||||||||||||||||||||||||||||||||||||