Free Statistics

of Irreproducible Research!

Author's title

Author*Unverified author*
R Software Modulerwasp_smp.wasp
Title produced by softwareStandard Deviation-Mean Plot
Date of computationFri, 16 Aug 2013 08:13:45 -0400
Cite this page as followsStatistical Computations at FreeStatistics.org, Office for Research Development and Education, URL https://freestatistics.org/blog/index.php?v=date/2013/Aug/16/t1376655252eoreae5thozp79m.htm/, Retrieved Sun, 28 Apr 2024 02:32:30 +0000
Statistical Computations at FreeStatistics.org, Office for Research Development and Education, URL https://freestatistics.org/blog/index.php?pk=211117, Retrieved Sun, 28 Apr 2024 02:32:30 +0000
QR Codes:

Original text written by user:
IsPrivate?No (this computation is public)
User-defined keywordsStefanie Gubbi
Estimated Impact165
Family? (F = Feedback message, R = changed R code, M = changed R Module, P = changed Parameters, D = changed Data)
-       [Standard Deviation-Mean Plot] [Tijdreeks 1 - Sta...] [2013-08-16 12:13:45] [3958f9c0a64aeec6b83979b094ee8a96] [Current]
Feedback Forum

Post a new message
Dataseries X:
660
770
792
693
726
814
770
737
792
693
770
847
627
704
792
693
770
770
737
836
957
737
891
891
671
660
803
693
825
847
726
869
979
748
880
946
737
671
759
748
814
836
737
825
979
803
825
1034
814
704
704
825
847
858
704
803
1067
858
792
1155
869
671
583
825
803
957
737
825
1199
913
814
1111
858
704
649
847
715
968
770
869
1254
946
693
1166
924
792
627
869
627
880
869
858
1232
935
660
1155
891
825
605
814
550
825
902
891
1199
902
693
1188


Summary of computational transaction
Raw Inputview raw input (R code)
Raw Outputview raw output of R engine
Computing time2 seconds
R Server'Gertrude Mary Cox' @ cox.wessa.net

\begin{tabular}{lllllllll}
\hline
Summary of computational transaction \tabularnewline
Raw Input & view raw input (R code)  \tabularnewline
Raw Output & view raw output of R engine  \tabularnewline
Computing time & 2 seconds \tabularnewline
R Server & 'Gertrude Mary Cox' @ cox.wessa.net \tabularnewline
\hline
\end{tabular}
%Source: https://freestatistics.org/blog/index.php?pk=211117&T=0

[TABLE]
[ROW][C]Summary of computational transaction[/C][/ROW]
[ROW][C]Raw Input[/C][C]view raw input (R code) [/C][/ROW]
[ROW][C]Raw Output[/C][C]view raw output of R engine [/C][/ROW]
[ROW][C]Computing time[/C][C]2 seconds[/C][/ROW]
[ROW][C]R Server[/C][C]'Gertrude Mary Cox' @ cox.wessa.net[/C][/ROW]
[/TABLE]
Source: https://freestatistics.org/blog/index.php?pk=211117&T=0

Globally Unique Identifier (entire table): ba.freestatistics.org/blog/index.php?pk=211117&T=0

As an alternative you can also use a QR Code:  

The GUIDs for individual cells are displayed in the table below:

Summary of computational transaction
Raw Inputview raw input (R code)
Raw Outputview raw output of R engine
Computing time2 seconds
R Server'Gertrude Mary Cox' @ cox.wessa.net


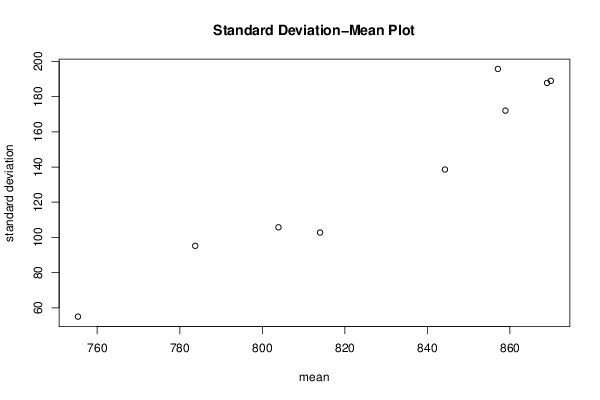
Standard Deviation-Mean Plot
SectionMeanStandard DeviationRange
1755.33333333333354.9666565595301187
2783.7595.2194833004254330
3803.916666666667105.764281935507319
4814102.761860629321363
5844.25138.595634851896451
6858.916666666667172.046747523263616
7869.916666666667188.98699249772605
8869187.792438612421605
9857.083333333333195.734726947809649

\begin{tabular}{lllllllll}
\hline
Standard Deviation-Mean Plot \tabularnewline
Section & Mean & Standard Deviation & Range \tabularnewline
1 & 755.333333333333 & 54.9666565595301 & 187 \tabularnewline
2 & 783.75 & 95.2194833004254 & 330 \tabularnewline
3 & 803.916666666667 & 105.764281935507 & 319 \tabularnewline
4 & 814 & 102.761860629321 & 363 \tabularnewline
5 & 844.25 & 138.595634851896 & 451 \tabularnewline
6 & 858.916666666667 & 172.046747523263 & 616 \tabularnewline
7 & 869.916666666667 & 188.98699249772 & 605 \tabularnewline
8 & 869 & 187.792438612421 & 605 \tabularnewline
9 & 857.083333333333 & 195.734726947809 & 649 \tabularnewline
\hline
\end{tabular}
%Source: https://freestatistics.org/blog/index.php?pk=211117&T=1

[TABLE]
[ROW][C]Standard Deviation-Mean Plot[/C][/ROW]
[ROW][C]Section[/C][C]Mean[/C][C]Standard Deviation[/C][C]Range[/C][/ROW]
[ROW][C]1[/C][C]755.333333333333[/C][C]54.9666565595301[/C][C]187[/C][/ROW]
[ROW][C]2[/C][C]783.75[/C][C]95.2194833004254[/C][C]330[/C][/ROW]
[ROW][C]3[/C][C]803.916666666667[/C][C]105.764281935507[/C][C]319[/C][/ROW]
[ROW][C]4[/C][C]814[/C][C]102.761860629321[/C][C]363[/C][/ROW]
[ROW][C]5[/C][C]844.25[/C][C]138.595634851896[/C][C]451[/C][/ROW]
[ROW][C]6[/C][C]858.916666666667[/C][C]172.046747523263[/C][C]616[/C][/ROW]
[ROW][C]7[/C][C]869.916666666667[/C][C]188.98699249772[/C][C]605[/C][/ROW]
[ROW][C]8[/C][C]869[/C][C]187.792438612421[/C][C]605[/C][/ROW]
[ROW][C]9[/C][C]857.083333333333[/C][C]195.734726947809[/C][C]649[/C][/ROW]
[/TABLE]
Source: https://freestatistics.org/blog/index.php?pk=211117&T=1

Globally Unique Identifier (entire table): ba.freestatistics.org/blog/index.php?pk=211117&T=1

As an alternative you can also use a QR Code:  

The GUIDs for individual cells are displayed in the table below:

Standard Deviation-Mean Plot
SectionMeanStandard DeviationRange
1755.33333333333354.9666565595301187
2783.7595.2194833004254330
3803.916666666667105.764281935507319
4814102.761860629321363
5844.25138.595634851896451
6858.916666666667172.046747523263616
7869.916666666667188.98699249772605
8869187.792438612421605
9857.083333333333195.734726947809649


Regression: S.E.(k) = alpha + beta * Mean(k)
alpha-849.859024811458
beta1.19238215072459
S.D.0.119900143500048
T-STAT9.94479335818402
p-value2.21891491573338e-05

\begin{tabular}{lllllllll}
\hline
Regression: S.E.(k) = alpha + beta * Mean(k) \tabularnewline
alpha & -849.859024811458 \tabularnewline
beta & 1.19238215072459 \tabularnewline
S.D. & 0.119900143500048 \tabularnewline
T-STAT & 9.94479335818402 \tabularnewline
p-value & 2.21891491573338e-05 \tabularnewline
\hline
\end{tabular}
%Source: https://freestatistics.org/blog/index.php?pk=211117&T=2

[TABLE]
[ROW][C]Regression: S.E.(k) = alpha + beta * Mean(k)[/C][/ROW]
[ROW][C]alpha[/C][C]-849.859024811458[/C][/ROW]
[ROW][C]beta[/C][C]1.19238215072459[/C][/ROW]
[ROW][C]S.D.[/C][C]0.119900143500048[/C][/ROW]
[ROW][C]T-STAT[/C][C]9.94479335818402[/C][/ROW]
[ROW][C]p-value[/C][C]2.21891491573338e-05[/C][/ROW]
[/TABLE]
Source: https://freestatistics.org/blog/index.php?pk=211117&T=2

Globally Unique Identifier (entire table): ba.freestatistics.org/blog/index.php?pk=211117&T=2

As an alternative you can also use a QR Code:  

The GUIDs for individual cells are displayed in the table below:

Regression: S.E.(k) = alpha + beta * Mean(k)
alpha-849.859024811458
beta1.19238215072459
S.D.0.119900143500048
T-STAT9.94479335818402
p-value2.21891491573338e-05


Regression: ln S.E.(k) = alpha + beta * ln Mean(k)
alpha-50.7770836716163
beta8.28039813719974
S.D.0.68996533098932
T-STAT12.0011800090401
p-value6.35411580383473e-06
Lambda-7.28039813719974

\begin{tabular}{lllllllll}
\hline
Regression: ln S.E.(k) = alpha + beta * ln Mean(k) \tabularnewline
alpha & -50.7770836716163 \tabularnewline
beta & 8.28039813719974 \tabularnewline
S.D. & 0.68996533098932 \tabularnewline
T-STAT & 12.0011800090401 \tabularnewline
p-value & 6.35411580383473e-06 \tabularnewline
Lambda & -7.28039813719974 \tabularnewline
\hline
\end{tabular}
%Source: https://freestatistics.org/blog/index.php?pk=211117&T=3

[TABLE]
[ROW][C]Regression: ln S.E.(k) = alpha + beta * ln Mean(k)[/C][/ROW]
[ROW][C]alpha[/C][C]-50.7770836716163[/C][/ROW]
[ROW][C]beta[/C][C]8.28039813719974[/C][/ROW]
[ROW][C]S.D.[/C][C]0.68996533098932[/C][/ROW]
[ROW][C]T-STAT[/C][C]12.0011800090401[/C][/ROW]
[ROW][C]p-value[/C][C]6.35411580383473e-06[/C][/ROW]
[ROW][C]Lambda[/C][C]-7.28039813719974[/C][/ROW]
[/TABLE]
Source: https://freestatistics.org/blog/index.php?pk=211117&T=3

Globally Unique Identifier (entire table): ba.freestatistics.org/blog/index.php?pk=211117&T=3

As an alternative you can also use a QR Code:  

The GUIDs for individual cells are displayed in the table below:

Regression: ln S.E.(k) = alpha + beta * ln Mean(k)
alpha-50.7770836716163
beta8.28039813719974
S.D.0.68996533098932
T-STAT12.0011800090401
p-value6.35411580383473e-06
Lambda-7.28039813719974


Parameters (Session):
par1 = 12 ;
Parameters (R input):
par1 = 12 ;
R code (references can be found in the software module):
par1 <- as.numeric(par1)
(n <- length(x))
(np <- floor(n / par1))
arr <- array(NA,dim=c(par1,np))
j <- 0
k <- 1
for (i in 1:(np*par1))
{
j = j + 1
arr[j,k] <- x[i]
if (j == par1) {
j = 0
k=k+1
}
}
arr
arr.mean <- array(NA,dim=np)
arr.sd <- array(NA,dim=np)
arr.range <- array(NA,dim=np)
for (j in 1:np)
{
arr.mean[j] <- mean(arr[,j],na.rm=TRUE)
arr.sd[j] <- sd(arr[,j],na.rm=TRUE)
arr.range[j] <- max(arr[,j],na.rm=TRUE) - min(arr[,j],na.rm=TRUE)
}
arr.mean
arr.sd
arr.range
(lm1 <- lm(arr.sd~arr.mean))
(lnlm1 <- lm(log(arr.sd)~log(arr.mean)))
(lm2 <- lm(arr.range~arr.mean))
bitmap(file='test1.png')
plot(arr.mean,arr.sd,main='Standard Deviation-Mean Plot',xlab='mean',ylab='standard deviation')
dev.off()
bitmap(file='test2.png')
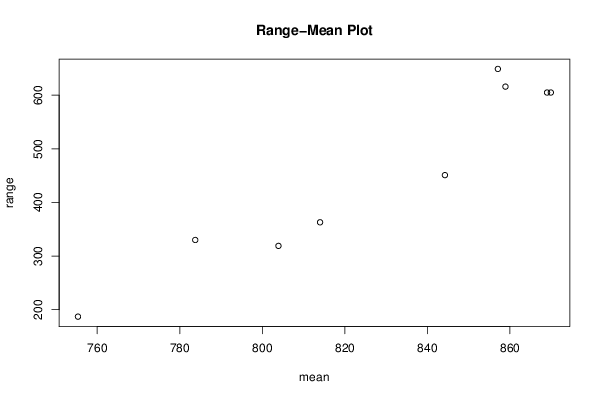
plot(arr.mean,arr.range,main='Range-Mean Plot',xlab='mean',ylab='range')
dev.off()
load(file='createtable')
a<-table.start()
a<-table.row.start(a)
a<-table.element(a,'Standard Deviation-Mean Plot',4,TRUE)
a<-table.row.end(a)
a<-table.row.start(a)
a<-table.element(a,'Section',header=TRUE)
a<-table.element(a,'Mean',header=TRUE)
a<-table.element(a,'Standard Deviation',header=TRUE)
a<-table.element(a,'Range',header=TRUE)
a<-table.row.end(a)
for (j in 1:np) {
a<-table.row.start(a)
a<-table.element(a,j,header=TRUE)
a<-table.element(a,arr.mean[j])
a<-table.element(a,arr.sd[j] )
a<-table.element(a,arr.range[j] )
a<-table.row.end(a)
}
a<-table.end(a)
table.save(a,file='mytable.tab')
a<-table.start()
a<-table.row.start(a)
a<-table.element(a,'Regression: S.E.(k) = alpha + beta * Mean(k)',2,TRUE)
a<-table.row.end(a)
a<-table.row.start(a)
a<-table.element(a,'alpha',header=TRUE)
a<-table.element(a,lm1$coefficients[[1]])
a<-table.row.end(a)
a<-table.row.start(a)
a<-table.element(a,'beta',header=TRUE)
a<-table.element(a,lm1$coefficients[[2]])
a<-table.row.end(a)
a<-table.row.start(a)
a<-table.element(a,'S.D.',header=TRUE)
a<-table.element(a,summary(lm1)$coefficients[2,2])
a<-table.row.end(a)
a<-table.row.start(a)
a<-table.element(a,'T-STAT',header=TRUE)
a<-table.element(a,summary(lm1)$coefficients[2,3])
a<-table.row.end(a)
a<-table.row.start(a)
a<-table.element(a,'p-value',header=TRUE)
a<-table.element(a,summary(lm1)$coefficients[2,4])
a<-table.row.end(a)
a<-table.end(a)
table.save(a,file='mytable1.tab')
a<-table.start()
a<-table.row.start(a)
a<-table.element(a,'Regression: ln S.E.(k) = alpha + beta * ln Mean(k)',2,TRUE)
a<-table.row.end(a)
a<-table.row.start(a)
a<-table.element(a,'alpha',header=TRUE)
a<-table.element(a,lnlm1$coefficients[[1]])
a<-table.row.end(a)
a<-table.row.start(a)
a<-table.element(a,'beta',header=TRUE)
a<-table.element(a,lnlm1$coefficients[[2]])
a<-table.row.end(a)
a<-table.row.start(a)
a<-table.element(a,'S.D.',header=TRUE)
a<-table.element(a,summary(lnlm1)$coefficients[2,2])
a<-table.row.end(a)
a<-table.row.start(a)
a<-table.element(a,'T-STAT',header=TRUE)
a<-table.element(a,summary(lnlm1)$coefficients[2,3])
a<-table.row.end(a)
a<-table.row.start(a)
a<-table.element(a,'p-value',header=TRUE)
a<-table.element(a,summary(lnlm1)$coefficients[2,4])
a<-table.row.end(a)
a<-table.row.start(a)
a<-table.element(a,'Lambda',header=TRUE)
a<-table.element(a,1-lnlm1$coefficients[[2]])
a<-table.row.end(a)
a<-table.end(a)
table.save(a,file='mytable2.tab')