Free Statistics

of Irreproducible Research!

Author's title

Author*Unverified author*
R Software Modulerwasp_fitdistrweibull.wasp
Title produced by softwareMaximum-likelihood Fitting - Weibull Distribution
Date of computationThu, 15 Aug 2013 19:55:36 -0400
Cite this page as followsStatistical Computations at FreeStatistics.org, Office for Research Development and Education, URL https://freestatistics.org/blog/index.php?v=date/2013/Aug/15/t1376611428cc2mrp93kpirtwz.htm/, Retrieved Mon, 29 Apr 2024 19:25:47 +0000
Statistical Computations at FreeStatistics.org, Office for Research Development and Education, URL https://freestatistics.org/blog/index.php?pk=211104, Retrieved Mon, 29 Apr 2024 19:25:47 +0000
QR Codes:

Original text written by user:CDPH FAA PT July 2013 data
IsPrivate?No (this computation is public)
User-defined keywords
Estimated Impact199
Family? (F = Feedback message, R = changed R code, M = changed R Module, P = changed Parameters, D = changed Data)
-       [Maximum-likelihood Fitting - Weibull Distribution] [CDPH pool 06173] [2013-08-15 23:55:36] [d41d8cd98f00b204e9800998ecf8427e] [Current]
Feedback Forum

Post a new message
Dataseries X:
0.118
0.118
0.122
0.122
0.122
0.122
0.123
0.124
0.124
0.124
0.125
0.125
0.125
0.125
0.126
0.127
0.127
0.127
0.127
0.127
0.127
0.128
0.128
0.128
0.128
0.128
0.128
0.128
0.128
0.128
0.128
0.128
0.128
0.128
0.128
0.128
0.128
0.128
0.128
0.129
0.129
0.129
0.129
0.129
0.129
0.129
0.129
0.129
0.129
0.129
0.129
0.130
0.130
0.130
0.130
0.130
0.130
0.130
0.130
0.130
0.131
0.131
0.131
0.131
0.131
0.131
0.131
0.131
0.131
0.131
0.131
0.131
0.131
0.131
0.131
0.131
0.131
0.131
0.132
0.132
0.132
0.132
0.132
0.132
0.132
0.132
0.132
0.132
0.132
0.132
0.132
0.133
0.133
0.133
0.133
0.133
0.133
0.133
0.134
0.134
0.134
0.134
0.134
0.135
0.135
0.135
0.135
0.135
0.135
0.135
0.135
0.135
0.135
0.135
0.136
0.136
0.137


Summary of computational transaction
Raw Inputview raw input (R code)
Raw Outputview raw output of R engine
Computing time2 seconds
R Server'Sir Ronald Aylmer Fisher' @ fisher.wessa.net

\begin{tabular}{lllllllll}
\hline
Summary of computational transaction \tabularnewline
Raw Input & view raw input (R code)  \tabularnewline
Raw Output & view raw output of R engine  \tabularnewline
Computing time & 2 seconds \tabularnewline
R Server & 'Sir Ronald Aylmer Fisher' @ fisher.wessa.net \tabularnewline
\hline
\end{tabular}
%Source: https://freestatistics.org/blog/index.php?pk=211104&T=0

[TABLE]
[ROW][C]Summary of computational transaction[/C][/ROW]
[ROW][C]Raw Input[/C][C]view raw input (R code) [/C][/ROW]
[ROW][C]Raw Output[/C][C]view raw output of R engine [/C][/ROW]
[ROW][C]Computing time[/C][C]2 seconds[/C][/ROW]
[ROW][C]R Server[/C][C]'Sir Ronald Aylmer Fisher' @ fisher.wessa.net[/C][/ROW]
[/TABLE]
Source: https://freestatistics.org/blog/index.php?pk=211104&T=0

Globally Unique Identifier (entire table): ba.freestatistics.org/blog/index.php?pk=211104&T=0

As an alternative you can also use a QR Code:  

The GUIDs for individual cells are displayed in the table below:

Summary of computational transaction
Raw Inputview raw input (R code)
Raw Outputview raw output of R engine
Computing time2 seconds
R Server'Sir Ronald Aylmer Fisher' @ fisher.wessa.net


ParameterEstimated ValueStandard Deviation
shape42.04790349099613.03582442479494
scale0.1315733490883190.000303273534183754

\begin{tabular}{lllllllll}
\hline
Parameter & Estimated Value & Standard Deviation \tabularnewline
shape & 42.0479034909961 & 3.03582442479494 \tabularnewline
scale & 0.131573349088319 & 0.000303273534183754 \tabularnewline
\hline
\end{tabular}
%Source: https://freestatistics.org/blog/index.php?pk=211104&T=1

[TABLE]
[ROW][C]Parameter[/C][C]Estimated Value[/C][C]Standard Deviation[/C][/ROW]
[ROW][C]shape[/C][C]42.0479034909961[/C][C]3.03582442479494[/C][/ROW]
[ROW][C]scale[/C][C]0.131573349088319[/C][C]0.000303273534183754[/C][/ROW]
[/TABLE]
Source: https://freestatistics.org/blog/index.php?pk=211104&T=1

Globally Unique Identifier (entire table): ba.freestatistics.org/blog/index.php?pk=211104&T=1

As an alternative you can also use a QR Code:  

The GUIDs for individual cells are displayed in the table below:

ParameterEstimated ValueStandard Deviation
shape42.04790349099613.03582442479494
scale0.1315733490883190.000303273534183754


Parameters (Session):
par1 = 0.00244 ; par2 = yes ; par3 = 512 ;
Parameters (R input):
par1 = 40 ; par2 = 50 ;
R code (references can be found in the software module):
library(MASS)
PPCCWeibull <- function(shape, scale, x)
{
x <- sort(x)
pp <- ppoints(x)
cor(qweibull(pp, shape=shape, scale=scale), x)
}
par1 <- as.numeric(par1)
par2 <- as.numeric(par2)
if (par1 < 0.1) par1 <- 0.1
if (par1 > 50) par1 <- 50
if (par2 < 0.1) par2 <- 0.1
if (par2 > 50) par2 <- 50
par1h <- par1*10
par2h <- par2*10
sortx <- sort(x)
c <- array(NA,dim=c(par2h))
for (i in par1h:par2h)
{
c[i] <- cor(qweibull(ppoints(x), shape=i/10,scale=2),sortx)
}
bitmap(file='test1.png')
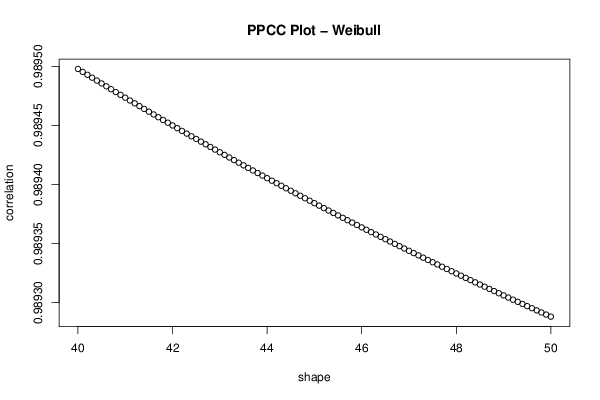
plot((par1h:par2h)/10,c[par1h:par2h],xlab='shape',ylab='correlation',main='PPCC Plot - Weibull')
dev.off()
f<-fitdistr(x, 'weibull')
f$estimate
f$sd
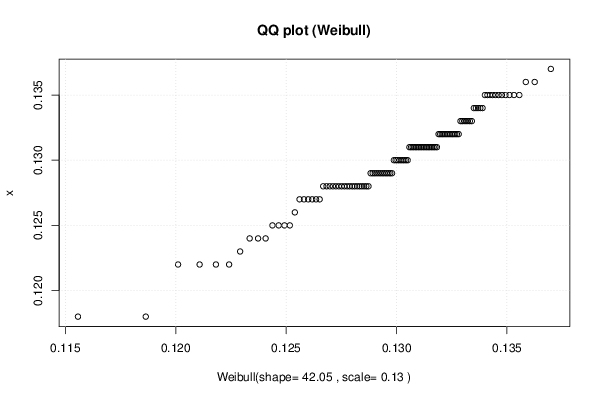
xlab <- paste('Weibull(shape=',round(f$estimate[[1]],2))
xlab <- paste(xlab,', scale=')
xlab <- paste(xlab,round(f$estimate[[2]],2))
xlab <- paste(xlab,')')
bitmap(file='test2.png')
qqplot(qweibull(ppoints(x), shape=f$estimate[[1]], scale=f$estimate[[2]]), x, main='QQ plot (Weibull)', xlab=xlab )
grid()
dev.off()
load(file='createtable')
a<-table.start()
a<-table.row.start(a)
a<-table.element(a,'Parameter',1,TRUE)
a<-table.element(a,'Estimated Value',1,TRUE)
a<-table.element(a,'Standard Deviation',1,TRUE)
a<-table.row.end(a)
a<-table.row.start(a)
a<-table.element(a,'shape',header=TRUE)
a<-table.element(a,f$estimate[1])
a<-table.element(a,f$sd[1])
a<-table.row.end(a)
a<-table.row.start(a)
a<-table.element(a,'scale',header=TRUE)
a<-table.element(a,f$estimate[2])
a<-table.element(a,f$sd[2])
a<-table.row.end(a)
a<-table.end(a)
table.save(a,file='mytable.tab')