Free Statistics

of Irreproducible Research!

Author's title

Author*Unverified author*
R Software Modulerwasp_exponentialsmoothing.wasp
Title produced by softwareExponential Smoothing
Date of computationSun, 11 Aug 2013 17:22:44 -0400
Cite this page as followsStatistical Computations at FreeStatistics.org, Office for Research Development and Education, URL https://freestatistics.org/blog/index.php?v=date/2013/Aug/11/t1376256215z1b96zviwo9b23i.htm/, Retrieved Thu, 02 May 2024 08:18:34 +0000
Statistical Computations at FreeStatistics.org, Office for Research Development and Education, URL https://freestatistics.org/blog/index.php?pk=211015, Retrieved Thu, 02 May 2024 08:18:34 +0000
QR Codes:

Original text written by user:
IsPrivate?No (this computation is public)
User-defined keywords
Estimated Impact185
Family? (F = Feedback message, R = changed R code, M = changed R Module, P = changed Parameters, D = changed Data)
-       [Exponential Smoothing] [] [2013-08-11 21:22:44] [d41d8cd98f00b204e9800998ecf8427e] [Current]
Feedback Forum

Post a new message
Dataseries X:
684.20

584.10

765.38

892.28

885.40

677.02

1006.63

1122.06

1163.39

993.20

1312.46

1545.31

1596.20

1260.41

1735.16

2029.66

2107.79

1650.30

2304.40

2639.42


Summary of computational transaction
Raw Inputview raw input (R code)
Raw Outputview raw output of R engine
Computing time3 seconds
R Server'George Udny Yule' @ yule.wessa.net
R Framework error message
Warning: there are blank lines in the 'Data' field.
Please, use NA for missing data - blank lines are simply
 deleted and are NOT treated as missing values.

\begin{tabular}{lllllllll}
\hline
Summary of computational transaction \tabularnewline
Raw Input & view raw input (R code)  \tabularnewline
Raw Output & view raw output of R engine  \tabularnewline
Computing time & 3 seconds \tabularnewline
R Server & 'George Udny Yule' @ yule.wessa.net \tabularnewline
R Framework error message & 
Warning: there are blank lines in the 'Data' field.
Please, use NA for missing data - blank lines are simply
 deleted and are NOT treated as missing values.
\tabularnewline \hline \end{tabular} %Source: https://freestatistics.org/blog/index.php?pk=211015&T=0

[TABLE]
[ROW][C]Summary of computational transaction[/C][/ROW]
[ROW][C]Raw Input[/C][C]view raw input (R code) [/C][/ROW]
[ROW][C]Raw Output[/C][C]view raw output of R engine [/C][/ROW]
[ROW][C]Computing time[/C][C]3 seconds[/C][/ROW]
[ROW][C]R Server[/C][C]'George Udny Yule' @ yule.wessa.net[/C][/ROW]
[ROW][C]R Framework error message[/C][C]
Warning: there are blank lines in the 'Data' field.
Please, use NA for missing data - blank lines are simply
 deleted and are NOT treated as missing values.
[/C][/ROW] [/TABLE] Source: https://freestatistics.org/blog/index.php?pk=211015&T=0

Globally Unique Identifier (entire table): ba.freestatistics.org/blog/index.php?pk=211015&T=0

As an alternative you can also use a QR Code:  

The GUIDs for individual cells are displayed in the table below:

Summary of computational transaction
Raw Inputview raw input (R code)
Raw Outputview raw output of R engine
Computing time3 seconds
R Server'George Udny Yule' @ yule.wessa.net
R Framework error message
Warning: there are blank lines in the 'Data' field.
Please, use NA for missing data - blank lines are simply
 deleted and are NOT treated as missing values.


Estimated Parameters of Exponential Smoothing
ParameterValue
alpha0.175201784080109
beta1
gamma1

\begin{tabular}{lllllllll}
\hline
Estimated Parameters of Exponential Smoothing \tabularnewline
Parameter & Value \tabularnewline
alpha & 0.175201784080109 \tabularnewline
beta & 1 \tabularnewline
gamma & 1 \tabularnewline
\hline
\end{tabular}
%Source: https://freestatistics.org/blog/index.php?pk=211015&T=1

[TABLE]
[ROW][C]Estimated Parameters of Exponential Smoothing[/C][/ROW]
[ROW][C]Parameter[/C][C]Value[/C][/ROW]
[ROW][C]alpha[/C][C]0.175201784080109[/C][/ROW]
[ROW][C]beta[/C][C]1[/C][/ROW]
[ROW][C]gamma[/C][C]1[/C][/ROW]
[/TABLE]
Source: https://freestatistics.org/blog/index.php?pk=211015&T=1

Globally Unique Identifier (entire table): ba.freestatistics.org/blog/index.php?pk=211015&T=1

As an alternative you can also use a QR Code:  

The GUIDs for individual cells are displayed in the table below:

Estimated Parameters of Exponential Smoothing
ParameterValue
alpha0.175201784080109
beta1
gamma1


Interpolation Forecasts of Exponential Smoothing
tObservedFittedResiduals
5885.4816.739437568.6605625000002
6677.02618.94121859188858.0787814081123
71006.63922.49830887763284.1316911223685
81122.061109.7199378081112.3400621918934
91163.391204.37040563368-40.9804056336807
10993.2998.532748568981-5.33274856898061
111312.461321.25629517464-8.79629517464036
121545.311425.48989471617119.820105283828
131596.21506.3298534737389.8701465262693
141260.411387.08224309412-126.672243094118
151735.161698.6939433484236.4660566515834
162029.661937.8739867392991.7860132607116
172107.792005.12184849325102.668151506752
181650.31727.77712657823-77.4771265782292
192304.42209.4475815634894.9524184365164
202639.422541.6327602993797.7872397006349

\begin{tabular}{lllllllll}
\hline
Interpolation Forecasts of Exponential Smoothing \tabularnewline
t & Observed & Fitted & Residuals \tabularnewline
5 & 885.4 & 816.7394375 & 68.6605625000002 \tabularnewline
6 & 677.02 & 618.941218591888 & 58.0787814081123 \tabularnewline
7 & 1006.63 & 922.498308877632 & 84.1316911223685 \tabularnewline
8 & 1122.06 & 1109.71993780811 & 12.3400621918934 \tabularnewline
9 & 1163.39 & 1204.37040563368 & -40.9804056336807 \tabularnewline
10 & 993.2 & 998.532748568981 & -5.33274856898061 \tabularnewline
11 & 1312.46 & 1321.25629517464 & -8.79629517464036 \tabularnewline
12 & 1545.31 & 1425.48989471617 & 119.820105283828 \tabularnewline
13 & 1596.2 & 1506.32985347373 & 89.8701465262693 \tabularnewline
14 & 1260.41 & 1387.08224309412 & -126.672243094118 \tabularnewline
15 & 1735.16 & 1698.69394334842 & 36.4660566515834 \tabularnewline
16 & 2029.66 & 1937.87398673929 & 91.7860132607116 \tabularnewline
17 & 2107.79 & 2005.12184849325 & 102.668151506752 \tabularnewline
18 & 1650.3 & 1727.77712657823 & -77.4771265782292 \tabularnewline
19 & 2304.4 & 2209.44758156348 & 94.9524184365164 \tabularnewline
20 & 2639.42 & 2541.63276029937 & 97.7872397006349 \tabularnewline
\hline
\end{tabular}
%Source: https://freestatistics.org/blog/index.php?pk=211015&T=2

[TABLE]
[ROW][C]Interpolation Forecasts of Exponential Smoothing[/C][/ROW]
[ROW][C]t[/C][C]Observed[/C][C]Fitted[/C][C]Residuals[/C][/ROW]
[ROW][C]5[/C][C]885.4[/C][C]816.7394375[/C][C]68.6605625000002[/C][/ROW]
[ROW][C]6[/C][C]677.02[/C][C]618.941218591888[/C][C]58.0787814081123[/C][/ROW]
[ROW][C]7[/C][C]1006.63[/C][C]922.498308877632[/C][C]84.1316911223685[/C][/ROW]
[ROW][C]8[/C][C]1122.06[/C][C]1109.71993780811[/C][C]12.3400621918934[/C][/ROW]
[ROW][C]9[/C][C]1163.39[/C][C]1204.37040563368[/C][C]-40.9804056336807[/C][/ROW]
[ROW][C]10[/C][C]993.2[/C][C]998.532748568981[/C][C]-5.33274856898061[/C][/ROW]
[ROW][C]11[/C][C]1312.46[/C][C]1321.25629517464[/C][C]-8.79629517464036[/C][/ROW]
[ROW][C]12[/C][C]1545.31[/C][C]1425.48989471617[/C][C]119.820105283828[/C][/ROW]
[ROW][C]13[/C][C]1596.2[/C][C]1506.32985347373[/C][C]89.8701465262693[/C][/ROW]
[ROW][C]14[/C][C]1260.41[/C][C]1387.08224309412[/C][C]-126.672243094118[/C][/ROW]
[ROW][C]15[/C][C]1735.16[/C][C]1698.69394334842[/C][C]36.4660566515834[/C][/ROW]
[ROW][C]16[/C][C]2029.66[/C][C]1937.87398673929[/C][C]91.7860132607116[/C][/ROW]
[ROW][C]17[/C][C]2107.79[/C][C]2005.12184849325[/C][C]102.668151506752[/C][/ROW]
[ROW][C]18[/C][C]1650.3[/C][C]1727.77712657823[/C][C]-77.4771265782292[/C][/ROW]
[ROW][C]19[/C][C]2304.4[/C][C]2209.44758156348[/C][C]94.9524184365164[/C][/ROW]
[ROW][C]20[/C][C]2639.42[/C][C]2541.63276029937[/C][C]97.7872397006349[/C][/ROW]
[/TABLE]
Source: https://freestatistics.org/blog/index.php?pk=211015&T=2

Globally Unique Identifier (entire table): ba.freestatistics.org/blog/index.php?pk=211015&T=2

As an alternative you can also use a QR Code:  

The GUIDs for individual cells are displayed in the table below:

Interpolation Forecasts of Exponential Smoothing
tObservedFittedResiduals
5885.4816.739437568.6605625000002
6677.02618.94121859188858.0787814081123
71006.63922.49830887763284.1316911223685
81122.061109.7199378081112.3400621918934
91163.391204.37040563368-40.9804056336807
10993.2998.532748568981-5.33274856898061
111312.461321.25629517464-8.79629517464036
121545.311425.48989471617119.820105283828
131596.21506.3298534737389.8701465262693
141260.411387.08224309412-126.672243094118
151735.161698.6939433484236.4660566515834
162029.661937.8739867392991.7860132607116
172107.792005.12184849325102.668151506752
181650.31727.77712657823-77.4771265782292
192304.42209.4475815634894.9524184365164
202639.422541.6327602993797.7872397006349


Extrapolation Forecasts of Exponential Smoothing
tForecast95% Lower Bound95% Upper Bound
212657.08946032192515.609136007662798.56978463614
222233.367792290522083.453204405852383.28238017518
232904.600291146342737.255700499063071.94488179362
243239.620291146343045.108034490943434.13254780173

\begin{tabular}{lllllllll}
\hline
Extrapolation Forecasts of Exponential Smoothing \tabularnewline
t & Forecast & 95% Lower Bound & 95% Upper Bound \tabularnewline
21 & 2657.0894603219 & 2515.60913600766 & 2798.56978463614 \tabularnewline
22 & 2233.36779229052 & 2083.45320440585 & 2383.28238017518 \tabularnewline
23 & 2904.60029114634 & 2737.25570049906 & 3071.94488179362 \tabularnewline
24 & 3239.62029114634 & 3045.10803449094 & 3434.13254780173 \tabularnewline
\hline
\end{tabular}
%Source: https://freestatistics.org/blog/index.php?pk=211015&T=3

[TABLE]
[ROW][C]Extrapolation Forecasts of Exponential Smoothing[/C][/ROW]
[ROW][C]t[/C][C]Forecast[/C][C]95% Lower Bound[/C][C]95% Upper Bound[/C][/ROW]
[ROW][C]21[/C][C]2657.0894603219[/C][C]2515.60913600766[/C][C]2798.56978463614[/C][/ROW]
[ROW][C]22[/C][C]2233.36779229052[/C][C]2083.45320440585[/C][C]2383.28238017518[/C][/ROW]
[ROW][C]23[/C][C]2904.60029114634[/C][C]2737.25570049906[/C][C]3071.94488179362[/C][/ROW]
[ROW][C]24[/C][C]3239.62029114634[/C][C]3045.10803449094[/C][C]3434.13254780173[/C][/ROW]
[/TABLE]
Source: https://freestatistics.org/blog/index.php?pk=211015&T=3

Globally Unique Identifier (entire table): ba.freestatistics.org/blog/index.php?pk=211015&T=3

As an alternative you can also use a QR Code:  

The GUIDs for individual cells are displayed in the table below:

Extrapolation Forecasts of Exponential Smoothing
tForecast95% Lower Bound95% Upper Bound
212657.08946032192515.609136007662798.56978463614
222233.367792290522083.453204405852383.28238017518
232904.600291146342737.255700499063071.94488179362
243239.620291146343045.108034490943434.13254780173


Parameters (Session):
par1 = 4 ; par2 = Triple ; par3 = additive ;
Parameters (R input):
par1 = 4 ; par2 = Triple ; par3 = additive ;
R code (references can be found in the software module):
par1 <- as.numeric(par1)
if (par2 == 'Single') K <- 1
if (par2 == 'Double') K <- 2
if (par2 == 'Triple') K <- par1
nx <- length(x)
nxmK <- nx - K
x <- ts(x, frequency = par1)
if (par2 == 'Single') fit <- HoltWinters(x, gamma=F, beta=F)
if (par2 == 'Double') fit <- HoltWinters(x, gamma=F)
if (par2 == 'Triple') fit <- HoltWinters(x, seasonal=par3)
fit
myresid <- x - fit$fitted[,'xhat']
bitmap(file='test1.png')
op <- par(mfrow=c(2,1))
plot(fit,ylab='Observed (black) / Fitted (red)',main='Interpolation Fit of Exponential Smoothing')
plot(myresid,ylab='Residuals',main='Interpolation Prediction Errors')
par(op)
dev.off()
bitmap(file='test2.png')
p <- predict(fit, par1, prediction.interval=TRUE)
np <- length(p[,1])
plot(fit,p,ylab='Observed (black) / Fitted (red)',main='Extrapolation Fit of Exponential Smoothing')
dev.off()
bitmap(file='test3.png')
op <- par(mfrow = c(2,2))
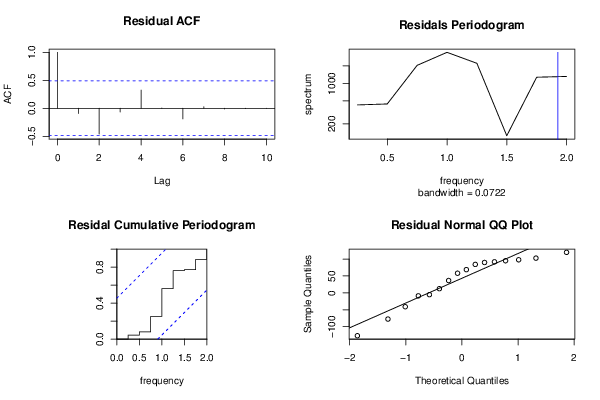
acf(as.numeric(myresid),lag.max = nx/2,main='Residual ACF')
spectrum(myresid,main='Residals Periodogram')
cpgram(myresid,main='Residal Cumulative Periodogram')
qqnorm(myresid,main='Residual Normal QQ Plot')
qqline(myresid)
par(op)
dev.off()
load(file='createtable')
a<-table.start()
a<-table.row.start(a)
a<-table.element(a,'Estimated Parameters of Exponential Smoothing',2,TRUE)
a<-table.row.end(a)
a<-table.row.start(a)
a<-table.element(a,'Parameter',header=TRUE)
a<-table.element(a,'Value',header=TRUE)
a<-table.row.end(a)
a<-table.row.start(a)
a<-table.element(a,'alpha',header=TRUE)
a<-table.element(a,fit$alpha)
a<-table.row.end(a)
a<-table.row.start(a)
a<-table.element(a,'beta',header=TRUE)
a<-table.element(a,fit$beta)
a<-table.row.end(a)
a<-table.row.start(a)
a<-table.element(a,'gamma',header=TRUE)
a<-table.element(a,fit$gamma)
a<-table.row.end(a)
a<-table.end(a)
table.save(a,file='mytable.tab')
a<-table.start()
a<-table.row.start(a)
a<-table.element(a,'Interpolation Forecasts of Exponential Smoothing',4,TRUE)
a<-table.row.end(a)
a<-table.row.start(a)
a<-table.element(a,'t',header=TRUE)
a<-table.element(a,'Observed',header=TRUE)
a<-table.element(a,'Fitted',header=TRUE)
a<-table.element(a,'Residuals',header=TRUE)
a<-table.row.end(a)
for (i in 1:nxmK) {
a<-table.row.start(a)
a<-table.element(a,i+K,header=TRUE)
a<-table.element(a,x[i+K])
a<-table.element(a,fit$fitted[i,'xhat'])
a<-table.element(a,myresid[i])
a<-table.row.end(a)
}
a<-table.end(a)
table.save(a,file='mytable1.tab')
a<-table.start()
a<-table.row.start(a)
a<-table.element(a,'Extrapolation Forecasts of Exponential Smoothing',4,TRUE)
a<-table.row.end(a)
a<-table.row.start(a)
a<-table.element(a,'t',header=TRUE)
a<-table.element(a,'Forecast',header=TRUE)
a<-table.element(a,'95% Lower Bound',header=TRUE)
a<-table.element(a,'95% Upper Bound',header=TRUE)
a<-table.row.end(a)
for (i in 1:np) {
a<-table.row.start(a)
a<-table.element(a,nx+i,header=TRUE)
a<-table.element(a,p[i,'fit'])
a<-table.element(a,p[i,'lwr'])
a<-table.element(a,p[i,'upr'])
a<-table.row.end(a)
}
a<-table.end(a)
table.save(a,file='mytable2.tab')