Free Statistics

of Irreproducible Research!

Author's title

Author*Unverified author*
R Software Modulerwasp_autocorrelation.wasp
Title produced by software(Partial) Autocorrelation Function
Date of computationTue, 06 Aug 2013 10:29:35 -0400
Cite this page as followsStatistical Computations at FreeStatistics.org, Office for Research Development and Education, URL https://freestatistics.org/blog/index.php?v=date/2013/Aug/06/t1375799404rdt7ieid44iphto.htm/, Retrieved Mon, 29 Apr 2024 04:48:23 +0000
Statistical Computations at FreeStatistics.org, Office for Research Development and Education, URL https://freestatistics.org/blog/index.php?pk=210967, Retrieved Mon, 29 Apr 2024 04:48:23 +0000
QR Codes:

Original text written by user:
IsPrivate?No (this computation is public)
User-defined keywordsNick Hollevoet
Estimated Impact152
Family? (F = Feedback message, R = changed R code, M = changed R Module, P = changed Parameters, D = changed Data)
-       [(Partial) Autocorrelation Function] [TIJDREEKS (A) - S...] [2013-08-06 14:29:35] [3f9aa5867cfe47c4a12580af2904c765] [Current]
Feedback Forum

Post a new message
Dataseries X:
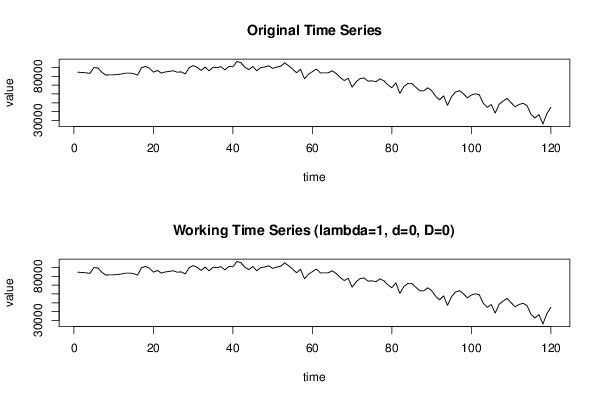
84728
84412
84092
83430
89981
89635
84728
81466
81781
81781
82133
82764
83746
83746
83115
81466
89981
91279
89319
84728
86692
83746
85075
85710
86372
84728
85075
82764
89981
92261
90301
86692
90617
86372
90301
89981
90964
87355
91279
90964
96852
95523
90301
87670
91279
86372
89981
90617
91946
89004
90617
91599
95208
92261
88337
84092
88021
77221
82448
85390
88337
84092
84092
84092
86372
83115
78839
75261
77857
67724
73933
77541
78204
74595
74910
73933
77221
74910
70355
67062
72630
60537
68390
71968
71968
67724
63799
63484
67062
63799
57595
53319
57911
47115
56928
62150
63799
60191
55631
58893
60191
59208
49391
44835
48093
38280
48413
52022
54964
50057
45466
48093
49391
46795
36982
32706
36631
25835
37613
44835


Summary of computational transaction
Raw Inputview raw input (R code)
Raw Outputview raw output of R engine
Computing time3 seconds
R Server'Herman Ole Andreas Wold' @ wold.wessa.net

\begin{tabular}{lllllllll}
\hline
Summary of computational transaction \tabularnewline
Raw Input & view raw input (R code)  \tabularnewline
Raw Output & view raw output of R engine  \tabularnewline
Computing time & 3 seconds \tabularnewline
R Server & 'Herman Ole Andreas Wold' @ wold.wessa.net \tabularnewline
\hline
\end{tabular}
%Source: https://freestatistics.org/blog/index.php?pk=210967&T=0

[TABLE]
[ROW][C]Summary of computational transaction[/C][/ROW]
[ROW][C]Raw Input[/C][C]view raw input (R code) [/C][/ROW]
[ROW][C]Raw Output[/C][C]view raw output of R engine [/C][/ROW]
[ROW][C]Computing time[/C][C]3 seconds[/C][/ROW]
[ROW][C]R Server[/C][C]'Herman Ole Andreas Wold' @ wold.wessa.net[/C][/ROW]
[/TABLE]
Source: https://freestatistics.org/blog/index.php?pk=210967&T=0

Globally Unique Identifier (entire table): ba.freestatistics.org/blog/index.php?pk=210967&T=0

As an alternative you can also use a QR Code:  

The GUIDs for individual cells are displayed in the table below:

Summary of computational transaction
Raw Inputview raw input (R code)
Raw Outputview raw output of R engine
Computing time3 seconds
R Server'Herman Ole Andreas Wold' @ wold.wessa.net


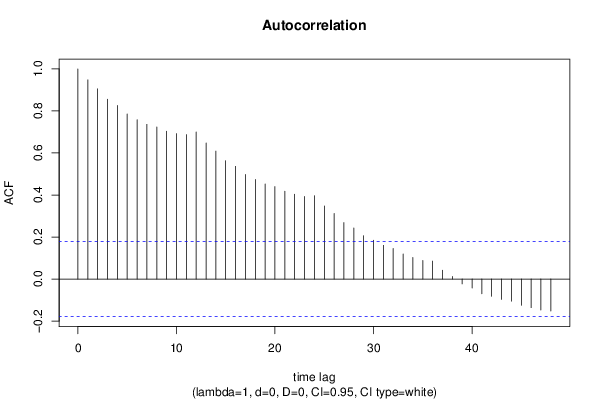
Autocorrelation Function
Time lag kACF(k)T-STATP-value
10.94790210.38380
20.9052679.91670
30.8557289.3740
40.8262069.05060
50.7856798.60670
60.7579668.30310
70.7361888.06450
80.7236547.92720
90.7031827.7030
100.6921027.58160
110.687577.5320
120.7001327.66960
130.6479597.0980
140.6088366.66950
150.5635116.17290
160.5363625.87560
170.4979725.4550
180.4738345.19060
190.452694.9591e-06
200.440014.82012e-06
210.4182934.58226e-06
220.4033964.4191.1e-05
230.3933264.30871.7e-05
240.39694.34781.4e-05
250.3480763.8130.000109
260.3117643.41520.000435
270.2687162.94360.001948
280.2433612.66590.004368
290.2063782.26080.012788
300.1844192.02020.022794
310.1603371.75640.040785
320.145281.59150.057068
330.1190311.30390.097379
340.1022811.12040.132383
350.0881910.96610.167972
360.0855670.93730.175235
370.0421540.46180.322539
380.0125280.13720.445537
39-0.023121-0.25330.400244
40-0.042346-0.46390.321788
41-0.070055-0.76740.222172
42-0.081845-0.89660.185873
43-0.096617-1.05840.146002
44-0.105098-1.15130.125951
45-0.124959-1.36890.086801
46-0.136032-1.49020.069403
47-0.147632-1.61720.054227
48-0.152256-1.66790.048974

\begin{tabular}{lllllllll}
\hline
Autocorrelation Function \tabularnewline
Time lag k & ACF(k) & T-STAT & P-value \tabularnewline
1 & 0.947902 & 10.3838 & 0 \tabularnewline
2 & 0.905267 & 9.9167 & 0 \tabularnewline
3 & 0.855728 & 9.374 & 0 \tabularnewline
4 & 0.826206 & 9.0506 & 0 \tabularnewline
5 & 0.785679 & 8.6067 & 0 \tabularnewline
6 & 0.757966 & 8.3031 & 0 \tabularnewline
7 & 0.736188 & 8.0645 & 0 \tabularnewline
8 & 0.723654 & 7.9272 & 0 \tabularnewline
9 & 0.703182 & 7.703 & 0 \tabularnewline
10 & 0.692102 & 7.5816 & 0 \tabularnewline
11 & 0.68757 & 7.532 & 0 \tabularnewline
12 & 0.700132 & 7.6696 & 0 \tabularnewline
13 & 0.647959 & 7.098 & 0 \tabularnewline
14 & 0.608836 & 6.6695 & 0 \tabularnewline
15 & 0.563511 & 6.1729 & 0 \tabularnewline
16 & 0.536362 & 5.8756 & 0 \tabularnewline
17 & 0.497972 & 5.455 & 0 \tabularnewline
18 & 0.473834 & 5.1906 & 0 \tabularnewline
19 & 0.45269 & 4.959 & 1e-06 \tabularnewline
20 & 0.44001 & 4.8201 & 2e-06 \tabularnewline
21 & 0.418293 & 4.5822 & 6e-06 \tabularnewline
22 & 0.403396 & 4.419 & 1.1e-05 \tabularnewline
23 & 0.393326 & 4.3087 & 1.7e-05 \tabularnewline
24 & 0.3969 & 4.3478 & 1.4e-05 \tabularnewline
25 & 0.348076 & 3.813 & 0.000109 \tabularnewline
26 & 0.311764 & 3.4152 & 0.000435 \tabularnewline
27 & 0.268716 & 2.9436 & 0.001948 \tabularnewline
28 & 0.243361 & 2.6659 & 0.004368 \tabularnewline
29 & 0.206378 & 2.2608 & 0.012788 \tabularnewline
30 & 0.184419 & 2.0202 & 0.022794 \tabularnewline
31 & 0.160337 & 1.7564 & 0.040785 \tabularnewline
32 & 0.14528 & 1.5915 & 0.057068 \tabularnewline
33 & 0.119031 & 1.3039 & 0.097379 \tabularnewline
34 & 0.102281 & 1.1204 & 0.132383 \tabularnewline
35 & 0.088191 & 0.9661 & 0.167972 \tabularnewline
36 & 0.085567 & 0.9373 & 0.175235 \tabularnewline
37 & 0.042154 & 0.4618 & 0.322539 \tabularnewline
38 & 0.012528 & 0.1372 & 0.445537 \tabularnewline
39 & -0.023121 & -0.2533 & 0.400244 \tabularnewline
40 & -0.042346 & -0.4639 & 0.321788 \tabularnewline
41 & -0.070055 & -0.7674 & 0.222172 \tabularnewline
42 & -0.081845 & -0.8966 & 0.185873 \tabularnewline
43 & -0.096617 & -1.0584 & 0.146002 \tabularnewline
44 & -0.105098 & -1.1513 & 0.125951 \tabularnewline
45 & -0.124959 & -1.3689 & 0.086801 \tabularnewline
46 & -0.136032 & -1.4902 & 0.069403 \tabularnewline
47 & -0.147632 & -1.6172 & 0.054227 \tabularnewline
48 & -0.152256 & -1.6679 & 0.048974 \tabularnewline
\hline
\end{tabular}
%Source: https://freestatistics.org/blog/index.php?pk=210967&T=1

[TABLE]
[ROW][C]Autocorrelation Function[/C][/ROW]
[ROW][C]Time lag k[/C][C]ACF(k)[/C][C]T-STAT[/C][C]P-value[/C][/ROW]
[ROW][C]1[/C][C]0.947902[/C][C]10.3838[/C][C]0[/C][/ROW]
[ROW][C]2[/C][C]0.905267[/C][C]9.9167[/C][C]0[/C][/ROW]
[ROW][C]3[/C][C]0.855728[/C][C]9.374[/C][C]0[/C][/ROW]
[ROW][C]4[/C][C]0.826206[/C][C]9.0506[/C][C]0[/C][/ROW]
[ROW][C]5[/C][C]0.785679[/C][C]8.6067[/C][C]0[/C][/ROW]
[ROW][C]6[/C][C]0.757966[/C][C]8.3031[/C][C]0[/C][/ROW]
[ROW][C]7[/C][C]0.736188[/C][C]8.0645[/C][C]0[/C][/ROW]
[ROW][C]8[/C][C]0.723654[/C][C]7.9272[/C][C]0[/C][/ROW]
[ROW][C]9[/C][C]0.703182[/C][C]7.703[/C][C]0[/C][/ROW]
[ROW][C]10[/C][C]0.692102[/C][C]7.5816[/C][C]0[/C][/ROW]
[ROW][C]11[/C][C]0.68757[/C][C]7.532[/C][C]0[/C][/ROW]
[ROW][C]12[/C][C]0.700132[/C][C]7.6696[/C][C]0[/C][/ROW]
[ROW][C]13[/C][C]0.647959[/C][C]7.098[/C][C]0[/C][/ROW]
[ROW][C]14[/C][C]0.608836[/C][C]6.6695[/C][C]0[/C][/ROW]
[ROW][C]15[/C][C]0.563511[/C][C]6.1729[/C][C]0[/C][/ROW]
[ROW][C]16[/C][C]0.536362[/C][C]5.8756[/C][C]0[/C][/ROW]
[ROW][C]17[/C][C]0.497972[/C][C]5.455[/C][C]0[/C][/ROW]
[ROW][C]18[/C][C]0.473834[/C][C]5.1906[/C][C]0[/C][/ROW]
[ROW][C]19[/C][C]0.45269[/C][C]4.959[/C][C]1e-06[/C][/ROW]
[ROW][C]20[/C][C]0.44001[/C][C]4.8201[/C][C]2e-06[/C][/ROW]
[ROW][C]21[/C][C]0.418293[/C][C]4.5822[/C][C]6e-06[/C][/ROW]
[ROW][C]22[/C][C]0.403396[/C][C]4.419[/C][C]1.1e-05[/C][/ROW]
[ROW][C]23[/C][C]0.393326[/C][C]4.3087[/C][C]1.7e-05[/C][/ROW]
[ROW][C]24[/C][C]0.3969[/C][C]4.3478[/C][C]1.4e-05[/C][/ROW]
[ROW][C]25[/C][C]0.348076[/C][C]3.813[/C][C]0.000109[/C][/ROW]
[ROW][C]26[/C][C]0.311764[/C][C]3.4152[/C][C]0.000435[/C][/ROW]
[ROW][C]27[/C][C]0.268716[/C][C]2.9436[/C][C]0.001948[/C][/ROW]
[ROW][C]28[/C][C]0.243361[/C][C]2.6659[/C][C]0.004368[/C][/ROW]
[ROW][C]29[/C][C]0.206378[/C][C]2.2608[/C][C]0.012788[/C][/ROW]
[ROW][C]30[/C][C]0.184419[/C][C]2.0202[/C][C]0.022794[/C][/ROW]
[ROW][C]31[/C][C]0.160337[/C][C]1.7564[/C][C]0.040785[/C][/ROW]
[ROW][C]32[/C][C]0.14528[/C][C]1.5915[/C][C]0.057068[/C][/ROW]
[ROW][C]33[/C][C]0.119031[/C][C]1.3039[/C][C]0.097379[/C][/ROW]
[ROW][C]34[/C][C]0.102281[/C][C]1.1204[/C][C]0.132383[/C][/ROW]
[ROW][C]35[/C][C]0.088191[/C][C]0.9661[/C][C]0.167972[/C][/ROW]
[ROW][C]36[/C][C]0.085567[/C][C]0.9373[/C][C]0.175235[/C][/ROW]
[ROW][C]37[/C][C]0.042154[/C][C]0.4618[/C][C]0.322539[/C][/ROW]
[ROW][C]38[/C][C]0.012528[/C][C]0.1372[/C][C]0.445537[/C][/ROW]
[ROW][C]39[/C][C]-0.023121[/C][C]-0.2533[/C][C]0.400244[/C][/ROW]
[ROW][C]40[/C][C]-0.042346[/C][C]-0.4639[/C][C]0.321788[/C][/ROW]
[ROW][C]41[/C][C]-0.070055[/C][C]-0.7674[/C][C]0.222172[/C][/ROW]
[ROW][C]42[/C][C]-0.081845[/C][C]-0.8966[/C][C]0.185873[/C][/ROW]
[ROW][C]43[/C][C]-0.096617[/C][C]-1.0584[/C][C]0.146002[/C][/ROW]
[ROW][C]44[/C][C]-0.105098[/C][C]-1.1513[/C][C]0.125951[/C][/ROW]
[ROW][C]45[/C][C]-0.124959[/C][C]-1.3689[/C][C]0.086801[/C][/ROW]
[ROW][C]46[/C][C]-0.136032[/C][C]-1.4902[/C][C]0.069403[/C][/ROW]
[ROW][C]47[/C][C]-0.147632[/C][C]-1.6172[/C][C]0.054227[/C][/ROW]
[ROW][C]48[/C][C]-0.152256[/C][C]-1.6679[/C][C]0.048974[/C][/ROW]
[/TABLE]
Source: https://freestatistics.org/blog/index.php?pk=210967&T=1

Globally Unique Identifier (entire table): ba.freestatistics.org/blog/index.php?pk=210967&T=1

As an alternative you can also use a QR Code:  

The GUIDs for individual cells are displayed in the table below:

Autocorrelation Function
Time lag kACF(k)T-STATP-value
10.94790210.38380
20.9052679.91670
30.8557289.3740
40.8262069.05060
50.7856798.60670
60.7579668.30310
70.7361888.06450
80.7236547.92720
90.7031827.7030
100.6921027.58160
110.687577.5320
120.7001327.66960
130.6479597.0980
140.6088366.66950
150.5635116.17290
160.5363625.87560
170.4979725.4550
180.4738345.19060
190.452694.9591e-06
200.440014.82012e-06
210.4182934.58226e-06
220.4033964.4191.1e-05
230.3933264.30871.7e-05
240.39694.34781.4e-05
250.3480763.8130.000109
260.3117643.41520.000435
270.2687162.94360.001948
280.2433612.66590.004368
290.2063782.26080.012788
300.1844192.02020.022794
310.1603371.75640.040785
320.145281.59150.057068
330.1190311.30390.097379
340.1022811.12040.132383
350.0881910.96610.167972
360.0855670.93730.175235
370.0421540.46180.322539
380.0125280.13720.445537
39-0.023121-0.25330.400244
40-0.042346-0.46390.321788
41-0.070055-0.76740.222172
42-0.081845-0.89660.185873
43-0.096617-1.05840.146002
44-0.105098-1.15130.125951
45-0.124959-1.36890.086801
46-0.136032-1.49020.069403
47-0.147632-1.61720.054227
48-0.152256-1.66790.048974


Partial Autocorrelation Function
Time lag kPACF(k)T-STATP-value
10.94790210.38380
20.0664960.72840.233887
3-0.082621-0.90510.183622
40.1617691.77210.039458
5-0.095015-1.04080.150023
60.0752230.8240.20578
70.1033751.13240.129859
80.0490820.53770.295902
9-0.040351-0.4420.329636
100.0882740.9670.167746
110.1023961.12170.132117
120.1708671.87180.031838
13-0.617558-6.7650
140.1401071.53480.063734
150.0791210.86670.19391
16-0.101808-1.11530.133485
170.0628860.68890.246112
180.0384250.42090.337281
19-0.041022-0.44940.326985
200.0265220.29050.385953
21-0.026511-0.29040.386002
220.0847460.92830.177546
23-0.085819-0.94010.174529
24-0.059761-0.65460.256975
25-0.132118-1.44730.075214
260.0095750.10490.458322
270.0063870.070.472168
28-0.014106-0.15450.438728
29-0.004646-0.05090.479749
300.005710.06250.475116
31-0.091581-1.00320.158886
320.03360.36810.356734
33-0.043554-0.47710.317077
340.0585110.6410.261386
35-0.071717-0.78560.216819
36-0.075134-0.82310.206056
370.014540.15930.43686
380.0072950.07990.468222
39-0.021744-0.23820.406069
400.0172860.18940.425067
410.0142440.1560.438135
420.0038590.04230.483174
43-0.029039-0.31810.375481
44-0.021887-0.23980.405463
450.0166630.18250.427737
46-0.028074-0.30750.379485
47-0.067426-0.73860.230791
48-0.046565-0.51010.305463

\begin{tabular}{lllllllll}
\hline
Partial Autocorrelation Function \tabularnewline
Time lag k & PACF(k) & T-STAT & P-value \tabularnewline
1 & 0.947902 & 10.3838 & 0 \tabularnewline
2 & 0.066496 & 0.7284 & 0.233887 \tabularnewline
3 & -0.082621 & -0.9051 & 0.183622 \tabularnewline
4 & 0.161769 & 1.7721 & 0.039458 \tabularnewline
5 & -0.095015 & -1.0408 & 0.150023 \tabularnewline
6 & 0.075223 & 0.824 & 0.20578 \tabularnewline
7 & 0.103375 & 1.1324 & 0.129859 \tabularnewline
8 & 0.049082 & 0.5377 & 0.295902 \tabularnewline
9 & -0.040351 & -0.442 & 0.329636 \tabularnewline
10 & 0.088274 & 0.967 & 0.167746 \tabularnewline
11 & 0.102396 & 1.1217 & 0.132117 \tabularnewline
12 & 0.170867 & 1.8718 & 0.031838 \tabularnewline
13 & -0.617558 & -6.765 & 0 \tabularnewline
14 & 0.140107 & 1.5348 & 0.063734 \tabularnewline
15 & 0.079121 & 0.8667 & 0.19391 \tabularnewline
16 & -0.101808 & -1.1153 & 0.133485 \tabularnewline
17 & 0.062886 & 0.6889 & 0.246112 \tabularnewline
18 & 0.038425 & 0.4209 & 0.337281 \tabularnewline
19 & -0.041022 & -0.4494 & 0.326985 \tabularnewline
20 & 0.026522 & 0.2905 & 0.385953 \tabularnewline
21 & -0.026511 & -0.2904 & 0.386002 \tabularnewline
22 & 0.084746 & 0.9283 & 0.177546 \tabularnewline
23 & -0.085819 & -0.9401 & 0.174529 \tabularnewline
24 & -0.059761 & -0.6546 & 0.256975 \tabularnewline
25 & -0.132118 & -1.4473 & 0.075214 \tabularnewline
26 & 0.009575 & 0.1049 & 0.458322 \tabularnewline
27 & 0.006387 & 0.07 & 0.472168 \tabularnewline
28 & -0.014106 & -0.1545 & 0.438728 \tabularnewline
29 & -0.004646 & -0.0509 & 0.479749 \tabularnewline
30 & 0.00571 & 0.0625 & 0.475116 \tabularnewline
31 & -0.091581 & -1.0032 & 0.158886 \tabularnewline
32 & 0.0336 & 0.3681 & 0.356734 \tabularnewline
33 & -0.043554 & -0.4771 & 0.317077 \tabularnewline
34 & 0.058511 & 0.641 & 0.261386 \tabularnewline
35 & -0.071717 & -0.7856 & 0.216819 \tabularnewline
36 & -0.075134 & -0.8231 & 0.206056 \tabularnewline
37 & 0.01454 & 0.1593 & 0.43686 \tabularnewline
38 & 0.007295 & 0.0799 & 0.468222 \tabularnewline
39 & -0.021744 & -0.2382 & 0.406069 \tabularnewline
40 & 0.017286 & 0.1894 & 0.425067 \tabularnewline
41 & 0.014244 & 0.156 & 0.438135 \tabularnewline
42 & 0.003859 & 0.0423 & 0.483174 \tabularnewline
43 & -0.029039 & -0.3181 & 0.375481 \tabularnewline
44 & -0.021887 & -0.2398 & 0.405463 \tabularnewline
45 & 0.016663 & 0.1825 & 0.427737 \tabularnewline
46 & -0.028074 & -0.3075 & 0.379485 \tabularnewline
47 & -0.067426 & -0.7386 & 0.230791 \tabularnewline
48 & -0.046565 & -0.5101 & 0.305463 \tabularnewline
\hline
\end{tabular}
%Source: https://freestatistics.org/blog/index.php?pk=210967&T=2

[TABLE]
[ROW][C]Partial Autocorrelation Function[/C][/ROW]
[ROW][C]Time lag k[/C][C]PACF(k)[/C][C]T-STAT[/C][C]P-value[/C][/ROW]
[ROW][C]1[/C][C]0.947902[/C][C]10.3838[/C][C]0[/C][/ROW]
[ROW][C]2[/C][C]0.066496[/C][C]0.7284[/C][C]0.233887[/C][/ROW]
[ROW][C]3[/C][C]-0.082621[/C][C]-0.9051[/C][C]0.183622[/C][/ROW]
[ROW][C]4[/C][C]0.161769[/C][C]1.7721[/C][C]0.039458[/C][/ROW]
[ROW][C]5[/C][C]-0.095015[/C][C]-1.0408[/C][C]0.150023[/C][/ROW]
[ROW][C]6[/C][C]0.075223[/C][C]0.824[/C][C]0.20578[/C][/ROW]
[ROW][C]7[/C][C]0.103375[/C][C]1.1324[/C][C]0.129859[/C][/ROW]
[ROW][C]8[/C][C]0.049082[/C][C]0.5377[/C][C]0.295902[/C][/ROW]
[ROW][C]9[/C][C]-0.040351[/C][C]-0.442[/C][C]0.329636[/C][/ROW]
[ROW][C]10[/C][C]0.088274[/C][C]0.967[/C][C]0.167746[/C][/ROW]
[ROW][C]11[/C][C]0.102396[/C][C]1.1217[/C][C]0.132117[/C][/ROW]
[ROW][C]12[/C][C]0.170867[/C][C]1.8718[/C][C]0.031838[/C][/ROW]
[ROW][C]13[/C][C]-0.617558[/C][C]-6.765[/C][C]0[/C][/ROW]
[ROW][C]14[/C][C]0.140107[/C][C]1.5348[/C][C]0.063734[/C][/ROW]
[ROW][C]15[/C][C]0.079121[/C][C]0.8667[/C][C]0.19391[/C][/ROW]
[ROW][C]16[/C][C]-0.101808[/C][C]-1.1153[/C][C]0.133485[/C][/ROW]
[ROW][C]17[/C][C]0.062886[/C][C]0.6889[/C][C]0.246112[/C][/ROW]
[ROW][C]18[/C][C]0.038425[/C][C]0.4209[/C][C]0.337281[/C][/ROW]
[ROW][C]19[/C][C]-0.041022[/C][C]-0.4494[/C][C]0.326985[/C][/ROW]
[ROW][C]20[/C][C]0.026522[/C][C]0.2905[/C][C]0.385953[/C][/ROW]
[ROW][C]21[/C][C]-0.026511[/C][C]-0.2904[/C][C]0.386002[/C][/ROW]
[ROW][C]22[/C][C]0.084746[/C][C]0.9283[/C][C]0.177546[/C][/ROW]
[ROW][C]23[/C][C]-0.085819[/C][C]-0.9401[/C][C]0.174529[/C][/ROW]
[ROW][C]24[/C][C]-0.059761[/C][C]-0.6546[/C][C]0.256975[/C][/ROW]
[ROW][C]25[/C][C]-0.132118[/C][C]-1.4473[/C][C]0.075214[/C][/ROW]
[ROW][C]26[/C][C]0.009575[/C][C]0.1049[/C][C]0.458322[/C][/ROW]
[ROW][C]27[/C][C]0.006387[/C][C]0.07[/C][C]0.472168[/C][/ROW]
[ROW][C]28[/C][C]-0.014106[/C][C]-0.1545[/C][C]0.438728[/C][/ROW]
[ROW][C]29[/C][C]-0.004646[/C][C]-0.0509[/C][C]0.479749[/C][/ROW]
[ROW][C]30[/C][C]0.00571[/C][C]0.0625[/C][C]0.475116[/C][/ROW]
[ROW][C]31[/C][C]-0.091581[/C][C]-1.0032[/C][C]0.158886[/C][/ROW]
[ROW][C]32[/C][C]0.0336[/C][C]0.3681[/C][C]0.356734[/C][/ROW]
[ROW][C]33[/C][C]-0.043554[/C][C]-0.4771[/C][C]0.317077[/C][/ROW]
[ROW][C]34[/C][C]0.058511[/C][C]0.641[/C][C]0.261386[/C][/ROW]
[ROW][C]35[/C][C]-0.071717[/C][C]-0.7856[/C][C]0.216819[/C][/ROW]
[ROW][C]36[/C][C]-0.075134[/C][C]-0.8231[/C][C]0.206056[/C][/ROW]
[ROW][C]37[/C][C]0.01454[/C][C]0.1593[/C][C]0.43686[/C][/ROW]
[ROW][C]38[/C][C]0.007295[/C][C]0.0799[/C][C]0.468222[/C][/ROW]
[ROW][C]39[/C][C]-0.021744[/C][C]-0.2382[/C][C]0.406069[/C][/ROW]
[ROW][C]40[/C][C]0.017286[/C][C]0.1894[/C][C]0.425067[/C][/ROW]
[ROW][C]41[/C][C]0.014244[/C][C]0.156[/C][C]0.438135[/C][/ROW]
[ROW][C]42[/C][C]0.003859[/C][C]0.0423[/C][C]0.483174[/C][/ROW]
[ROW][C]43[/C][C]-0.029039[/C][C]-0.3181[/C][C]0.375481[/C][/ROW]
[ROW][C]44[/C][C]-0.021887[/C][C]-0.2398[/C][C]0.405463[/C][/ROW]
[ROW][C]45[/C][C]0.016663[/C][C]0.1825[/C][C]0.427737[/C][/ROW]
[ROW][C]46[/C][C]-0.028074[/C][C]-0.3075[/C][C]0.379485[/C][/ROW]
[ROW][C]47[/C][C]-0.067426[/C][C]-0.7386[/C][C]0.230791[/C][/ROW]
[ROW][C]48[/C][C]-0.046565[/C][C]-0.5101[/C][C]0.305463[/C][/ROW]
[/TABLE]
Source: https://freestatistics.org/blog/index.php?pk=210967&T=2

Globally Unique Identifier (entire table): ba.freestatistics.org/blog/index.php?pk=210967&T=2

As an alternative you can also use a QR Code:  

The GUIDs for individual cells are displayed in the table below:

Partial Autocorrelation Function
Time lag kPACF(k)T-STATP-value
10.94790210.38380
20.0664960.72840.233887
3-0.082621-0.90510.183622
40.1617691.77210.039458
5-0.095015-1.04080.150023
60.0752230.8240.20578
70.1033751.13240.129859
80.0490820.53770.295902
9-0.040351-0.4420.329636
100.0882740.9670.167746
110.1023961.12170.132117
120.1708671.87180.031838
13-0.617558-6.7650
140.1401071.53480.063734
150.0791210.86670.19391
16-0.101808-1.11530.133485
170.0628860.68890.246112
180.0384250.42090.337281
19-0.041022-0.44940.326985
200.0265220.29050.385953
21-0.026511-0.29040.386002
220.0847460.92830.177546
23-0.085819-0.94010.174529
24-0.059761-0.65460.256975
25-0.132118-1.44730.075214
260.0095750.10490.458322
270.0063870.070.472168
28-0.014106-0.15450.438728
29-0.004646-0.05090.479749
300.005710.06250.475116
31-0.091581-1.00320.158886
320.03360.36810.356734
33-0.043554-0.47710.317077
340.0585110.6410.261386
35-0.071717-0.78560.216819
36-0.075134-0.82310.206056
370.014540.15930.43686
380.0072950.07990.468222
39-0.021744-0.23820.406069
400.0172860.18940.425067
410.0142440.1560.438135
420.0038590.04230.483174
43-0.029039-0.31810.375481
44-0.021887-0.23980.405463
450.0166630.18250.427737
46-0.028074-0.30750.379485
47-0.067426-0.73860.230791
48-0.046565-0.51010.305463


Parameters (Session):
par1 = 48 ; par2 = 1 ; par3 = 0 ; par4 = 0 ; par5 = 12 ; par6 = White Noise ; par7 = 0.95 ;
Parameters (R input):
par1 = 48 ; par2 = 1 ; par3 = 0 ; par4 = 0 ; par5 = 12 ; par6 = White Noise ; par7 = 0.95 ; par8 = ;
R code (references can be found in the software module):
if (par1 == 'Default') {
par1 = 10*log10(length(x))
} else {
par1 <- as.numeric(par1)
}
par2 <- as.numeric(par2)
par3 <- as.numeric(par3)
par4 <- as.numeric(par4)
par5 <- as.numeric(par5)
if (par6 == 'White Noise') par6 <- 'white' else par6 <- 'ma'
par7 <- as.numeric(par7)
if (par8 != '') par8 <- as.numeric(par8)
ox <- x
if (par8 == '') {
if (par2 == 0) {
x <- log(x)
} else {
x <- (x ^ par2 - 1) / par2
}
} else {
x <- log(x,base=par8)
}
if (par3 > 0) x <- diff(x,lag=1,difference=par3)
if (par4 > 0) x <- diff(x,lag=par5,difference=par4)
bitmap(file='picts.png')
op <- par(mfrow=c(2,1))
plot(ox,type='l',main='Original Time Series',xlab='time',ylab='value')
if (par8=='') {
mytitle <- paste('Working Time Series (lambda=',par2,', d=',par3,', D=',par4,')',sep='')
mysub <- paste('(lambda=',par2,', d=',par3,', D=',par4,', CI=', par7, ', CI type=',par6,')',sep='')
} else {
mytitle <- paste('Working Time Series (base=',par8,', d=',par3,', D=',par4,')',sep='')
mysub <- paste('(base=',par8,', d=',par3,', D=',par4,', CI=', par7, ', CI type=',par6,')',sep='')
}
plot(x,type='l', main=mytitle,xlab='time',ylab='value')
par(op)
dev.off()
bitmap(file='pic1.png')
racf <- acf(x, par1, main='Autocorrelation', xlab='time lag', ylab='ACF', ci.type=par6, ci=par7, sub=mysub)
dev.off()
bitmap(file='pic2.png')
rpacf <- pacf(x,par1,main='Partial Autocorrelation',xlab='lags',ylab='PACF',sub=mysub)
dev.off()
(myacf <- c(racf$acf))
(mypacf <- c(rpacf$acf))
lengthx <- length(x)
sqrtn <- sqrt(lengthx)
load(file='createtable')
a<-table.start()
a<-table.row.start(a)
a<-table.element(a,'Autocorrelation Function',4,TRUE)
a<-table.row.end(a)
a<-table.row.start(a)
a<-table.element(a,'Time lag k',header=TRUE)
a<-table.element(a,hyperlink('basics.htm','ACF(k)','click here for more information about the Autocorrelation Function'),header=TRUE)
a<-table.element(a,'T-STAT',header=TRUE)
a<-table.element(a,'P-value',header=TRUE)
a<-table.row.end(a)
for (i in 2:(par1+1)) {
a<-table.row.start(a)
a<-table.element(a,i-1,header=TRUE)
a<-table.element(a,round(myacf[i],6))
mytstat <- myacf[i]*sqrtn
a<-table.element(a,round(mytstat,4))
a<-table.element(a,round(1-pt(abs(mytstat),lengthx),6))
a<-table.row.end(a)
}
a<-table.end(a)
table.save(a,file='mytable.tab')
a<-table.start()
a<-table.row.start(a)
a<-table.element(a,'Partial Autocorrelation Function',4,TRUE)
a<-table.row.end(a)
a<-table.row.start(a)
a<-table.element(a,'Time lag k',header=TRUE)
a<-table.element(a,hyperlink('basics.htm','PACF(k)','click here for more information about the Partial Autocorrelation Function'),header=TRUE)
a<-table.element(a,'T-STAT',header=TRUE)
a<-table.element(a,'P-value',header=TRUE)
a<-table.row.end(a)
for (i in 1:par1) {
a<-table.row.start(a)
a<-table.element(a,i,header=TRUE)
a<-table.element(a,round(mypacf[i],6))
mytstat <- mypacf[i]*sqrtn
a<-table.element(a,round(mytstat,4))
a<-table.element(a,round(1-pt(abs(mytstat),lengthx),6))
a<-table.row.end(a)
}
a<-table.end(a)
table.save(a,file='mytable1.tab')